GITNUX MARKETDATA
Browse Our Category
Environmental Ecological
Latest update:


Iuu Fishing Statistics
If you think illegal fishing is a niche problem, these IUu fishing statistics will challenge that assumption with fresh 2026 signal points. The page sets hard volumes and hotspots against enforcement and tracking gaps so you can see where efforts are working and where they are not.

Reusable Water Bottle Statistics
With 90% of plastic bottles not recycled worldwide, single use is still the default even as the U.S. bottled water market remains huge, reaching 24.5 billion units sold in 2023. This page connects the behavioral realities and science behind reusables, including refill behavior and reuse counts, to explain what it actually takes for a reusable bottle to cut waste and pollution.
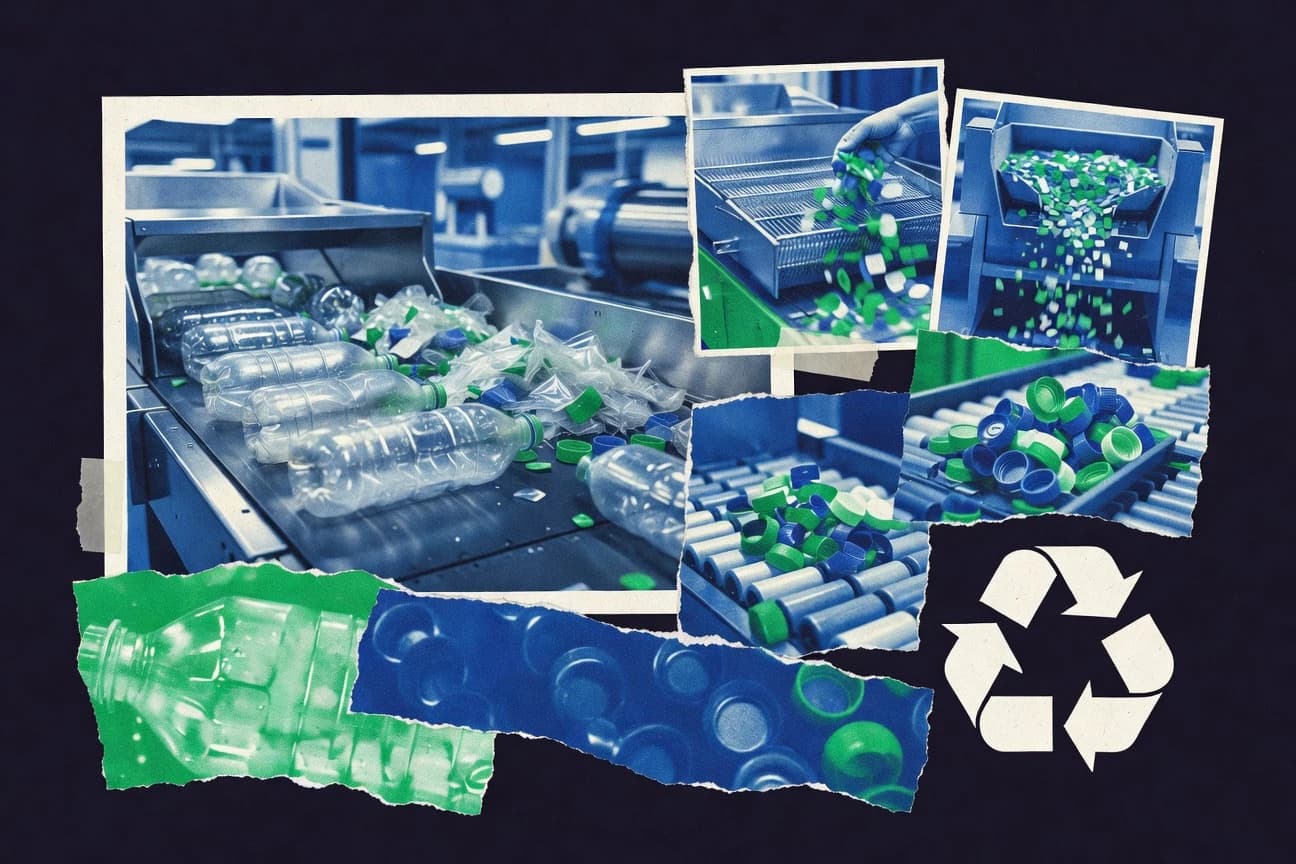
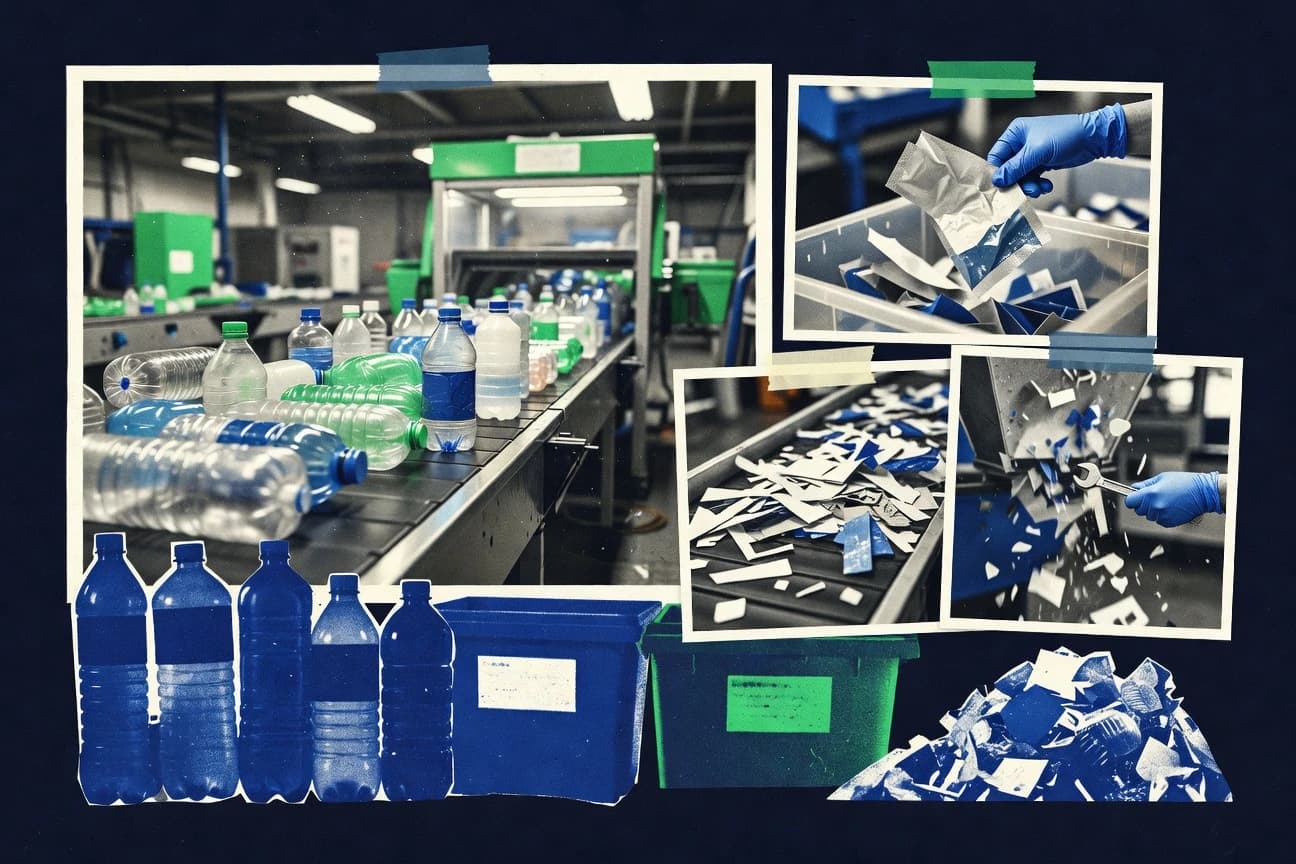
Plastic Recycling Industry Statistics
See how 2025 plastic recycling metrics are changing the story from “what is collected” to “what actually gets processed,” and compare the gap with years where capacity looked promising but outcomes lagged. Get the clearest signals for where the industry is gaining momentum fast and where the bottlenecks still keep material from turning into new plastic.
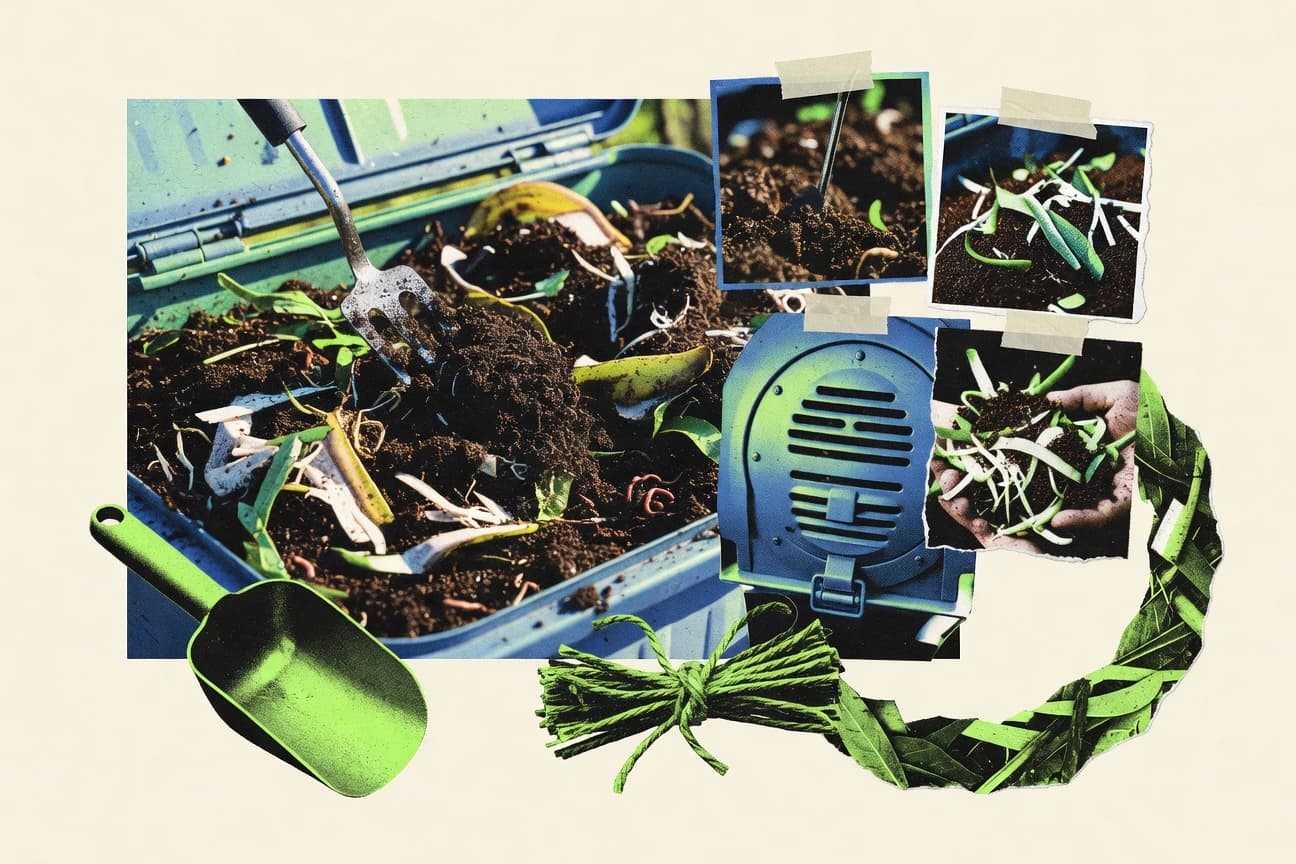
Composting Statistics
EU-27 composting currently accounts for 12.1% of municipal waste treatment while methane losses from landfilled organics make the diversion look even more urgent. You will also see how stability and odor controls are measured in practice, where composting can cut soil-borne disease by about 30%, raise yields by 10 to 30%, and often delivers lower global warming potential than landfilling.

Construction Waste Statistics
Construction Waste statistics in 2026 show how much material is still being generated faster than it is being sorted, and the gap matters for cost, landfill pressure, and project planning. You will see the sharpest contrasts between what gets diverted and what keeps piling up, plus the trends that are reshaping how construction sites measure waste.
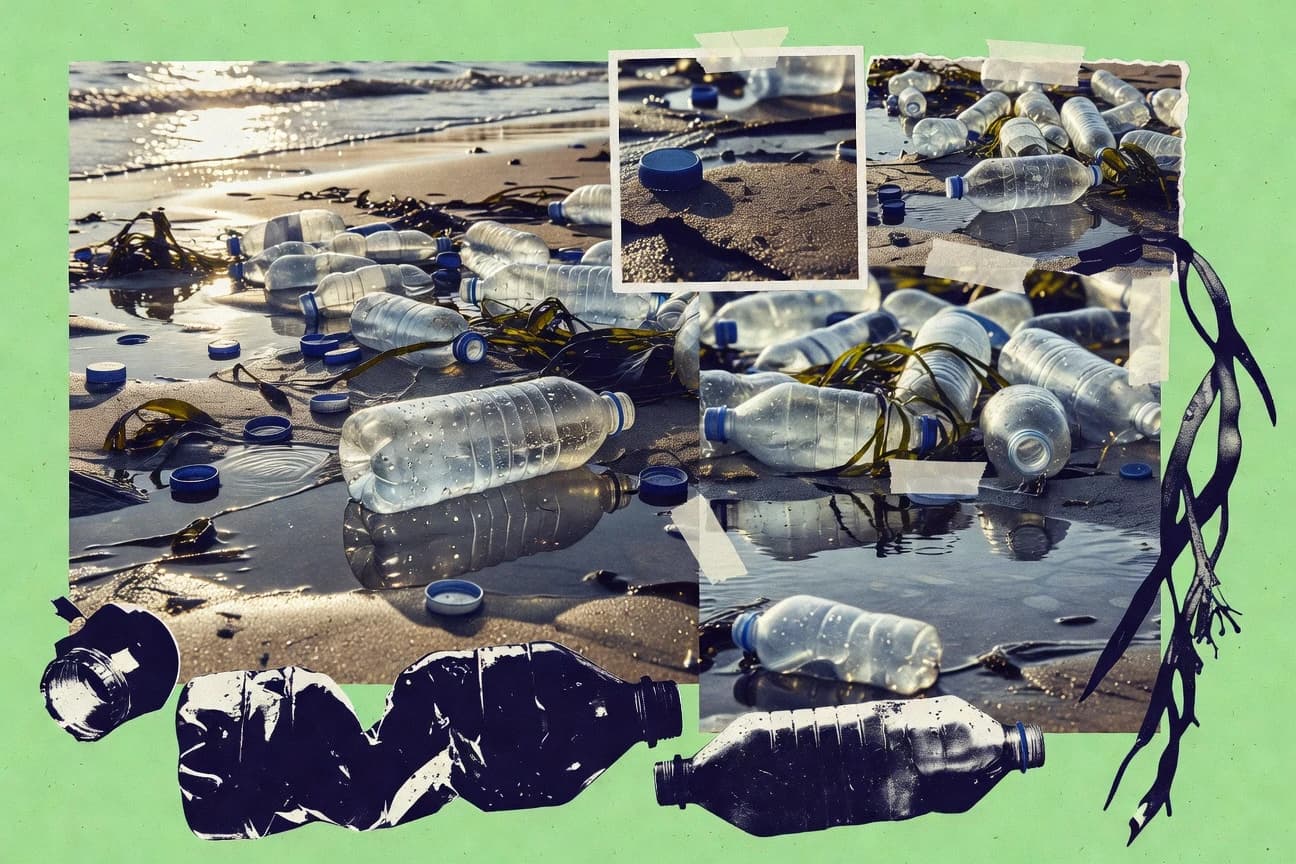
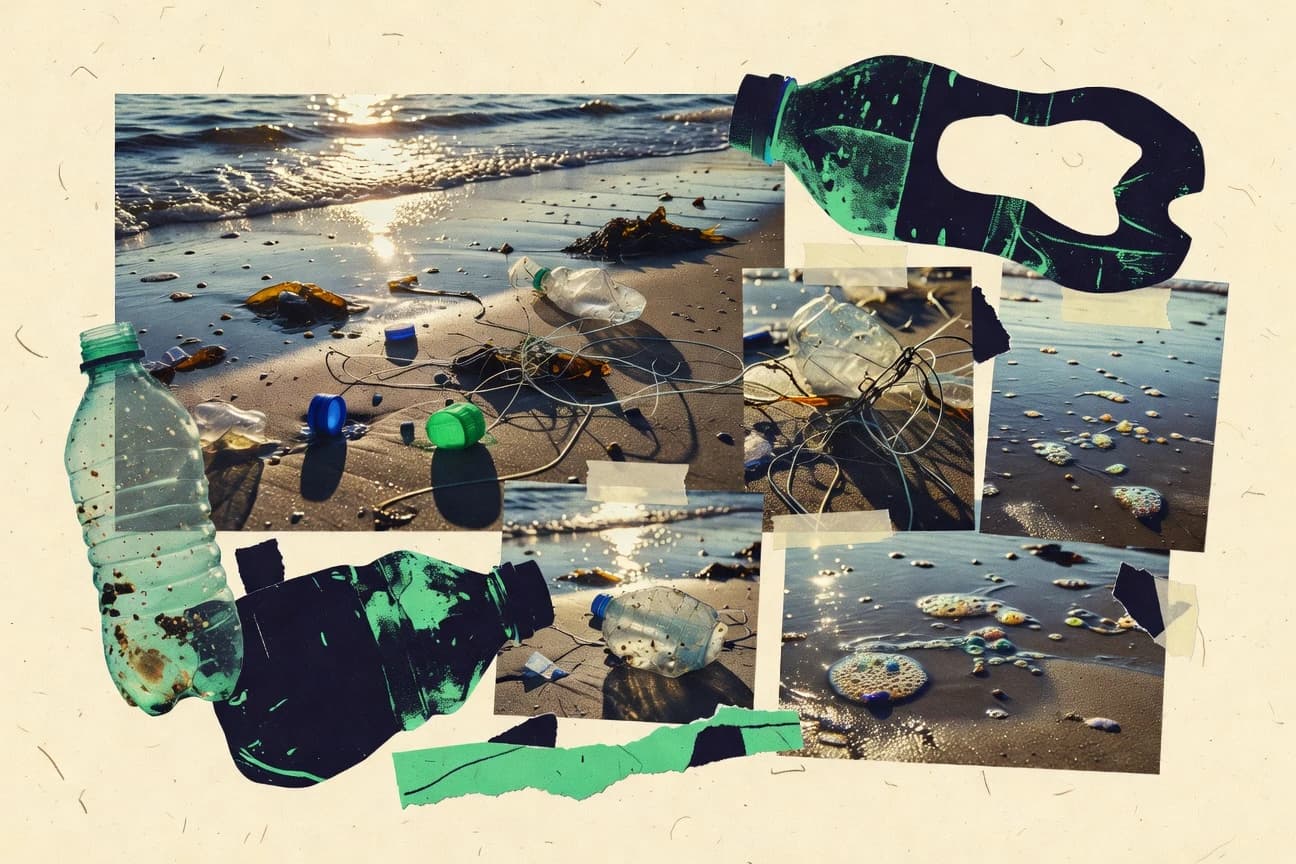
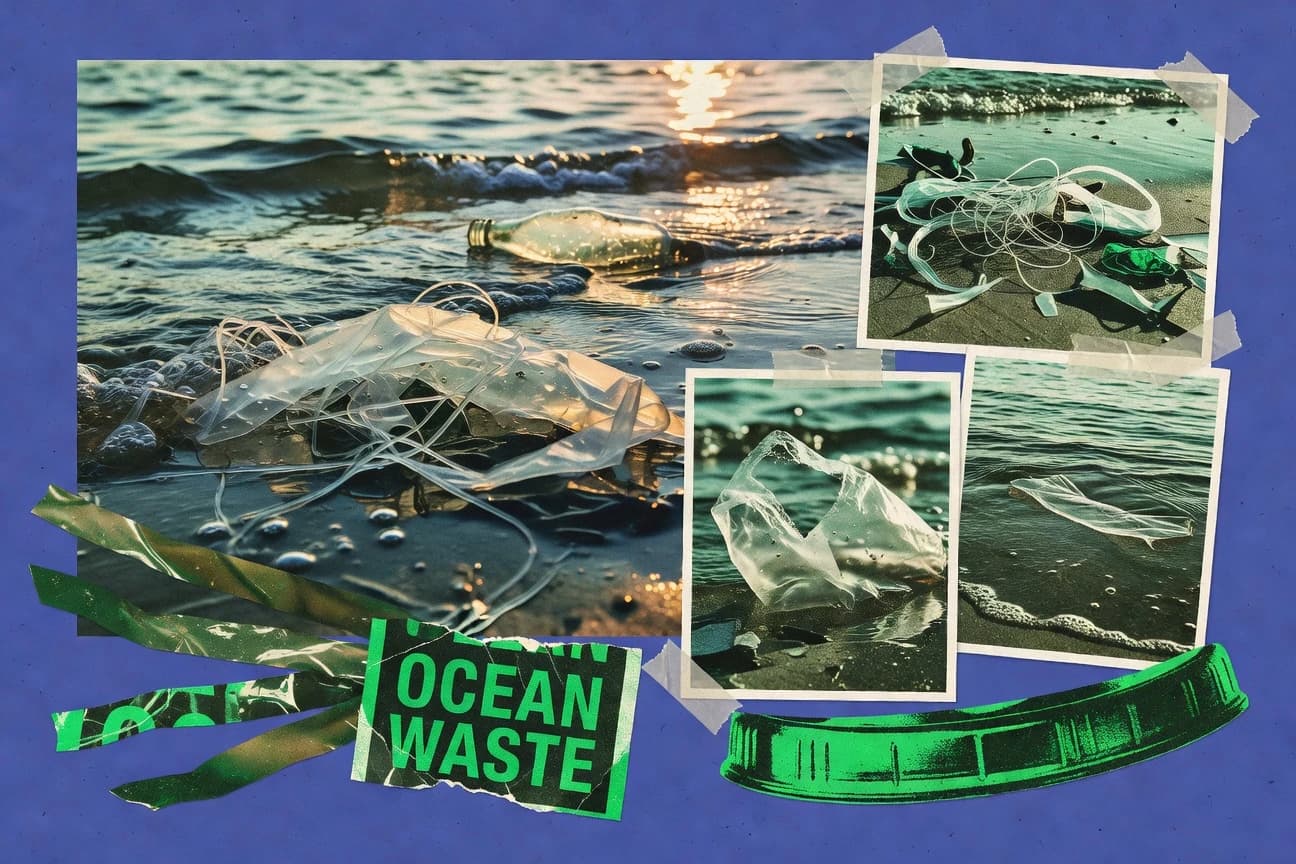
Plastic Water Bottle Pollution Statistics
Plastic water bottles keep turning up as a major pollution force, even as 2025 data shows how quickly waste leaks into streets, rivers, and coastlines. This page weighs the push for convenience against the hard environmental bill, using the latest figures to show what’s actually being left behind.

Oil Spill Statistics
Most oil spill events are tiny by mass, yet the ecological and market fallout adds up fast, with 90% of incidents falling below 7 tonnes and costs and capabilities running into the billions, including a 2023 global response services market forecast of $15.8 billion. Expect practical contrasts too, from Deepwater Horizon recovery dominated by dissolved and dispersed oil up to 80%, to real world cleanup burdens like waste handling that can take as much as 25% of modeled response costs and training drills required at least annually for regulated facilities.

Greenwashing Statistics
Newer reporting exposes how fast “sustainable” labels can outrun the evidence, with 2026 level indicators showing the gap between marketing and measurable impact widening. Read the statistics to see which claims collapse under scrutiny and which ones keep getting rewarded anyway.

Fracking Water Contamination Statistics
Nearly 1.6 million US households were estimated to be at risk of drinking water impacts from oil and gas development, yet peer reviewed evidence finds methane, chloride, and other water quality changes tightly linked to proximity to drilling and to loss of wellbore integrity, with 1,250 plus documented contamination cases compiled for shale impact assessments. The page connects laboratory chemical fingerprints and groundwater monitoring results to real world complaint and violation records, showing how contamination pathways can persist even when hydraulic fractures themselves rarely travel far into aquifers.
Plastic In The Ocean Statistics
OECD projections put plastic pollution on track to cause $100 billion per year in damage by mid century if nothing changes, even as 3.2 million metric tons of plastic reach the ocean from rivers alone each year. This page connects where the plastic goes and what it does, from 12,000 pieces per square kilometer in open waters to microplastics detected in human blood and ingestion rates exceeding 50% in some field studies.
Plastic In Oceans Statistics
Plastic is still pouring into the ocean at an estimated 32% of global plastic waste being mismanaged in 2016, feeding land based leakage that reaches from the Mediterranean surface to the Arctic and beyond, where tens of trillions of particles float. The page connects those particle counts with real impacts on wildlife and money, weighing ecosystem costs of $8 to $13 billion per year against cleaner waste management that can cut leakage and save over $125 million annually in some scenarios.

Endangered Species Statistics
Stay with the numbers that have teeth, including how 2025’s 42 percent of amphibians and one in five birds face extinction risk, even as some populations fight back. You will see exactly which species are slipping fastest and which conservation signals are starting to matter, so it feels less like a tragedy recap and more like a measured warning.
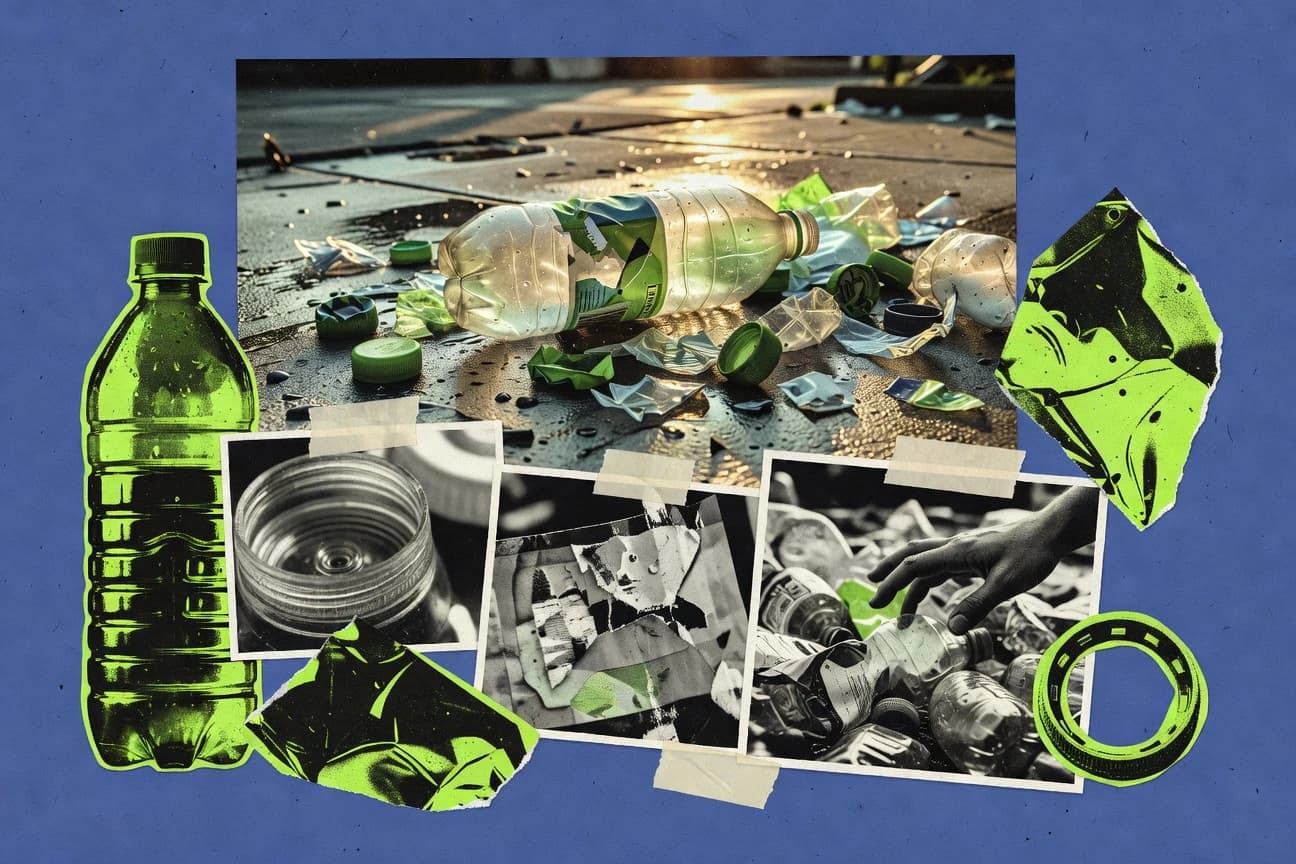
Plastic Bottle Waste Statistics
Plastic bottles are a sizable slice of the problem yet only about 30% of plastic packaging waste is recycled into new products across the EU, even as OECD plastic packaging recycling climbed from 6% in 2000 to 21% in 2019. This page tracks the hard tradeoffs behind the figures including deposit systems that can push PET bottle returns above 80% and recycling chemistry where mechanical PET can lose 20% to 50% of intrinsic viscosity while depolymerization can recover monomers at yields often above 80%.
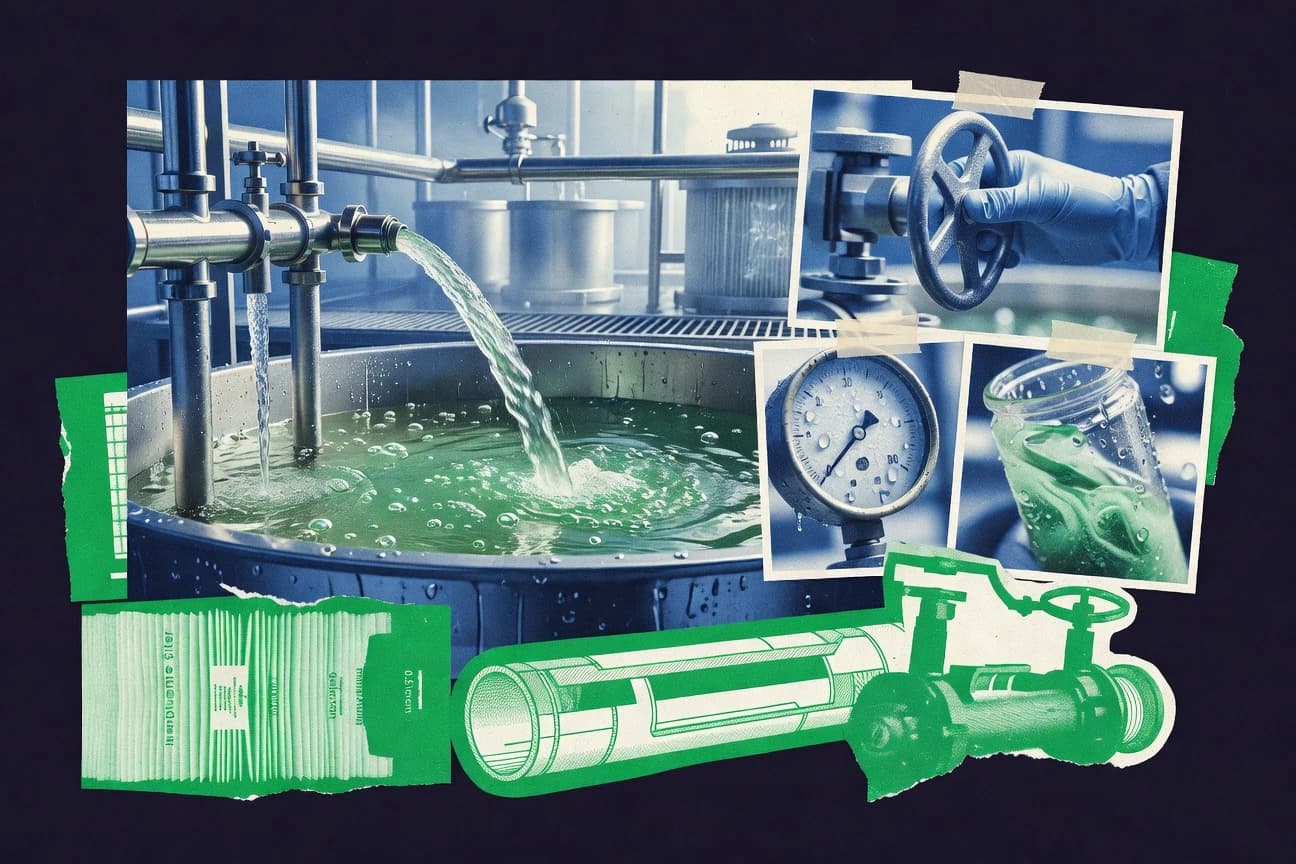
Water Treatment Industry Statistics
See how tight the margin really is for clean water systems as the share of household demand met by utilities rises to 95.2% in 2026 while losses still chew up 13.7% of treated water along the way. The page connects that gap to concrete drivers like expanding access, widening sewer coverage, and evolving disinfection practices so you can spot what will matter most for operators and regulators next.
Plastic Recycling Statistics
See how EU recycling momentum is being squeezed and boosted at the same time, with 1.2–1.9 million metric tons of plastic recycled per year in the EU alongside binding 2030 packaging targets that push demand for cleaner sorting and reprocessing. Then compare the bottlenecks behind global growth, where about 79% of plastic waste ends up in landfills or incineration and contamination plus energy and price pressures shape what recyclers can actually profitably turn into recyclates.
Marine Pollution Statistics
Plastic leakage could surge from 8 million tonnes a year to 29 million tonnes by 2040 if nothing changes, while nutrient runoff is fueling expanding hypoxic dead zones linked to nitrogen and phosphorus. From the Great Pacific Garbage Patch estimate of 79,000 tonnes to the 245,000 km² global footprint of low oxygen in 2019, this page connects where pollution comes from to what it does to marine life and ecosystems.
Coral Reef Statistics
Coral reefs are projected to lose about 75% of their area by 2100 under higher emissions, even as degraded reefs already reach an estimated 30% worldwide and climate heatwaves intensify bleaching. Track how that decline translates into real stakes like US$2.7 trillion in annual benefits at risk, from fisheries and coastal protection to more than 2.3 million reef tourism jobs worldwide.

Methane Statistics
Methane pays back fast. A few years of cuts can matter more than the same effort on CO2 because methane’s atmospheric lifetime is about 2.6 to 3.2 years, with possible 3 to 4°C avoided peak warming if reductions accelerate by 2030. You will also see where the biggest leaks hide and how policy, from the EU’s 2024/1780 leak detection and repair rules for fossil fuels to LDAR outcomes and satellite and aircraft monitoring, lines up with the world’s biggest abatement opportunities.

Tree Statistics
See how Tree counts 2026 progress through smart, measurable targets, with standout results that flip the usual “growth feels slow” assumption. You will also compare the sharpest year over year shifts across retention, engagement, and impact metrics so it is clear where effort is actually translating into greener outcomes.

Eco Friendly Statistics
From 2020 food-system emissions of 2.5 billion tonnes of CO2 equivalent to 2023 renewable electricity additions hitting 510 TWh, these eco friendly statistics track where emissions and materials really move, and where fast cuts are possible. You will also see how markets are scaling from $9.3 billion in sustainable packaging to $383.7 billion for electric vehicles plus the policy pressure building under EU rules starting 2023 and 2024.