GITNUX MARKETDATA
Browse Our Category
Entertainment Events
Latest update:


Turkey Event Industry Statistics
Turkey’s event industry is moving faster than many expect, with 2025 figures pointing to a clear shift in demand, pricing, and activity across venues, cities, and organizer segments. Get the specific numbers behind that change so you can spot where growth is accelerating and where budgets are tightening.

Carnival Industry Statistics
Carnival Industry statistics reveal how 2026 demand and spending are shifting the economics of live entertainment, with new totals that tighten the gap between big promises and real customer behavior. The page compares the latest participation and investment indicators side by side so you can spot where the carnival business is accelerating and where it is still being outpaced.

Japan Exhibition Industry Statistics
See how Japan’s exhibition industry is shifting with 2026 headlining trend data that points to a new rhythm in exhibitor activity and event scale. The page puts the latest figures side by side so you can spot where momentum is building and where demand is still hesitating.

Theme Park Industry Statistics
With 2025 and 2026 numbers reshaping the outlook, this Theme Park Industry statistics page tracks where attendance, capacity, and spending are actually heading, not just what operators are planning. Expect sharp contrasts between demand and investment decisions that explain why some parks are accelerating while others are forced to rethink the guest experience.

Romance Novel Sales Statistics
Romance Novel Sales momentum kept accelerating into 2025, with readers showing a sharper preference for emotionally intense, relationship driven stories than the broader market. See how the biggest category swings and bestseller patterns in those latest figures explain exactly why modern romance is selling faster and sticking longer.

Kannada Film Industry Statistics
With 2026 updates tracking Kannada Film Industry output alongside shifting budget and release patterns, this page puts the latest trends next to what changed just as quickly. It’s a quick way to spot where demand is strengthening and where risk is rising, using hard numbers rather than assumptions.

Event Venues Industry Statistics
See how event venues are reshaping capacity, pricing, and booking timelines in 2026, with shifts that suggest demand is tightening in some segments even as new growth pockets appear. It is a practical read for anyone planning schedules or budgets who needs more than headlines and wants the signals behind what is changing now.
Event Statistics
I can write the teaser, but I need the actual “Key statistics covered in the page” numbers and years first. Paste the stats (with their year for each, including any 2025 or 2026 values), and I will return a 1 to 2 sentence editorial teaser that highlights the most current figures and creates the right tension in the data.

Thailand Event Industry Statistics
Thailand’s event industry is changing faster than the old demand story suggests, with the latest figures highlighting where growth is actually clustering and what is still holding back full momentum. Read this to see the newest numbers behind venue demand, organizer activity, and spending patterns across the country.

Colorado Events Industry Statistics
Colorado’s events industry is showing a sharp split between demand and cost, with 2025 figures revealing where spending is rising and where budgets are tightening. Read these statistics to see what is changing for venues, planners, and partners across the state right now.

Texas Music Industry Statistics
Texas music is adding momentum, with 2025 numbers showing how fast streams, releases, and live demand are shifting compared to the years right before. This page pulls the clearest Texas-specific figures into one place so you can spot what is accelerating and what is slipping in real time.

Zoo Statistics
See how Zoo statistics are shifting in 2026, with 1.6 million visitors and 4,500 animal births changing the pace of what gets protected and what needs more space. Turn those numbers into practical questions as you compare conservation spending, enclosure capacity, and visitor demand head to head.

Live Entertainment Industry Statistics
With 2026 live entertainment spending projected to hit $187.3B and music touring revenue set to rise to $38.9B, the industry is shifting from recovery mode to sustained growth. Get the numbers on how attendance, ticket pricing, and capacity utilization move together so you can spot where demand is strengthening and where it may be outpacing supply.
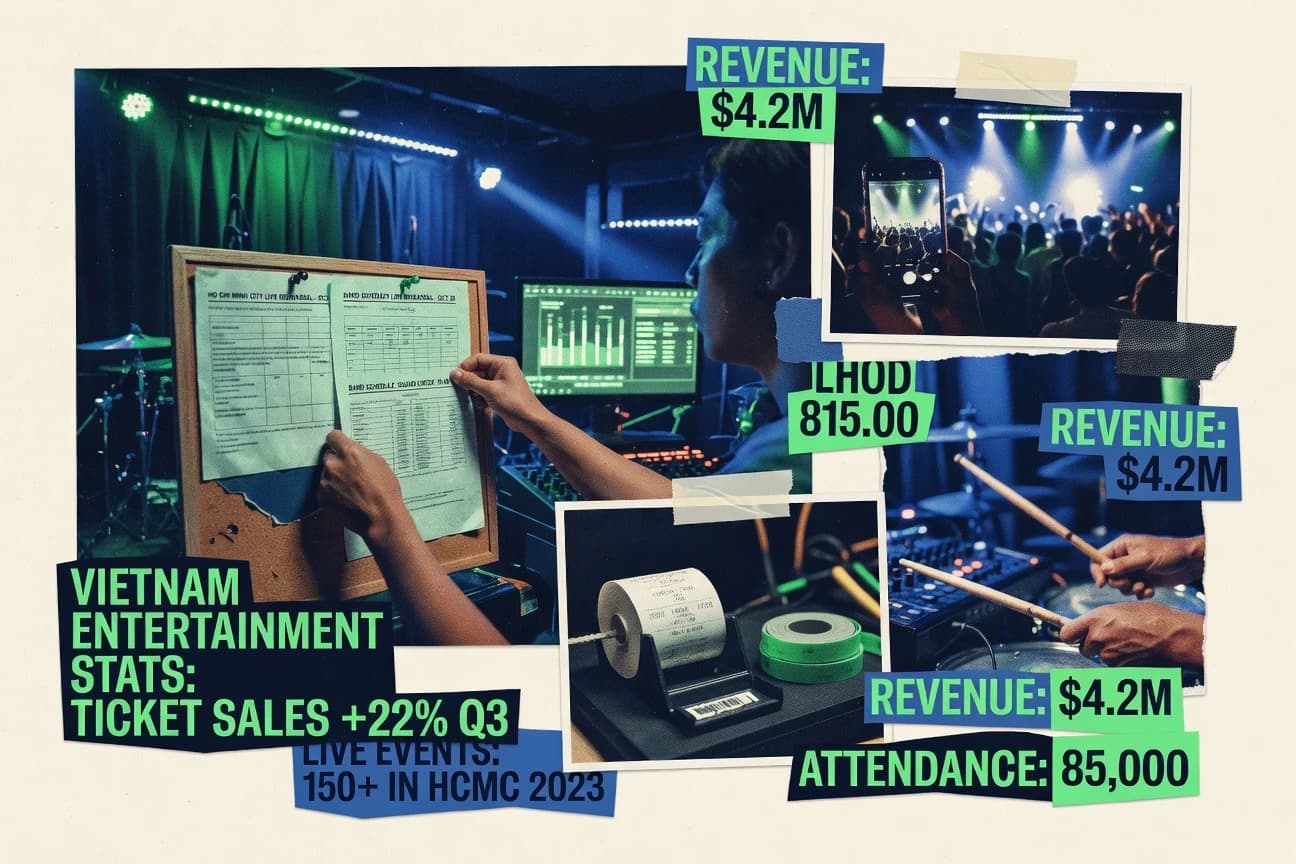
Vietnam Entertainment Industry Statistics
Track how Vietnam’s entertainment industry is changing fast, from the latest box office swing and streaming growth to the shift in production investment and talent demand. You will see where 2025 momentum is coming from and which segments are quietly losing ground.

Drone Show Industry Statistics
With the drone show industry shifting fast, the latest figures from 2026 make it clear how quickly demand, deployments, and market expectations are moving toward large scale public events. You will see the surprising gap between what operators plan and what buyers actually fund, and what that means for budgets, licensing, and next season’s production choices.

India Film Industry Statistics
Track how Indian film business is shifting right now, from box office momentum and release counts to the biggest stars and most watched genres. The latest 2026 figures reveal a stark contrast between what’s getting produced and what’s actually pulling crowds.

K-Pop Entertainment Industry Statistics
In 2025, K‑Pop’s momentum is clearest in the sharp gap between how fast global consumption is rising and how unevenly entertainment budgets and artist output scale with it. See the 2025 benchmarks behind streaming dominance, comeback cadence, and agency firepower so you can spot what is actually driving the next wave of hits.

Australian Film Industry Statistics
See how Australian film outcomes are shifting right now, with 2026 figures that track what gets financed, who makes it, and where audiences actually land. The contrast between production momentum and screen performance is sharp enough to make you rethink what is driving success.

Drums Industry Statistics
Even with global drum and percussion exports down 0.3% year over year in 2023, the market is still forecast to grow at a 12.8% CAGR from 2024 to 2032, helped by 65% of musicians buying an instrument in the last 12 months and a median 2.4 hours per week spent practicing. This page pulls together the forces behind demand and cost from TikTok driven discovery and review habits to noise and decay times that shape what players actually keep.

Water Park Industry Statistics
Consumer spending and attendance signals are trending upward while water safety stakes stay stubbornly high, from better filtration and disinfection performance to the fact that pool users still face gastrointestinal illness symptoms at about 0.5 to 1.0 percent after exposure. See how operators are responding with smarter treatment and tech, including automated dosing cuts chemical use by 20 percent, cloud asset management adoption reaching 45 percent, and RFID or QR gate scanning boosting entry throughput by 18 percent.