GITNUX MARKETDATA
Browse Our Category
Sustainability In Industry
Latest update:

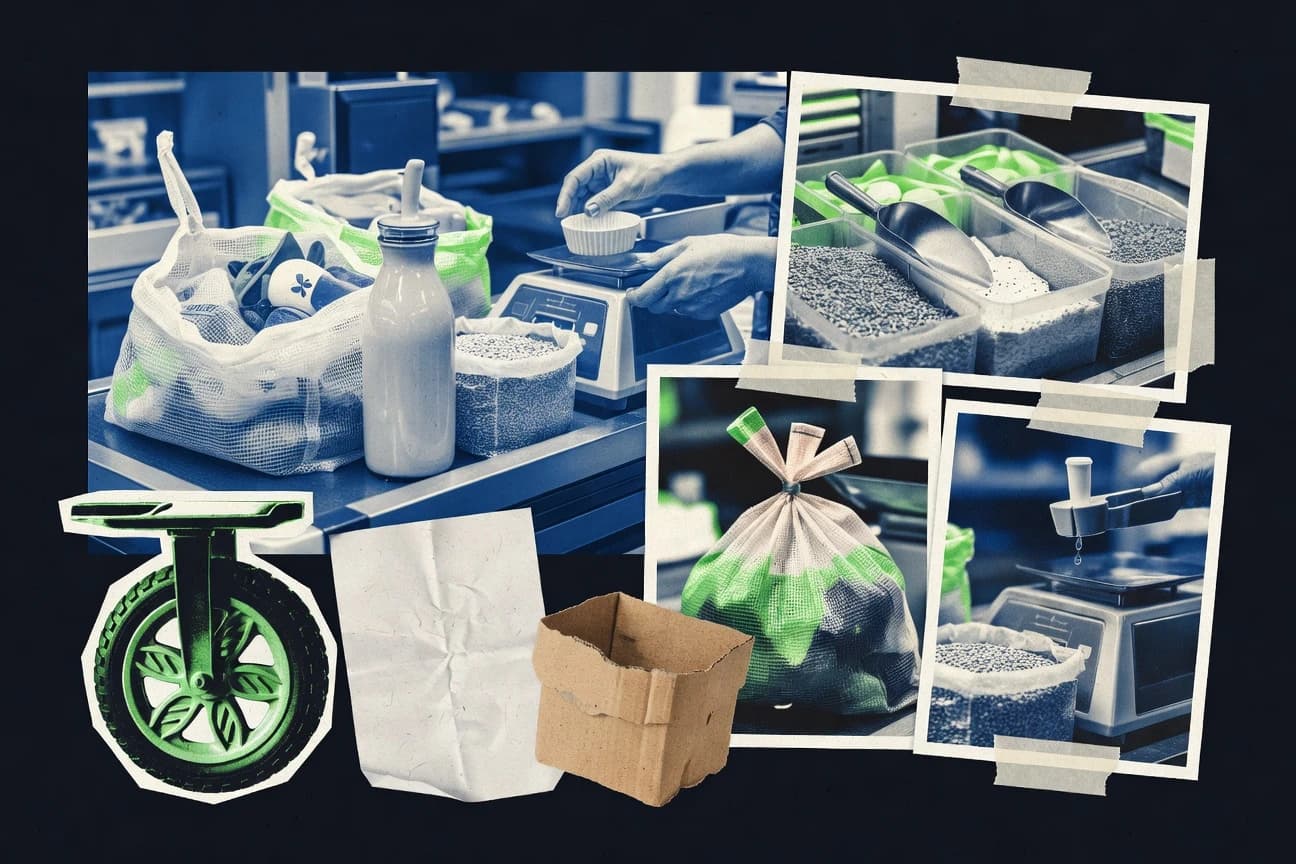
Sustainability In The Grocery Industry Statistics
Refrigeration, packaging and waste targets are tightening fast, from EU rules pushing all packaging to be recyclable by 2030 to food waste at retail driving 36% of supply chain waste in the U.S. Pair that with the urgency of methane’s 28 to 36 times higher warming power and you get a clear line from climate risk to practical choices grocery retailers and suppliers must make now.

Sustainability In The Chocolate Industry Statistics
Only 0.6% of cocoa products in EU retailer assortments are labeled as certified sustainability cocoa, even as climate and land pressure are intensifying, with 3.0°C of expected warming by 2100 under current policies. This page connects why sustainability adoption still lags behind the stakes, from deforestation hot spots in Ghana and Côte d’Ivoire to traceability gaps in 72% of cocoa traders and the $150+ million being spent to close the compliance and risk divide.

Sustainability In The Agriculture Industry Statistics
How do farm inputs and soil health balance when sustainability targets tighten? This page spotlights the sharp 2026 signals on agricultural sustainability, showing where progress is accelerating and where the gap between promises and practice is widening.

Sustainability In The Cosmetic Industry Statistics
EU cosmetics packaging recovery climbed from 41.3% in 2019 to 48.5% in 2022, but the EU also estimates packaging drives about 40% of all plastic waste, so compliance and product claims are under real pressure. From the 2024 EU Ecolabel limits on surfactant biodegradability and hazardous substances to rules like REACH, CSRD, and the Green Claims Directive, this page ties sustainability standards to measurable obligations brands must meet to earn consumer trust.

Fast Food Packaging Waste Statistics
Fast food packaging waste doesn’t just spike during busy hours, it concentrates in the bins where the volume is hardest to recover, and the latest 2025 figures reveal how quickly that problem adds up. You will see exactly how the newest trend shifts from single-use items to the waste stream that costs the most to manage.
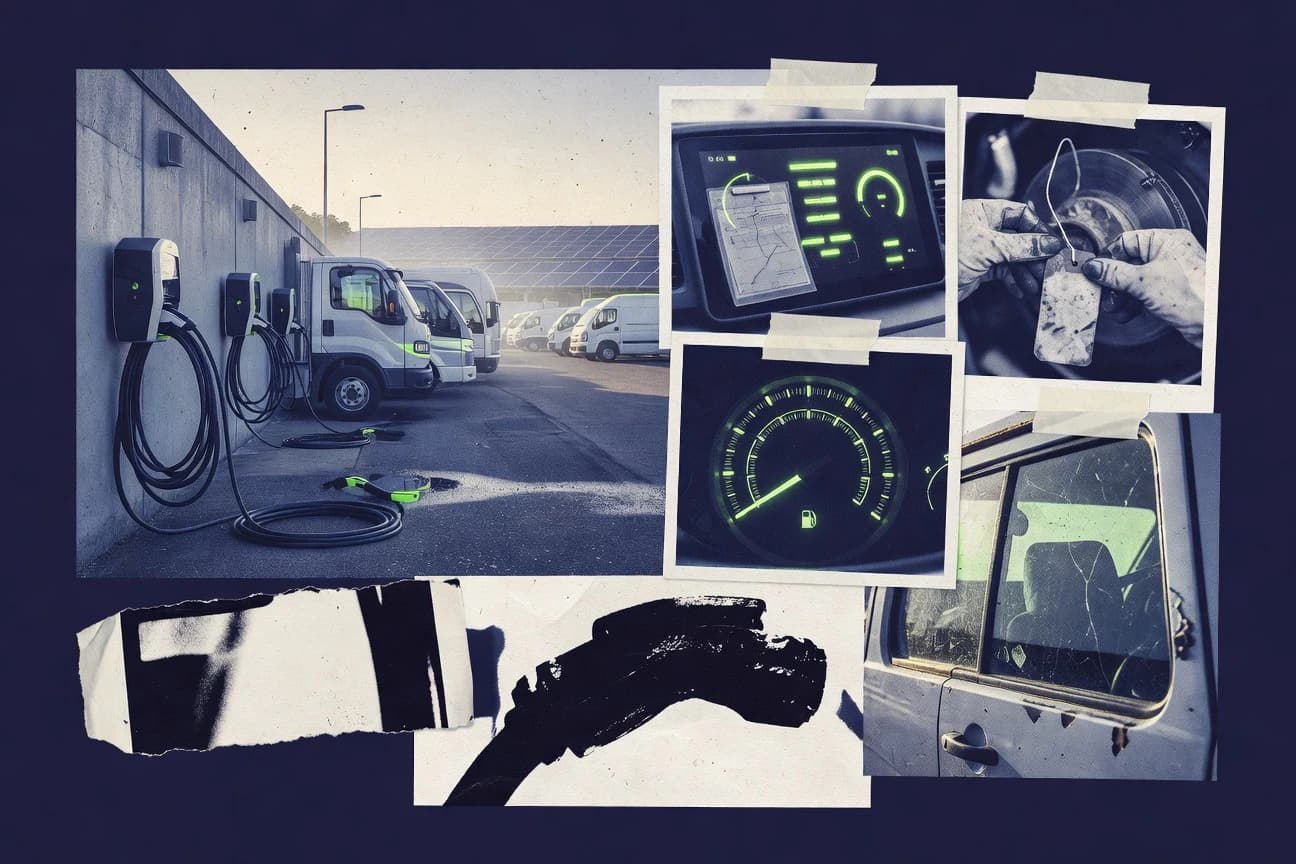
Sustainability In The Fleet Management Industry Statistics
When 27% of global energy related greenhouse gas emissions trace back to transport and EU rules now target tailpipe CO2 cuts for new cars from 2035, fleet leaders are forced to turn sustainability goals into procurement, charging and utilization decisions they can measure. From 66% of operators naming emissions reduction among their top sustainability priorities to smart charging that NREL says can cut grid peaks by up to 30%, these statistics connect regulation, cost and real world fleet behavior so you can see what will actually move the needle.

Sustainability In The Commercial Industry Statistics
Sustainability is moving from “nice to have” to deal breaker and board level priority, with 63% of commercial real estate professionals calling sustainability reporting important for investment decisions and 40% of office occupiers expecting it to shape lease negotiations in the next 2 to 3 years. This page pairs those market pressures with hard impact, from energy use cuts of 10% to 30% from smart controls and automated demand response to global green building spend and clean-tech markets that are still scaling up.
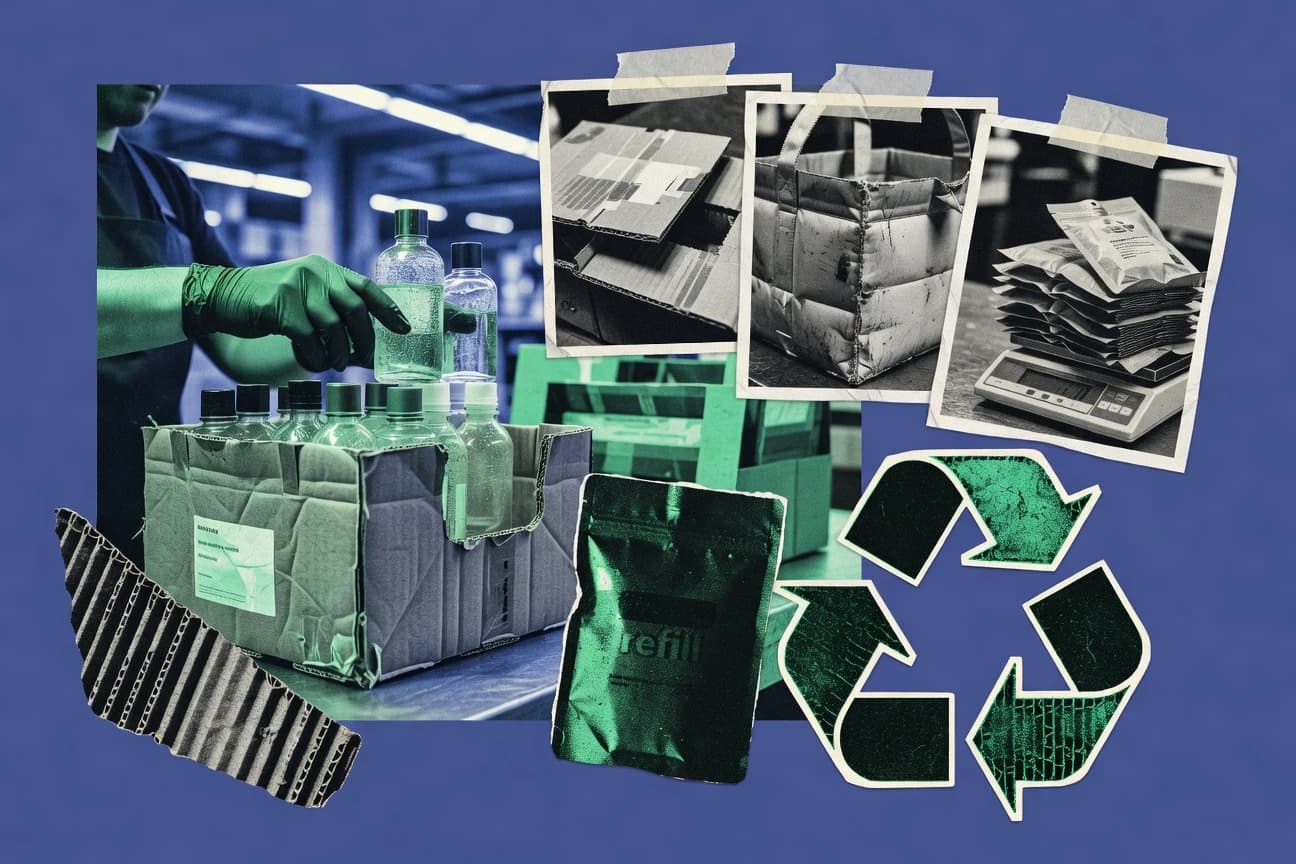
Sustainability In The Consumer Goods Industry Statistics
Get the most current read on sustainability in consumer goods, where 2026 targets collide with what companies are actually reporting. You will see which parts of the supply chain are improving fastest and where the gap keeps widening, backed by the key 2025 or latest figures driving boardroom decisions.

Sustainability In The Movie Industry Statistics
Fresh 2025 figures from the Sustainability In The Movie Industry statistics page reveal where film production is cutting waste fastest and where emissions still stubbornly lag behind. Use the sharp contrasts in the latest data to pressure-test which sustainability promises are real and which are just catching up.

Food Packaging Waste Statistics
Almost one third of all food produced is wasted globally, with 17% of that loss happening before retail during processing, which quietly amplifies upstream food packaging needs and the plastic bottleneck that 72% of packaging waste is not recycled. The page connects these pressures to real policy and consumer signals, from the EU move toward 90% collection and higher plastic recycling targets by 2030 to the 46% of EU citizens who generate food waste at home, showing exactly where packaging waste starts and why current decisions are already reshaping it.

Sustainability In The Furniture Industry Statistics
With the EU pushing mandatory Ecodesign for Sustainable Products rules from 2024 and a 42.5% renewable energy target by 2030, this page puts hard constraints on how furniture gets designed and sold. It also contrasts consumer intent with supply chain reality, from 68.3% of EU plastic packaging waste collected for recycling in 2022 to the fact that nearly 60% of life cycle greenhouse gases for energy related products often sit in use and transport, so greener materials alone may not be enough.
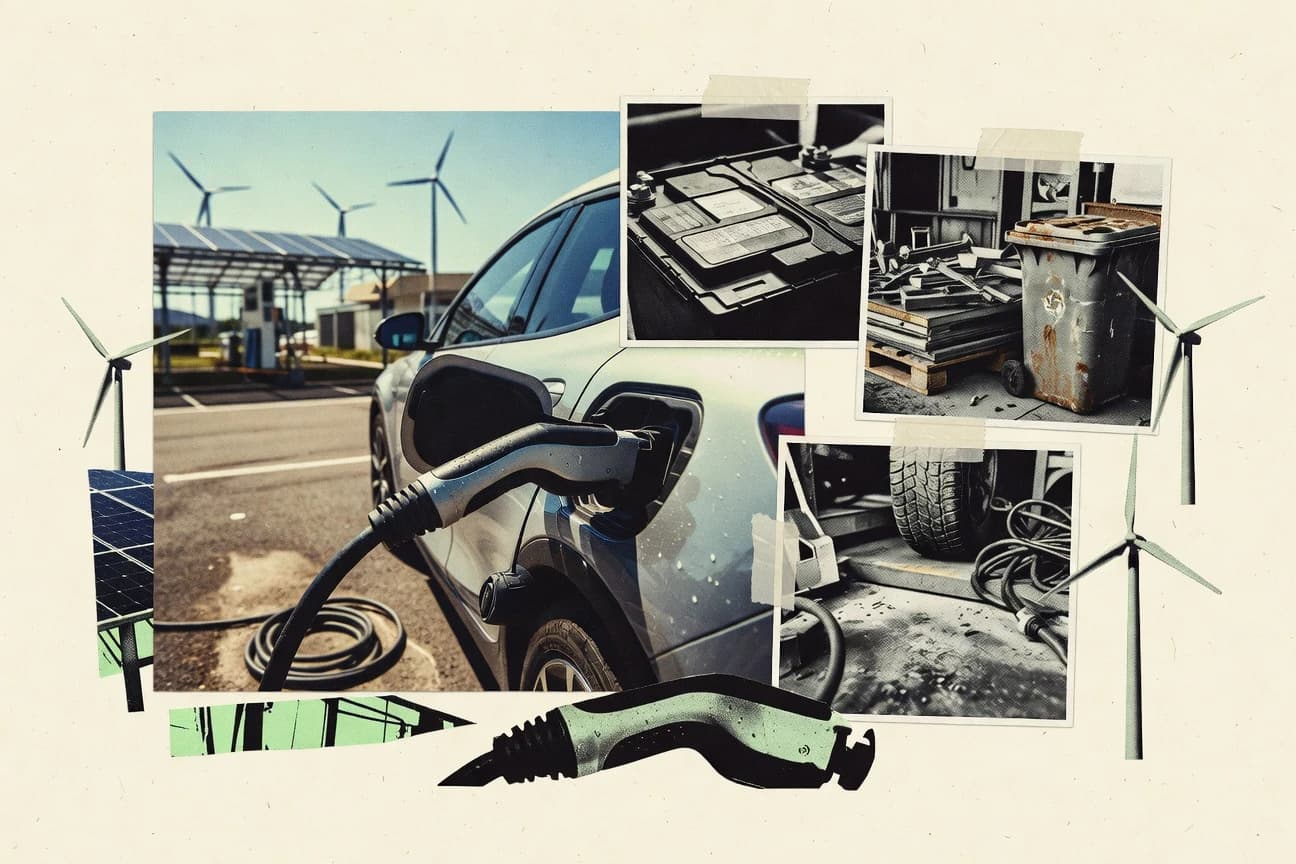
Sustainability In The Automobile Industry Statistics
See how electrification and cleaner manufacturing are reshaping the carbon footprint of cars right now, with 2025 data highlighting where emissions drop and where they stubbornly hold steady. You will also find 2026 related figures on recycling and battery supply that explain why sustainability progress depends as much on materials as it does on tailpipe changes.

Sustainability In The Adult Industry Statistics
A growing share of adult industry operations is shifting toward measurable sustainability, with 2026 figures showing more providers moving from pledges to practices. Read how the latest waste and energy trends compare to past compliance habits, and what that change suggests for real-world impact in the year ahead.
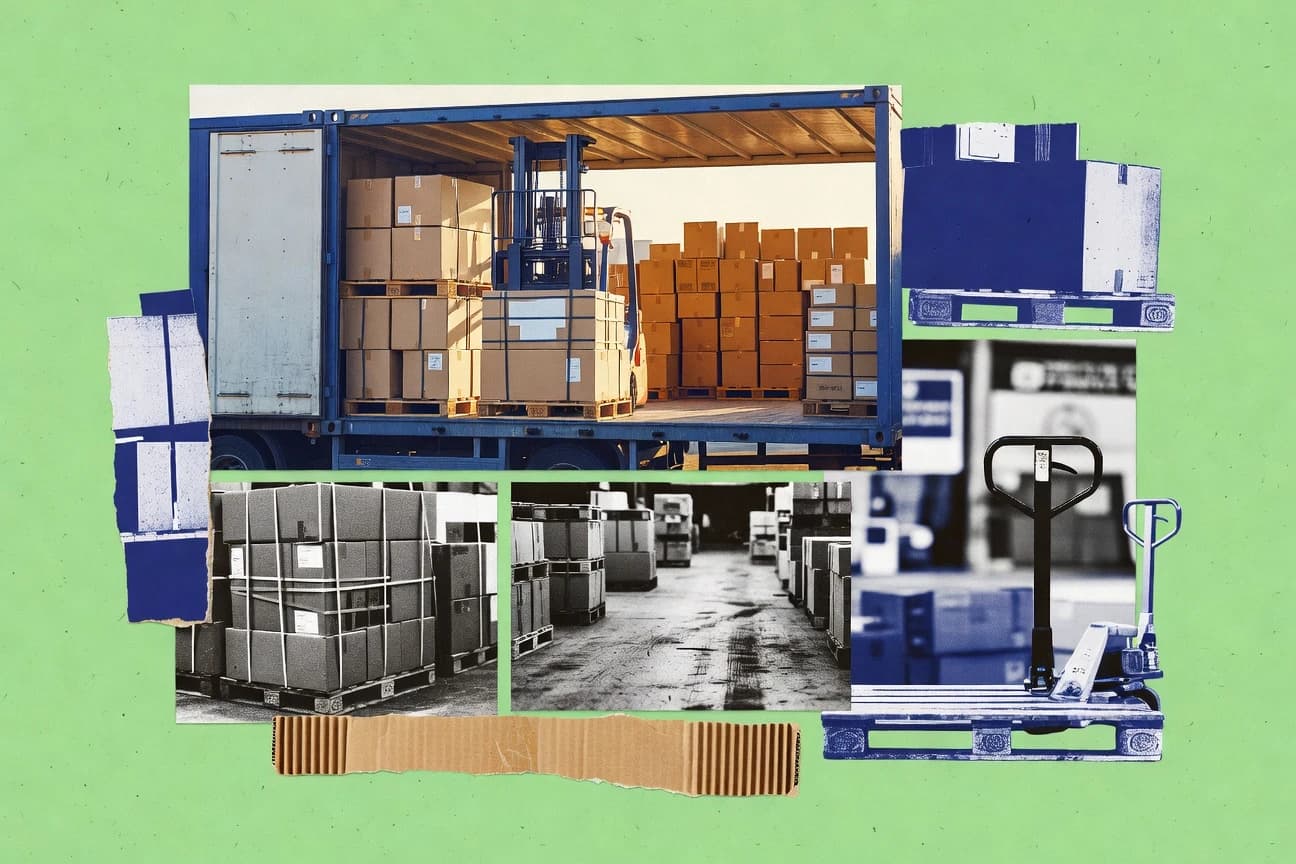
Sustainability In The Ltl Industry Statistics
What changes when less is promised and more is measured in LTL sustainability? See the latest 2025 and 2026 figures on emissions, efficiency, and facility progress to spot where buyers are getting real reductions and where the gap between targets and outcomes is still widening.
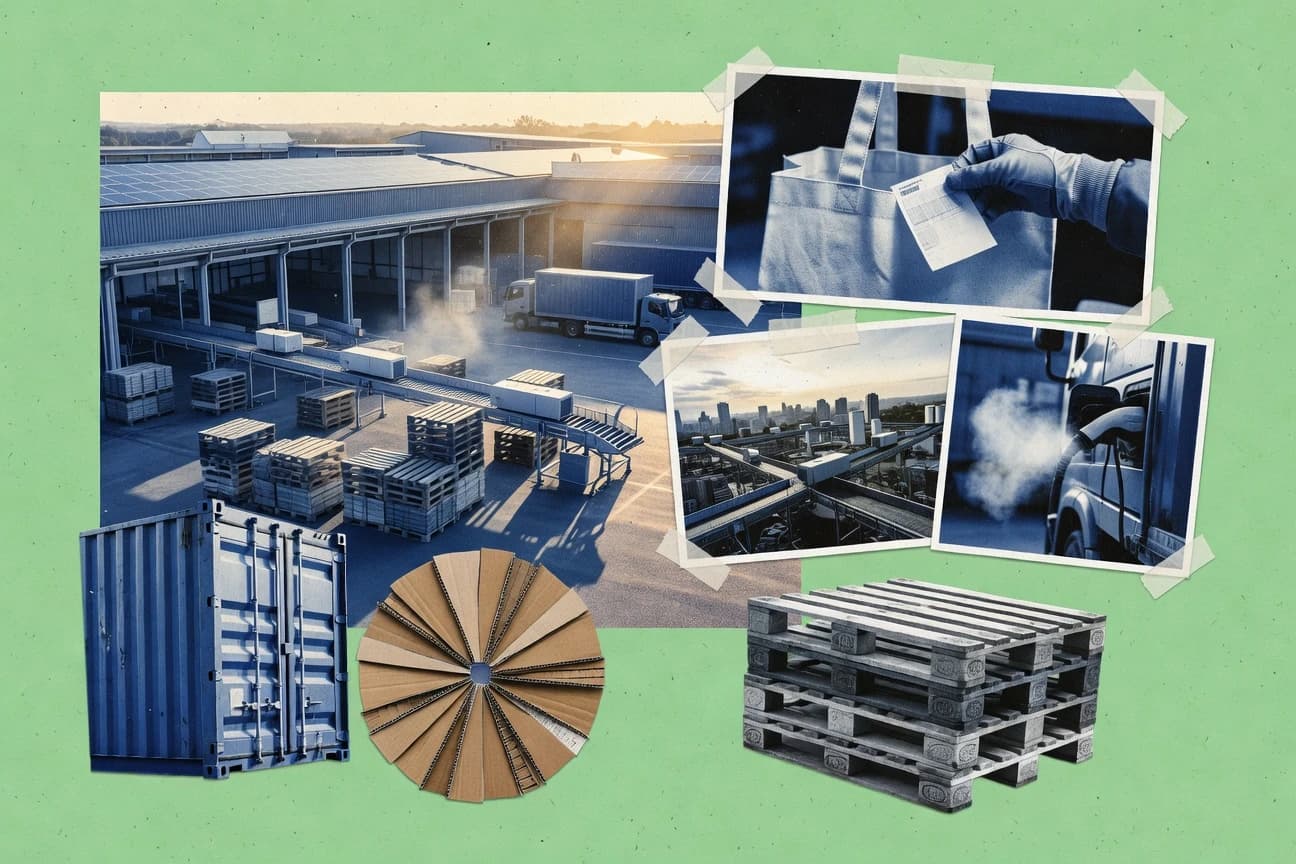
Sustainability In The Logistics Industry Statistics
Route optimization alone could cut logistics related CO2 emission potential by 10.4%, but the real friction is broader, from 45% of executives struggling with Scope 3 calculations to policy and technology shifts like a $6.2B sustainable logistics software market and FuelEU Maritime tightening shipping GHG intensity from 2025. If you want to understand where decarbonization savings actually get lost, stalled, or accelerated across procurement, planning, and regulation, this is the statistics page to revisit.

Sustainability In The Timber Industry Statistics
Forestry and land use still account for 1.7% of global greenhouse gas emissions in 2019, even as forests cover 3.5 billion hectares worldwide and nearly half of the planet’s forests face degradation pressures that can undermine timber supply. From 31.2 million cubic meters of EU wood imports in 2023 and compliance gaps found by WWF to how better managed forests and certified systems can shift carbon retention and operational impacts, the page connects climate relevance, legality, and on the ground extraction risks into one decision ready snapshot.

Sustainability In The Textile Industry Statistics
From a baseline of about 26 kg of textiles per person in the EU each year to rules tightening digital product passports, separate collection, and repairability requirements, this page shows how policy is shifting textiles from “use and discard” toward measurable reuse, recycling, and longer lifespans. It also pairs the environmental realities behind the headlines, including synthetic feedstocks and dyeing wastewater impacts, with the accountability tools brands face, from SVHC and REACH constraints to SB 62 labeling and LCA and carbon footprint methods used in claims.

Sustainability In The CRM Industry Statistics
See how CRM sustainability efforts are shifting from good intentions to measurable impact, with 2026 figures showing what adoption and reporting look like when companies stop treating green initiatives as optional. The contrast between commitment and operational change makes the statistics hard to ignore and easy to use in your next CRM decision.

Sustainability In The Health Insurance Industry Statistics
Health insurers are being pushed to prove sustainability with more than promises, and the latest figures show where environmental and social impact is starting to move measurable outcomes. Look for the sharp gaps between policy on paper and what actually changes in costs, coverage, and accountability through 2025.
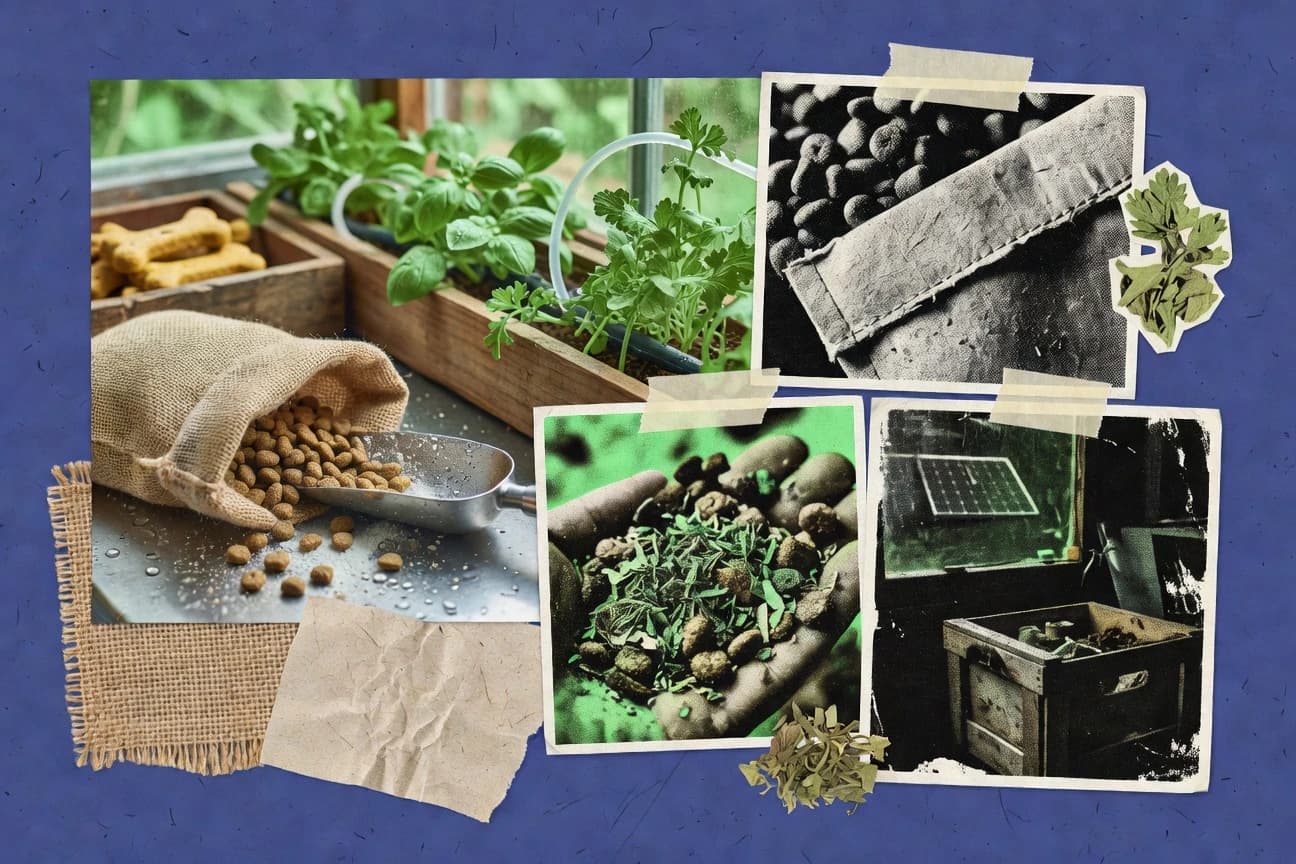
Sustainability In The Pet Food Industry Statistics
With pet food at $117.0 billion and 65% of owners willing to pay more for sustainable options, the page pinpoints where the real environmental pressure comes from and where it can realistically be cut, from feed land use to food loss and energy demand. It also connects policy and proof standards like CSRD, TCFD, and LCA rules to how brands substantiate claims, so you can see which sustainability moves reduce impact and which ones mainly change labels.