GITNUX MARKETDATA
Browse Our Category
Social Issues Societal Trends
Latest update:


Gun Violence By Race Statistics
See how gun death and injury rates split along racial lines, including the stark CDC finding that in 2021 the firearm homicide rate for Black people was 17.6 times that for White people. Then follow the pattern into who is harmed and who is missed by systems and interventions, from ED visit and hospitalizations that are heavily Black or Hispanic to prevention efforts that show measurable reductions when targeted to violence concentrated in affected communities.

Teen Sex Statistics
The latest Teen Sex data shows how fast risk can rise when facts are ignored and boundaries are blurred. You will see the sharp gaps in who is getting accurate information and who is ending up in situations they never meant to face.
Black Fatherless Statistics
Black Fatherless families carry a quiet weight that shows up in the sharpest ways, with 2026 data pointing to how missing fathers can ripple through outcomes faster than many expect. Get the concrete breakdown behind the most urgent statistics, and see what changes when you separate “father absent” from what the numbers say families actually need.

Body Positivity Statistics
Most people are told to chase a smaller body, yet 1 in 3 adults report experiencing appearance based bullying or harassment, showing how quickly harm can travel through everyday life. The page pulls together recent data to reveal exactly where the pressure hits and why body positivity needs to be treated as a public health issue, not a trend.

Hair Discrimination Statistics
In 2026, hair discrimination still shows up in high numbers, revealing how “professional” standards often punish natural textures and protective styles. Get the statistics that explain why the gap is not closing and what that means for hiring, discipline, and everyday treatment.

United States Prostitution Statistics
A look at the United States prostitution landscape, where the most recent numbers point to shifting patterns and renewed urgency rather than steady decline. You will see which trends have intensified and which communities are changing fastest, so you can understand what is driving the latest statistics.
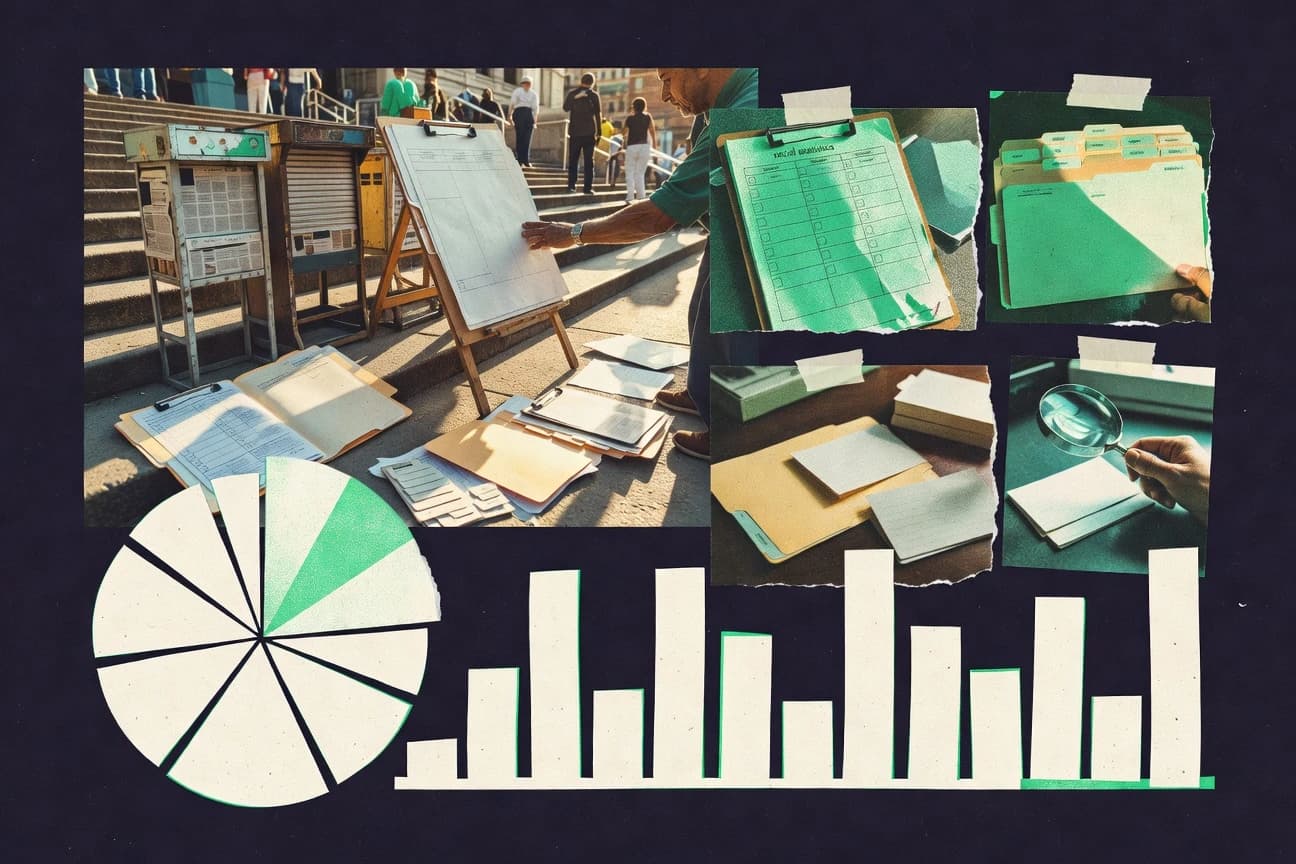
Racial Statistics
A recent snapshot of racial statistics reveals sharp swings in how outcomes and opportunities are distributed, with 2025 data highlighting where the gaps widened or narrowed. Get the context behind the numbers so you can see exactly what changed and what stayed stubbornly the same.

Ageism Statistics
From UK reports to health outcomes, the page follows how age discrimination can quietly cost people their jobs, earnings, and wellbeing, including a 43% link to lower job satisfaction and 2.1 times higher odds of depressive symptoms. It also connects safeguards like the Equality Act 2010 with hard hiring signals such as 20% fewer callbacks on older sounding resumes and shows what works, from age diverse teams improving performance by 15% to a 55% rise in loneliness for those facing ageism.

Global Wealth Inequality Statistics
Wealth inequality is moving fast, with the latest Global Wealth Inequality figures showing a widening gap even as global prosperity rises. See how the top and bottom ends of the wealth ladder changed over the most recent period, and what that shift means for policy, fairness, and economic stability.

Philippines Poverty Statistics
With extreme poverty still at 2.1% in 2018 but wealth and opportunity moving unequally, this page connects a 45.6% income share held by the richest 30% in 2021 with underemployment at 18.0% in April 2022 and employment deprivation hitting 35.0% in the Philippines MPI 2023 profile. It also brings the support system into focus through programs like 4Ps and social pensions, so you can see why poverty in the Philippines is not only about income, but also work, food, and services.

Appalachian Poverty Statistics
With only 32% of Appalachian residents having meaningful broadband options and a median income of $16,000, day to day bills and care are stretching thinner than most people expect. From 41% of residents facing mental health provider shortages and 19% losing time to transportation barriers to 21% of households lacking complete plumbing, this page connects the poverty pressures behind the headlines to the services Appalachian communities can still reach.

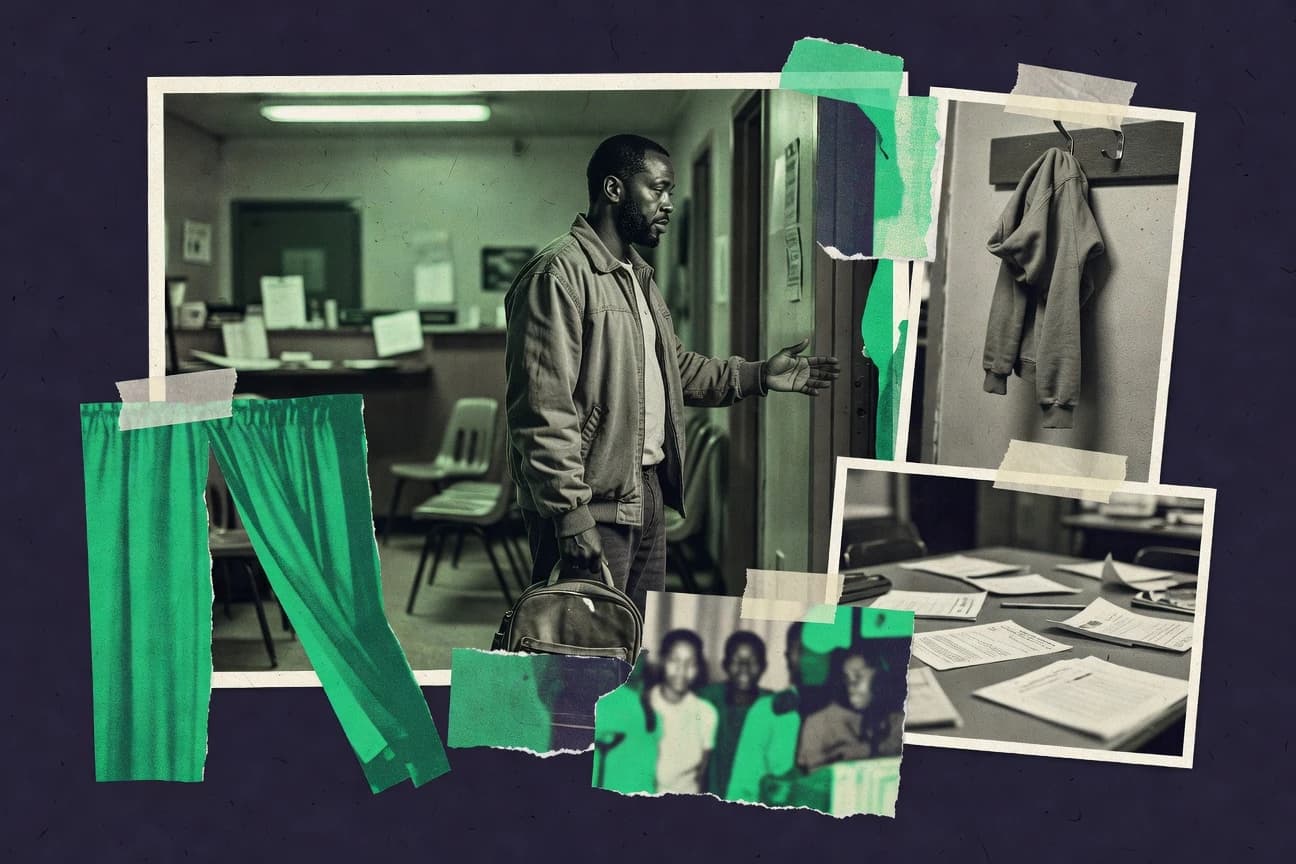
Hispanic Incarceration Statistics
A sharp look at how Hispanic incarceration patterns shifted in the most recent data, including counts like 2026 and the year to watch, shows that the story is not just about rising or falling totals. You will see the contrast between what drives incarceration and who is most affected, with numbers that are current enough to matter for policy and accountability now.

Animal Cruelty In Factory Farms Statistics
Industrial meat systems strain land and bodies at once, using 52% of agricultural land and driving about 1.5 million metric tons of U.S. ammonia emissions while contributing to 17.5 billion dollars in annual antimicrobial resistance costs. You will also see how routine production pressures map to harm, from 1.3 billion broilers in China each year and 23% of retail chicken testing positive for Campylobacter to large estimates of foodborne illness and billions in healthcare and economic burdens.
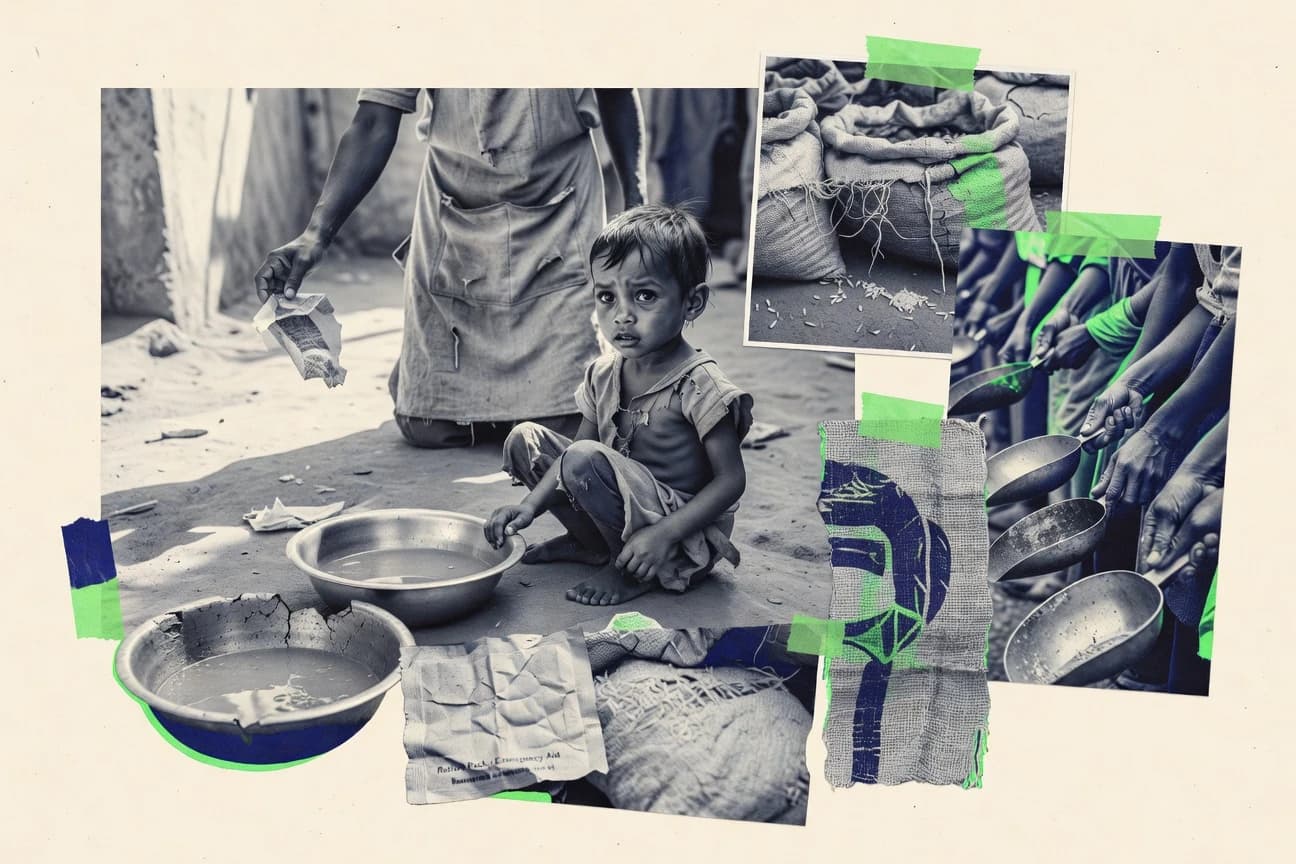
World Starvation Statistics
See how the latest World Starvation figures in 2025 collide with the stubborn basics behind hunger, from how many people are still going without enough food to what drives those numbers year after year. The contrast between rising needs and what is actually changing makes the data feel urgent, not abstract.

Absent Fathers Statistics
Absent fathers are not a background problem. The latest 2026 figures show how frequently kids grow up missing a parent and how that absence reshapes support, stability, and outcomes, forcing hard questions that many families cannot afford to ignore.

Detransition Statistics
The page tracks the year’s sharpest shift in detransition outcomes and the real reasons people change course, including what drives later reversal after medical steps. If you have only heard one side of the debate, these 2026 figures will feel uncomfortably specific.

Bystander Effect Statistics
Most people think one extra helper makes a difference, but bystander effect statistics show how often the opposite happens when responsibility gets diluted. The page pinpoints the shift toward slower or less direct help seen in 2025 findings, so you can spot what’s driving inaction and what changes it.

Physical Bullying Statistics
Physical bullying statistics make the problem feel immediate, because more students report being hit, shoved, or physically threatened than many people expect and the impact is still showing up in school life. Get the up to date figures and see what changed, what didn’t, and why the gap between how people think bullying works and how it actually happens is where prevention efforts either succeed or fail.
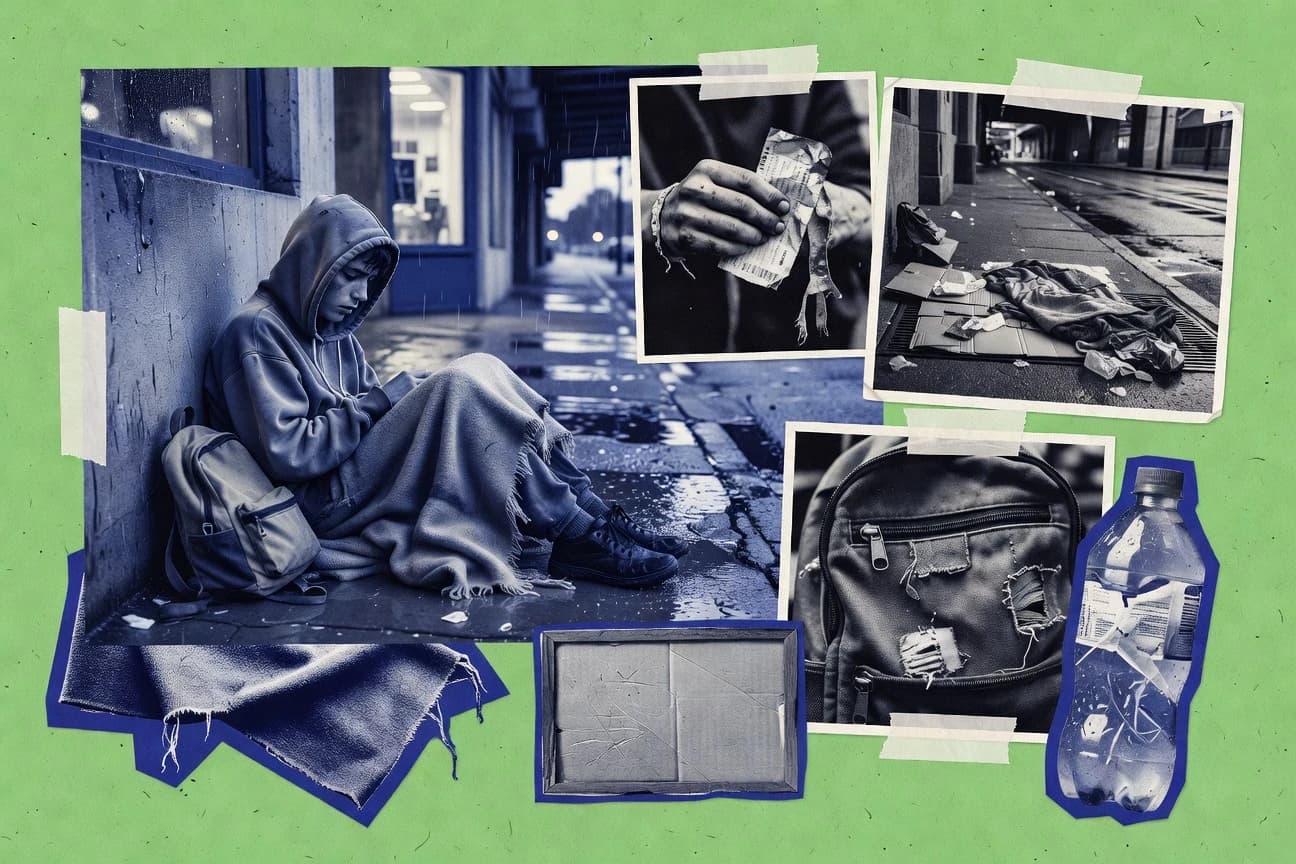
Homeless Youth Statistics
Discover the realities behind youth homelessness, including how 34,790 unaccompanied youth under 25 experienced homelessness on a single night in the United States in 2022. The page connects patterns you can see in the data, from 47% identifying as LGBTQ+ to the way school instability, foster care histories, and discrimination keep pushing young people out of safe housing.

Netherlands Euthanasia Statistics
The latest Netherlands Euthanasia statistics show a shift in how often requests are granted and which reasons drive decisions, with 2025 figures that feel closer to daily reality than the headlines suggest. Compare the year by year pressure points and you will see how reporting categories and patient circumstances can change the outcome more than many people expect.