GITNUX MARKETDATA
Browse Our Category
Social Issues Societal Trends
Latest update:


Trans Discrimination Statistics
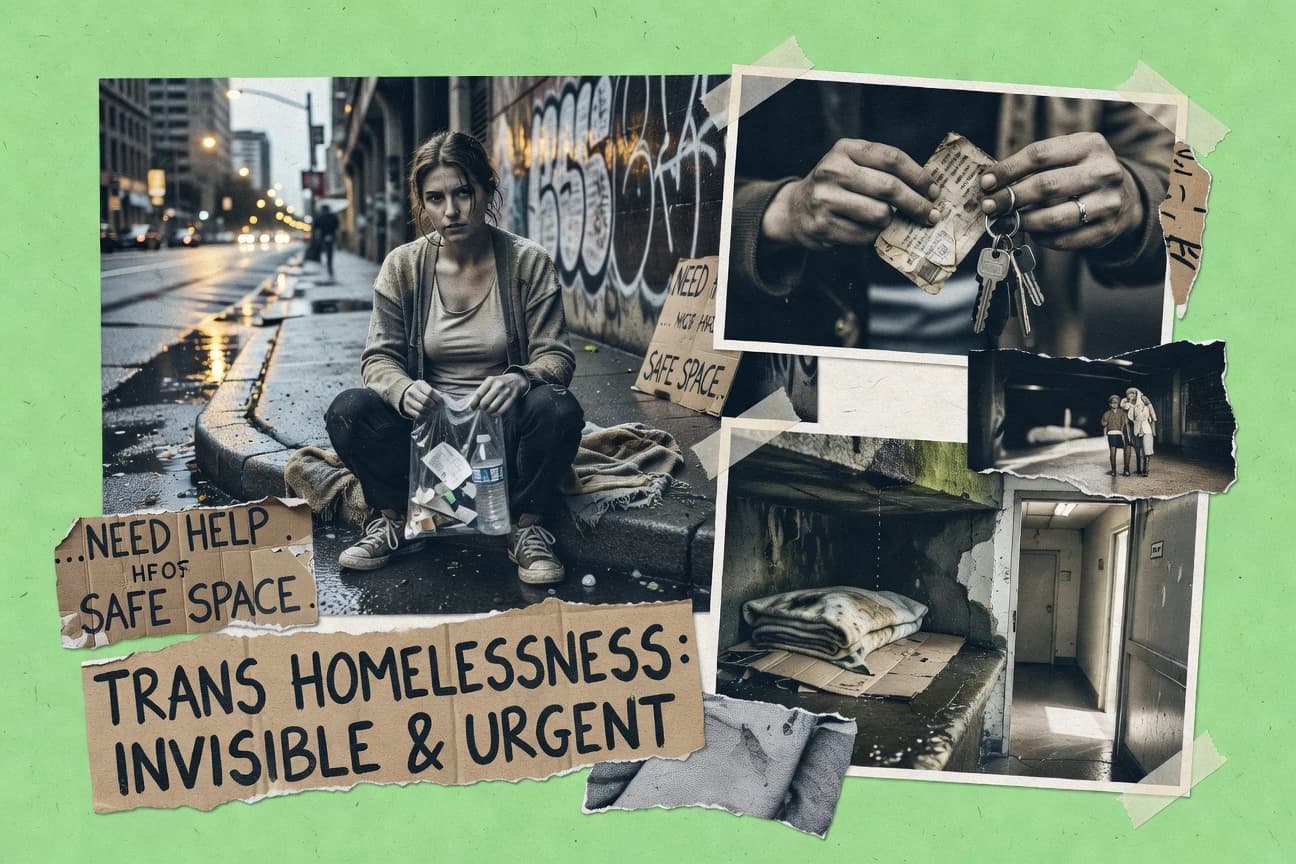
Employment discrimination is not just social bias it shows up as real setbacks, including a 12.4% unemployment rate for transgender people versus 3.1% for cisgender people and a 47% share of trans employees reporting discrimination or harassment at work in the past year. This page puts those contrasts beside the costs of stigma and silence across hiring, pay, healthcare, and safety so you can see exactly what discrimination looks like and how it compounds.

Death With Dignity Statistics
From CO where 83% of aid-in-dying prescriptions ended in ingestion to Washington’s tightly timed two request process and California’s 48 hour pause, this page lays out what access looks like when the safeguards are in motion. It also tracks the evidence and policy backdrop, from JAMA findings that legalization was not linked to higher suicide rates among older adults to the growing count of 12 US jurisdictions with medical aid in dying laws as of 2024, plus how public opinion and clinician comfort vary.

Recent Prostitution Statistics
Recent Prostitution data puts scale and vulnerability in sharp focus, from the $186 billion global sex trade and 2.5 million people entering prostitution each year to 99% of trafficking for sexual exploitation affecting women and girls. It also tracks how prevention and crackdowns collide with fast shifting markets, where app driven encounters hit 80 million globally and new enforcement keeps rising, with about 50,000 US arrests for prostitution related offenses in 2023.

Bully Statistics
Bullying is not just “mean behavior” at 20% of EU children reporting it in the last year, and cyberbullying can raise the odds of depression by 23% and suicidal ideation risk by 2.0x. This page lines up the toughest evidence, including what makes students more likely to report and how effective school programs are in reducing harm.

Censorship Statistics
Government removals requests still climb alongside expanding compliance pressures, with 1,458 government removals requests to Google Search worldwide in 2023 and 1,017 to YouTube. Pair that with the scale of the response economy, as cybersecurity spending is projected to hit $248 billion by 2026 and trust and safety solutions are forecast to rise to $11.9 billion by 2028, and you get a sharp picture of how censorship demands are turning into measurable systems.

Selfie Statistics
From 58% of US adults ages 18 to 29 sharing selfies to over 93 million selfies taken daily worldwide, this page maps who posts, where, and why with fresh, sometimes unsettling detail. You will see the surge of vanity and validation alongside real risks, including selfie-related deaths, injuries, and the jump in selfie editing and tech that reshapes how people see themselves.

Gay Hate Crimes Statistics
Even with 2023 bringing Russia’s documented anti gay attacks to 1,236 and India’s reports rising to 373 anti gay crimes, the pattern of targeting is uneven by city and type, like New York City’s 622 anti LGBTQ plus incidents with 54 percent anti gay. Read the page to see how sexual orientation bias spreads across places, from 14,414 UK charges to 3,465 London incidents, and where arrests, charges, and violence risk diverge most.

Teen Pregnancy Statistics
A sharp snapshot of teen pregnancy in 2021 reveals why disparities are so hard to ignore, from US rates ranging from 10.1 per 1,000 for non Hispanic White teens to 25.4 per 1,000 for American Indian and Alaska Native teens, plus the staggering fact that 75% of US teen births occur outside marriage. You will also see how geography, education, and policy collide globally and in the US, including rural areas with 23% higher teen birth rates and evidence that proven supports like contraception access can cut teen pregnancy dramatically.

Ukraine Refugee Statistics
By 2024, 1.3 million Ukrainians were recorded as beneficiaries under temporary protection in the Czech Republic, while in 2022 UNHCR and partners found 58% of displaced Ukrainians struggled with accommodation serious enough to need support. The page connects who arrived and where they settled with the quieter pressures behind the stats, from children making up 34% of the displaced to households in Poland reporting kids at home for 47% of survey respondents.

Jail Race Statistics
See how jail decisions and budgets ripple through outcomes, from 2.3 million people incarcerated in the U.S. in 2022 to medical care and reentry spending that can quietly decide how many people return within three years. Then compare the fastest growing technology and staffing pressures, including electronic monitoring market momentum and rising ransomware risk, to understand what is driving change behind the bars.

Protest Statistics
From George Floyd protests that made up 93% of US demonstrations in summer 2020 and echoed across 10,000+ global events to Occupy, climate strikes, and antiwar mobilizations, this page maps how protest waves spread and how much they cost. It also weighs impact against momentum, including global police force in 20% of events, to show why 2010 to 2020 protest activity rose 30% and what that means for rights, risk, and outcomes.

Refugee Statistics
With 43.3 million people forcibly displaced worldwide by the end of 2023, the page connects how policy, jobs, and services shape everyday outcomes for refugees, from mental health strain to barriers to healthcare and education. It also spotlights recent coverage levels and access gaps, including 66 countries granting protection status and 24% of refugees in some host countries holding work authorization permits, alongside ongoing shortfalls in nutrition, WASH, and legal identity.

Transgender Discrimination Statistics
Across 2022, trans workers are far more likely to be without work, with unemployment at 15% compared with 4% for cisgender people, and one UK survey finds 51% reporting negative treatment at work. The page connects these outcomes to day to day harms like being fired, misgendered, and denied advancement, plus how fear of discrimination drives people to hide at work, avoid care, and accept worse income and housing.

Gender Inequality In The United States Statistics
Women still earn less and carry more unpaid work, from a 64 cents per dollar pay gap for Black women to unpaid caregiving that costs an estimated $1.5 trillion a year if paid. The page tracks where that gap turns into real outcomes, from women receiving just 2% of US venture capital in 2022 to women holding 10.4% of Fortune 500 CEO roles in 2023 and far higher poverty rates for groups like single mothers.

Diet Culture Statistics
From social media comparisons that leave many people feeling guilty about eating to treatment and product markets that keep surging, the page puts dieting pressure into hard, up-to-date context, including $231.6 billion in global diet product spending forecast for 2028. It also maps how that pressure turns into real behaviors and symptoms, from meal skipping and purging to binge eating and bulimia risk.

Homeless Veterans Statistics
About 8.7% of people experiencing homelessness were veterans in the 2023 PIT estimate, and VA supports them with $1.2 billion in FY2023 grants and contracts plus 135 VA funded programs and partners nationwide for housing navigation and clinical outreach. This page connects the practical stay and retention evidence, including Housing First and supportive housing gains, with what appears in VA reporting on PTSD, chronic homelessness, and co occurring conditions, showing exactly what helps veterans exit homelessness and what still blocks progress.

Rural Health Disparities Statistics
Rural communities face a care crunch that shows up fast and in everyday outcomes, from 2.5 times fewer primary care clinicians per 100,000 residents than in urban counties to 2.0 times higher age-adjusted drug overdose death rates in rural areas in 2021. You will also see how hospital strain and access gaps compound, including rural hospitals serving 54 percent of US hospitals while providing only 18 percent of inpatient days in 2019, and how longer specialty travel and delayed cancer diagnosis raise the stakes.

Veteran Homeless Statistics
With 55% of homeless veterans aged 50 or older and chronic homelessness affecting 42%, the stakes are clear and urgent. Yet the leading triggers are not just housing, from PTSD and substance use to social isolation and discharge complications, and these patterns also explain why programs like VA outreach and rapid re housing can move outcomes fast.

Opioid Epidemic Statistics
Opioid overdoses still cut across age, race, sex, and geography, with 80,411 opioid-involved overdose deaths recorded in 2022 and opioids tied to 49% of ED visits for misuse in 2019. This page connects the sharp disparities like rural residents being 25% more likely to overdose, ages 25 to 44 driving the highest overdose ED visit rate at 40.2 per 100,000 in 2021, and Medicaid enrollees accounting for 25% of opioid deaths despite 15% of the population.

Binge Drinking Statistics
Binge drinking is already tied to immediate harms and long term disease risk, yet nearly 1 in 10 U.S. people aged 12 and up reported it in 2021 to 2022, and policy choices like higher prices and tighter alcohol availability can cut consumption. See how binge drinking links to everything from alcohol poisoning and traffic fatalities to depression, injuries, and even billions in economic costs, plus which interventions have actually reduced episodes and when.