Market data
Arts Creative Expression
Explore verified arts creative expression statistics and market research reports with sourced data and trend analysis.
Latest update:
 Yumi Nakamura

Gcc Creative Industry Statistics
GCC creative industries reached $2.3B in Europe-bound exports in 2023—up 18%—showing cross-border demand for media, design, and events.
Korean Creative Industry Statistics
Webtoon global users topped 100 million in 2022, as the market reached KRW 1.69 trillion—see the figures driving Korea’s creative wave.
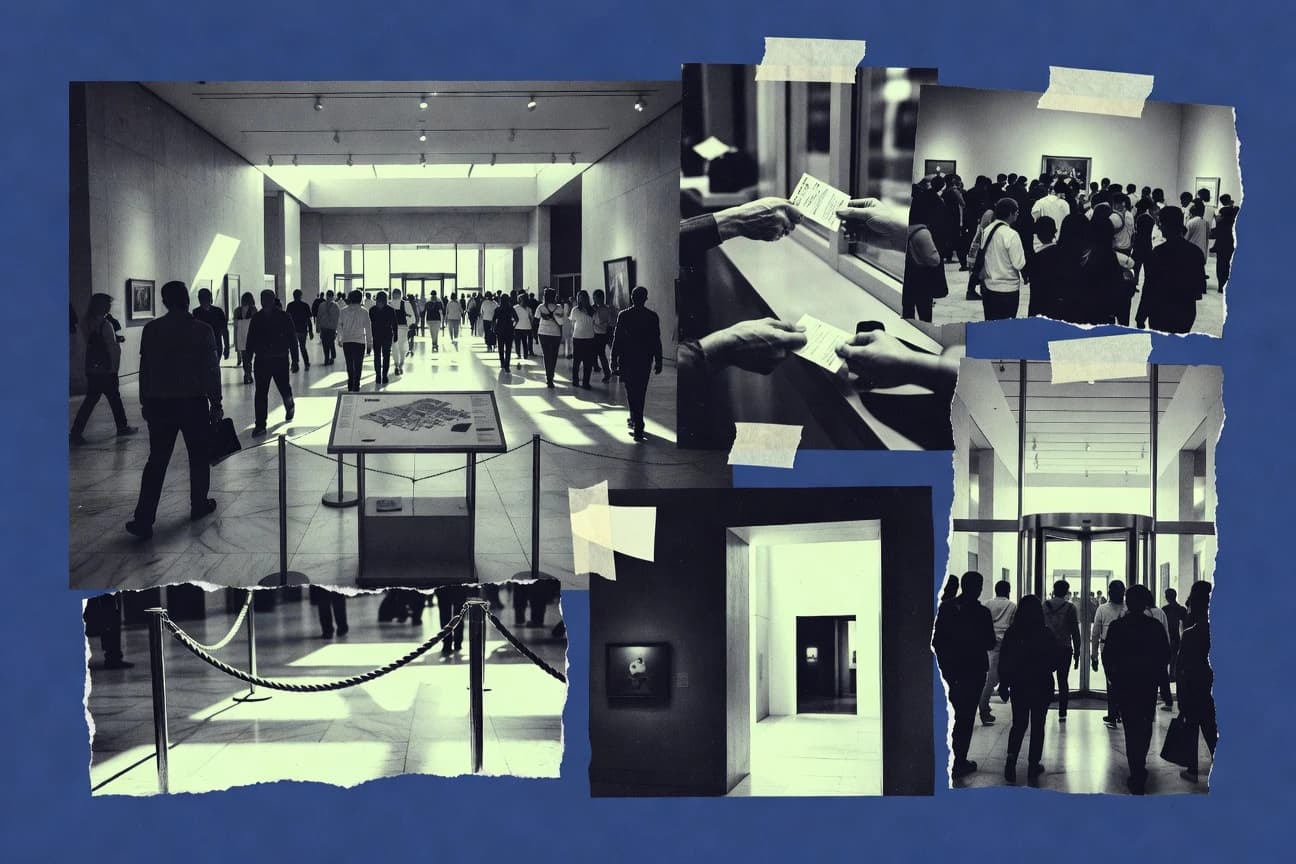
Museum Attendance Statistics
Louvre Paris logged 8,971,828 visits in 2023—10.2% up from 2022—compare how attendance shifted across global museums.
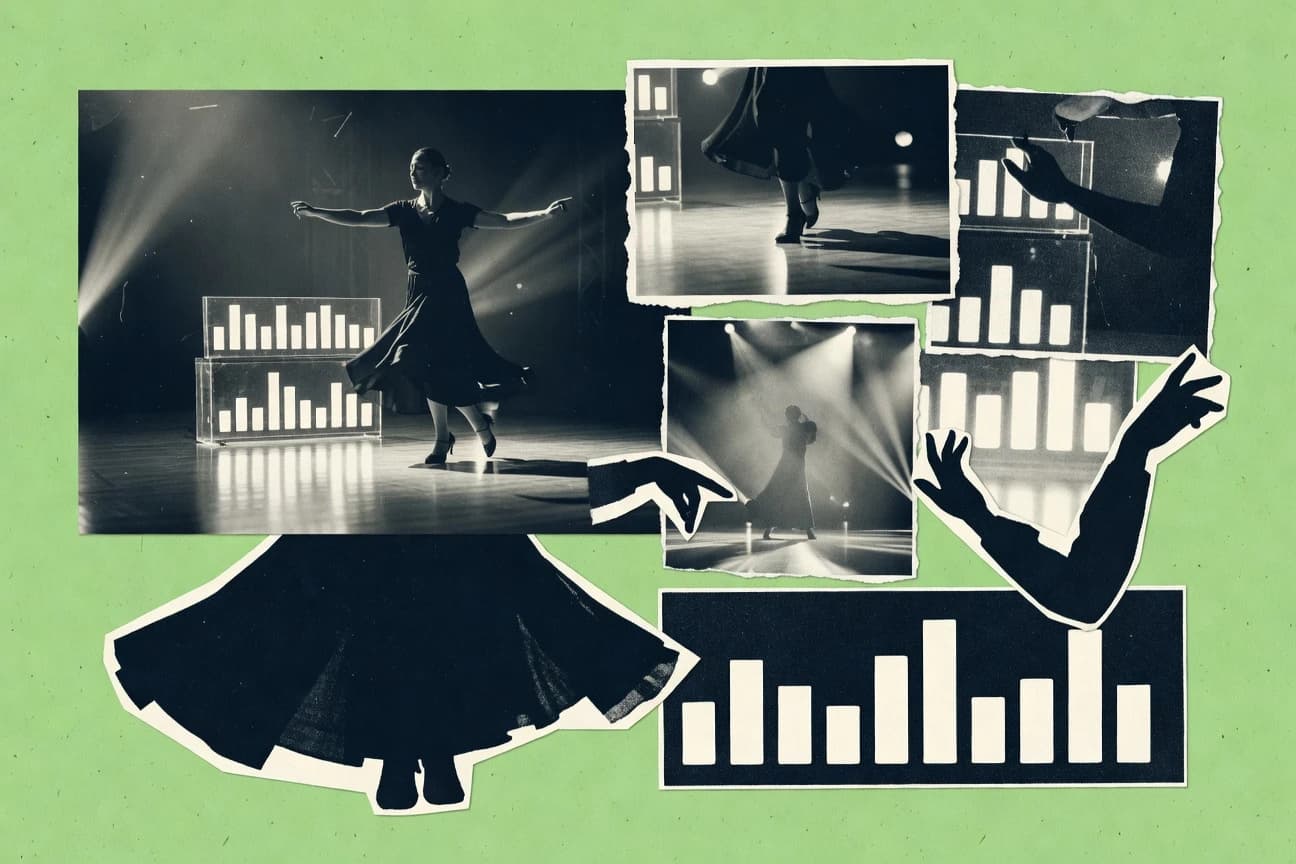
Dance Statistics
TikTok dance challenges have earned 2 trillion views since 2018—see how that momentum mirrors dance’s impact on health and culture.
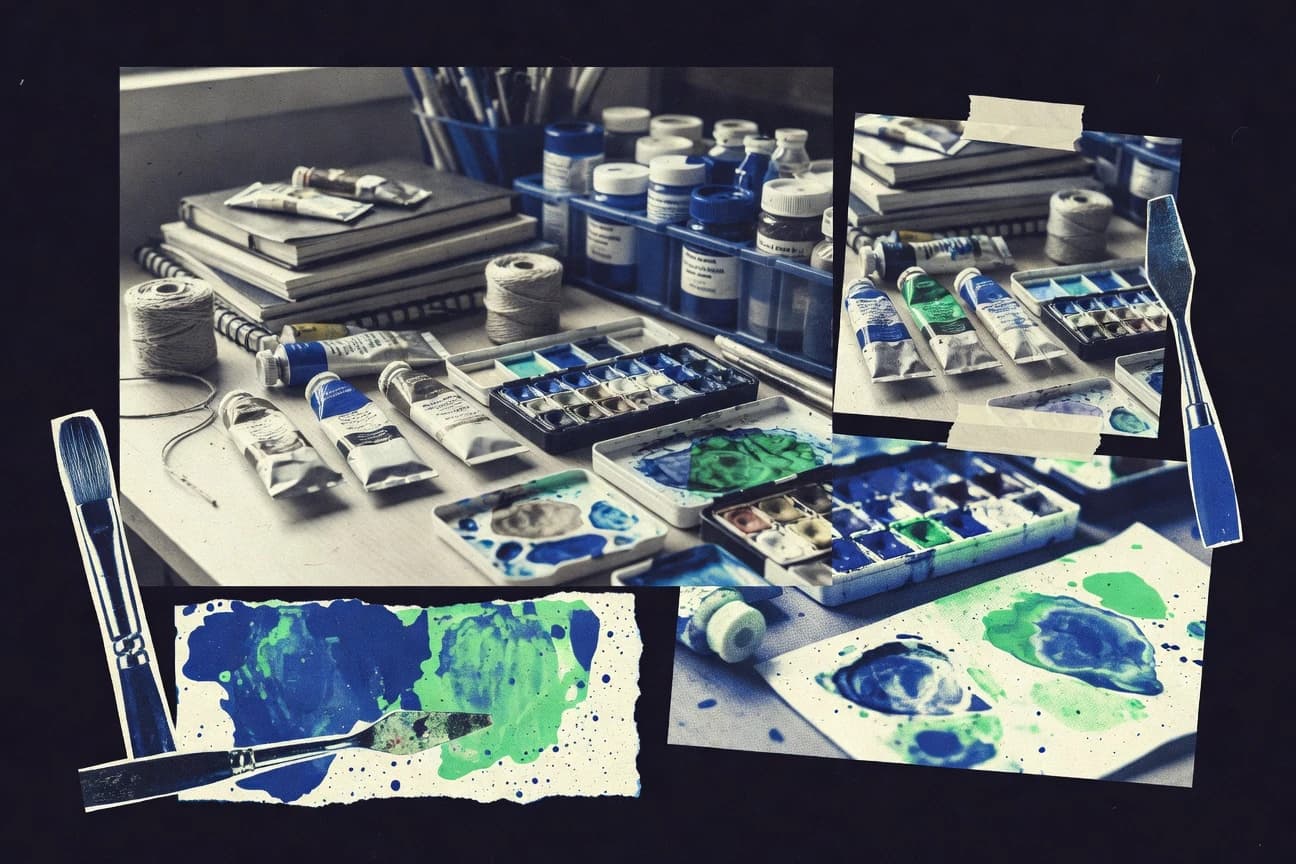
Art Supplies Industry Statistics
Online art supplies sales jumped 12.3% globally in 2023 and now make up 28% of revenue—see what’s driving the shift and where it’s growing.

Screenwriting Industry Statistics

Indonesia Creative Industry Statistics
In 2022, Indonesia’s creative economy reached IDR 1,225 trillion and contributed 7.35% to GDP—see how design, crafts, and digital drive it.

Netherlands Creative Industry Statistics

Shakespeare Statistics

Anime Japan Industry Statistics
68% of Japanese high school students watch anime weekly—see how that demand connects to studios, streaming, exports, and revenue.

Nyc Creative Industry Statistics
Creative industries generated $116.6B in NYC output in 2022—find how advertising, film/TV, and fashion translate creativity into local economic impact.
South Africa Creative Industry Statistics
In 2022, TV ad revenue fell to R12.5B—down 5% from its peak. See how shifting screens reshape creative opportunities in SA.

Riyadh Creative Industry Statistics
Riyadh’s creative industries contributed SAR 127 billion in 2023—making up 4.2% of Saudi Arabia’s non-oil GDP. Explore the indicators behind the impact.
Detroit Creative Industry Statistics
Detroit’s creative industries produced $4.2B in economic output in 2022—plus $250M in 2023 business growth. Explore what’s fueling the boom.
Hong Kong Creative Industry Statistics
Hong Kong’s creative industries grew 5.2% in value-added in 2022—outpacing overall GDP at 3.5%; explore the key sectors and numbers.
Nigeria Creative Industry Statistics
Nigeria’s creative economy is accelerating fast, from social media ad spend hitting NGN 300 billion and programmatic buying jumping 50% to NGN 150 billion, to ad fraud dropping to 10% or NGN 80 billion thanks to AI verification. If you want the most practical signal of where Nigerian money and talent are heading, this page connects the whole chain from advertising and fashion to Nollywood, music, and publishing, so you can spot demand where it is monetizing.

Japan Creative Industry Statistics
Japan’s creative economy keeps scaling while platform and compliance pressures tighten, with animation at 1,590 firms and 30,119 workers in 2020 and digitization lifting digital production value by 12% from 2020 to 2022. Gaming is projected to climb toward $184.4 billion globally in 2024 and Japan still captures 18.5% of global anime consumption revenue in 2022, even as 68% of creators in a 2023 survey said they are unsure how AI affects their rights and APPI penalties can reach ¥100 million.

Online Art Market Statistics
With online checkout friction driving major drop offs, and marketers already at 65% AI adoption in 2024, this page connects conversion killers like 47% abandoning slow 2 second loads with the growth signals behind an 8.1% CAGR forecast for 2024 to 2033, plus the costs of shipping, taxes, and payments that shape every shipped artwork bid. You will get a tight, art-market focused snapshot of what is accelerating digital trading and what is quietly preventing buyers from completing purchases.

Uae Creative Industry Statistics
AI is now embedded in 40% of UAE media productions and creative exports reached AED 45 billion in 2023, while firms also accelerated into cloud work at 65% and digital watermark compliance hit 90% for IP protection. It also tracks the sharp contrast behind the growth, from AED 12M in Dubai gallery AI art sales and AED 127 billion creative GDP impact in 2022 to how AR VR, metaverse events, and cyber security spending are reshaping creative production across the Emirates.

Art Statistics
Art is no longer a niche pastime, with 78% of US adults having visited a museum at least once and community art programs reaching 150 million participants worldwide in 2023. From school arts linked to 17% higher graduation rates to online classes that grew 40% to 12 million students, this page puts the surprising benefits side by side with a market that hit $65 billion in 2023.