Market data
Beverages Alcohol
Explore verified beverages alcohol statistics and market research reports with sourced data and trend analysis.
Latest update:
 Katherine Brennan
Mead Industry Statistics
Global mead sales volume reached 18 million liters in 2023, up 7.2%—see what’s driving demand and market growth.
Whisky Industry Statistics
Scotch whisky exports grew 28% to £5.9 billion in 2022—discover where the demand is coming from and what it means for the industry.
Beverage Consumption Statistics
In the U.S., bottled water averaged about $0.67 per gallon in 2023—yet demand persists. Explore price, policy, and daily habits.
Japanese Alcohol Industry Statistics
Shochu surpassed sake for the first time in decades in 2023—600,000 kl. See how each category is performing across Japan’s alcohol market.

Mezcal Industry Statistics
US on-premise mezcal sales rose 32% to 1.8M liters in 2023—see which demand signals are fueling the boom.

Wine Statistics
Portugal topped per-capita wine drinking at 51.9 liters per adult in 2022—discover the culture behind why that glass matters.
Global Beer Industry Statistics
Beer volume fell 27.7% in 2020—what this COVID shock means for the market’s partial 2021 rebound and outlook.
Cocktail Industry Statistics
In 2023, US adults who drink cocktails at home at least monthly hit 24%—see what this means for home-mixing growth.
Vodka Industry Statistics
WHO estimates 3 million deaths a year are linked to harmful alcohol use—see how vodka fits global consumption and health impacts.
Germany Beer Industry Statistics
In 2023, Germany produced 85.1 million hectolitres of beer—plus what it means for breweries, taxes, and export reach.
Beer And Wine Industry Statistics
Wine’s 2029 market forecast is $2,107.1B—see why global demand, tariffs, and supply-chain traceability are reshaping pricing and access.
Cider Industry Statistics
77% of US cider brands use fruit ingredients or fruit flavoring; see how this lineup strategy connects to consumer taste and industry demand.
Bottled Water Industry Statistics
Only 9% of water bottles get recycled globally—yet Americans buy bottled water weekly; discover what drives demand and the environmental cost.
Us Alcohol Industry Statistics
The U.S. beverage alcohol market hit about $283.8B in 2023—while 38 states now allow permanent cocktails-to-go. Explore what’s reshaping the industry.
Most Popular Alcoholic Drinks Statistics
Smirnoff is the world’s top vodka by volume. Discover the most popular alcoholic drinks and the key numbers behind demand.
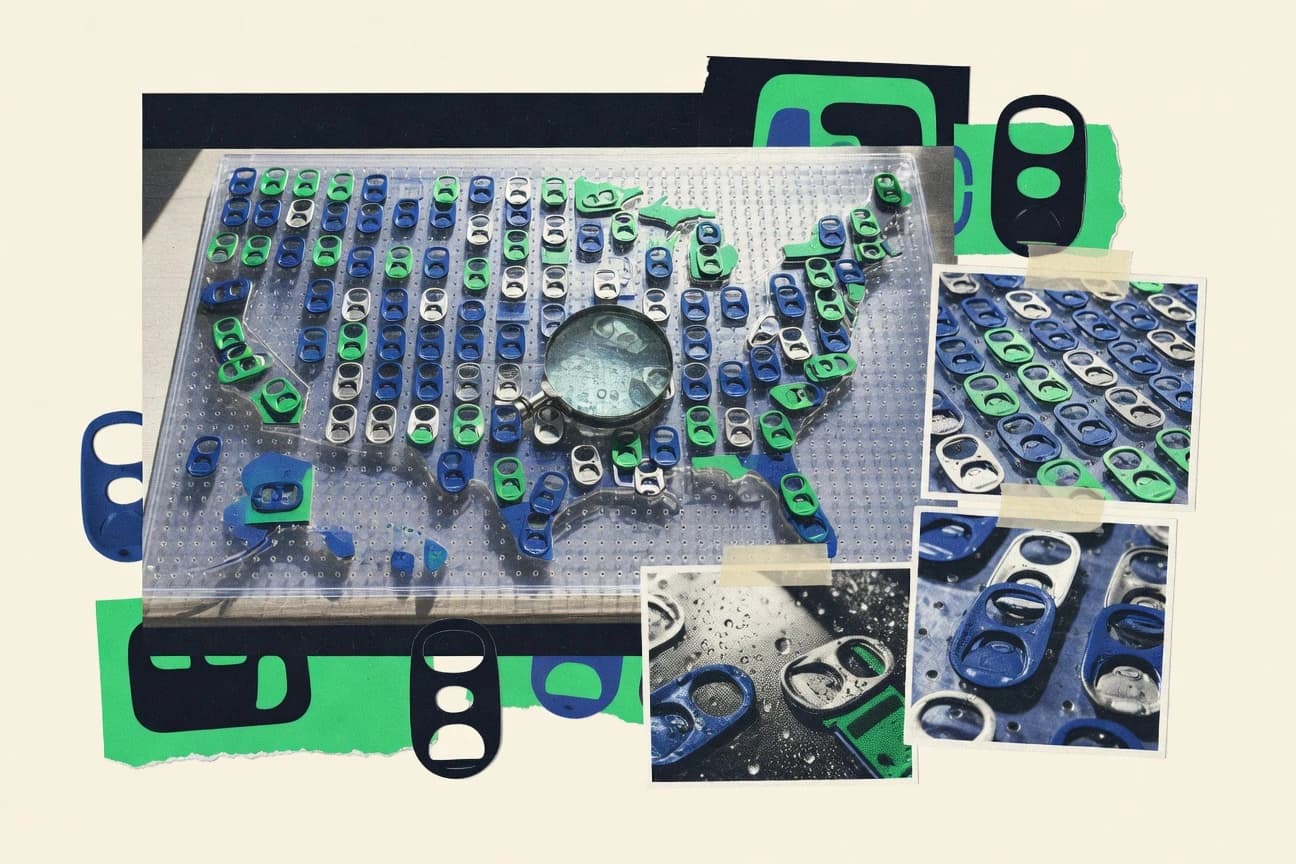
Most Popular Soda By State Chart Statistics
Mississippi picks Dr Pepper as top soda (45% vote share)—while Alaska’s soda searches peak for Coca-Cola (35% above average).
Coke Vs Pepsi Statistics
Coca-Cola is Interbrand’s #7 most valuable brand in 2023—estimated at $58B—while Pepsi ranks #35 at about $19B. Compare the numbers and what they mean.
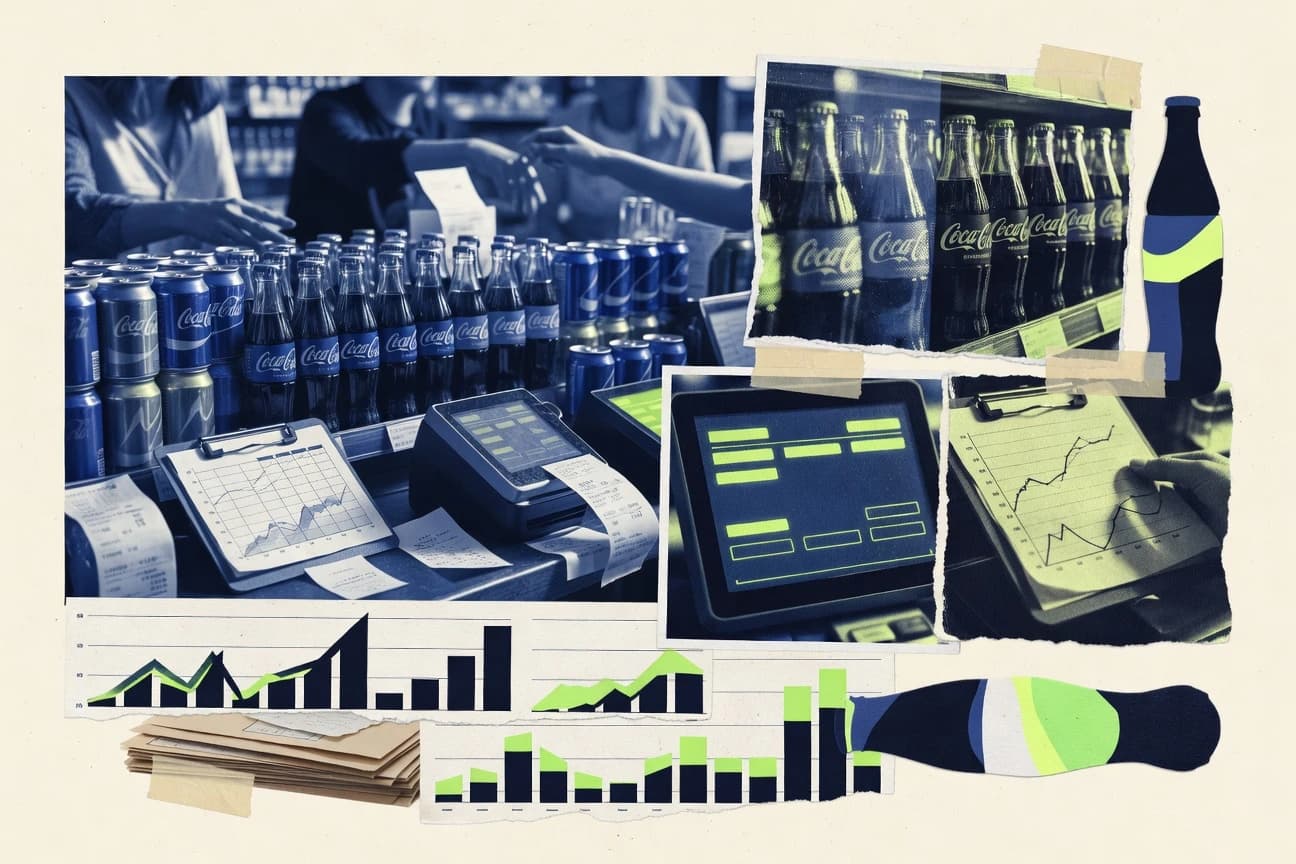
Coca Cola Sales Statistics
In 2023, Coca-Cola generated 48% of the global cola market—see how its revenue and unit-case growth translate into sales momentum.
Soft Drinks Industry Statistics
Mexico leads with 163 liters of soft drinks per capita in 2023—plus the causes behind regional consumption shifts. Explore the data.
Alcohol Spirits Industry Statistics
35% of U.S. legal-age adults consumed spirits in 2022—explore the bottles, trade, and market forces shaping the Alcohol Spirits Industry in 2023 and beyond.