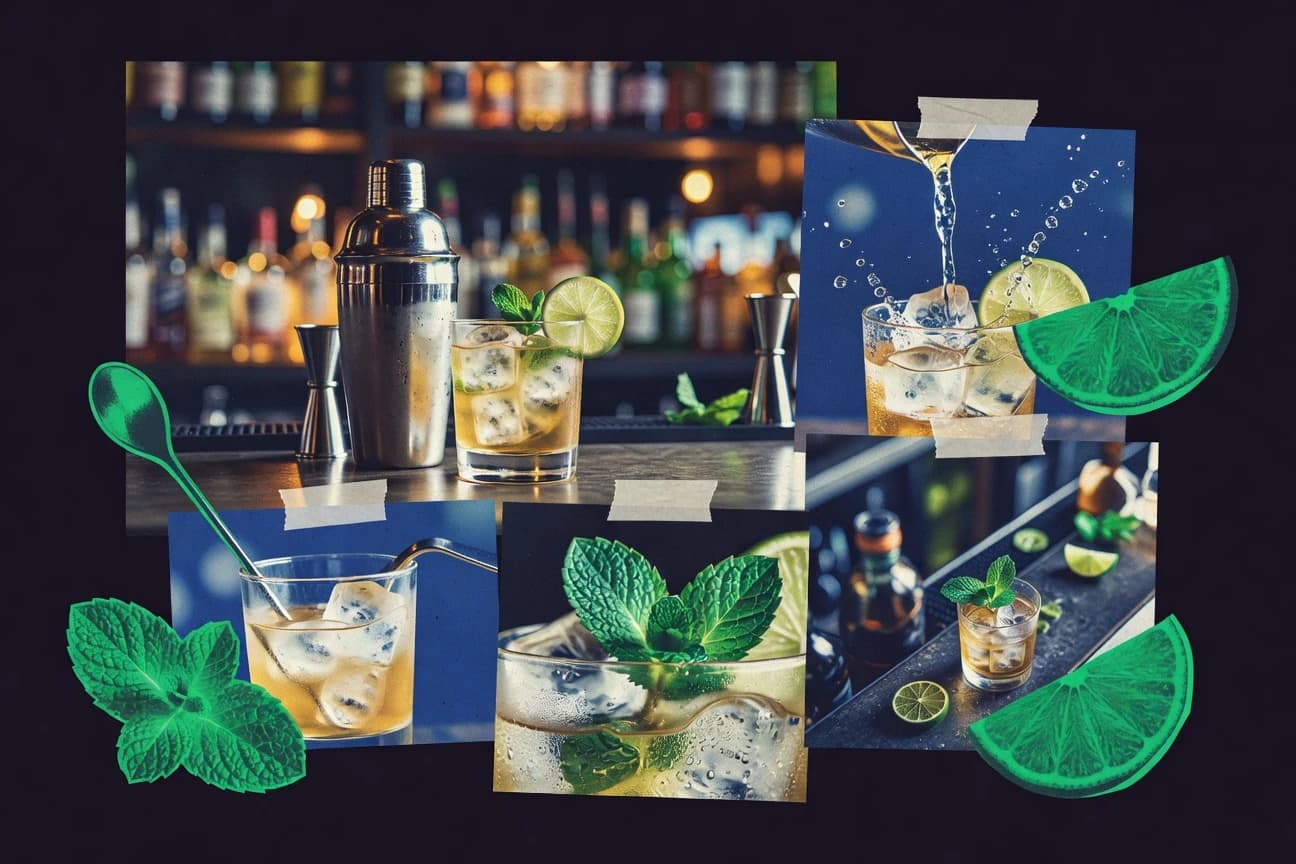

The cocktail industry is driven by both at-home mixing and on-premise service, supported by fast-growing ingredients and resilient spirits demand. Global cocktail mixer and syrup markets are expanding, while consumer behavior shows strong online and mobile-driven interest in alcoholic beverages. On the cost side, cocktail pricing depends on labor conditions for bartenders and overhead pressures such as rising beverage and bar-supply prices, plus venue rent.
Key Takeaways
- 8.7% CAGR of the global cocktail mixer market from 2023 to 2030, reflecting growth driven by demand for at-home and bar-quality mixes
- 4.5% CAGR of the global cocktail syrups market projected for 2024–2032, indicating steady expansion in flavor and premium syrup demand
- US$25.2 billion estimated global alcoholic beverages e-commerce sales in 2023, indicating sizable digital channel penetration for spirits and drink categories
- 53% of US consumers reported purchasing alcohol online at least once in 2023, indicating demand that supports at-home cocktail preparation
- 24% of US adults reported drinking cocktails at home at least monthly in 2023, reflecting a recurring home-mixing behavior
- Spain’s hospitality sector (restaurants and bars) revenue grew 4.2% in 2023 (INE), supporting cocktail consumption in bars
- 2.1 million people employed in food services and drinking places in the US (2023 average), reflecting the labor base that produces cocktails
- US Bureau of Labor Statistics shows bartenders had a 2023 annual median wage of $15.60 per hour, which affects labor costs for cocktail bars
- US BLS reports 2023 bartenders work typically 30.7 hours per week (annual average hours), impacting scheduling for cocktail-heavy peak periods
- Average US restaurant beverage cost of sales averaged 26% in 2022–2023, a key input for cocktail gross margins
- US consumer prices for bar supplies (including certain glassware categories) rose 4.6% in 2023, raising operating costs for bars
- US minimum wage in 2024 ranges from $7.25 (federal floor) to over $16 in many states, affecting labor costs for cocktail venue staffing
- Global glass bottle manufacturing energy intensity declined 3% in 2023 due to efficiency improvements, reducing (marginally) packaging cost pressure for bottled mixers and spirits
- In the US, 72% of consumers say they use a mobile device to decide what to eat or drink when dining out (2023 survey), supporting discoverability of cocktails and menus
- 62% of US consumers say they drink cocktails at home at least monthly (2023), a measure of recurring home-cocktail demand.
Cocktail mix demand is rising fast as home mixing, online alcohol sales, and premium syrups fuel market growth.
Related reading
01 · Category
Market Size7 stats
01
8.7% CAGR of the global cocktail mixer market from 2023 to 2030, reflecting growth driven by demand for at-home and bar-quality mixes
02
4.5% CAGR of the global cocktail syrups market projected for 2024–2032, indicating steady expansion in flavor and premium syrup demand
03
US$25.2 billion estimated global alcoholic beverages e-commerce sales in 2023, indicating sizable digital channel penetration for spirits and drink categories
04
US$23.6 billion global spirits market size in 2023, representing the core category that supplies cocktail bars and at-home mixing
05
US$12.3 billion global bar and pub industry market size in 2023, reflecting spending at venues that primarily generate cocktail revenue
06
US$1.9 billion estimated US cocktail bar market size (2023), indicating a measurable revenue pool for cocktail-focused venues
07
France recorded €3.5 billion sales for spirits in 2022 (INSEE/industry data compilation), relevant for cocktail-focused segments
Interpretation
Market Size Interpretation
The market size picture for cocktails is expanding across both at-home and out-of-home channels, with the global cocktail mixer market growing at an 8.7% CAGR from 2023 to 2030 and the global alcoholic beverages e-commerce market reaching US$25.2 billion in 2023.
02 · Category
Employment & Labor5 stats
01
2.1 million people employed in food services and drinking places in the US (2023 average), reflecting the labor base that produces cocktails
02
US Bureau of Labor Statistics shows bartenders had a 2023 annual median wage of $15.60per hour, which affects labor costs for cocktail bars
03
US BLS reports 2023 bartenders work typically 30.7 hours per week (annual average hours), impacting scheduling for cocktail-heavy peak periods
04
In the UK, ONS estimates there were 2.3% fewer people employed in bars and restaurants in 2023 than 2022, reflecting employment pressure in on-premise service
05
In the US, food service sales volume index increased 3.1% in 2023 vs 2022 (Census/BLS series), supporting venue demand where cocktails are sold
Interpretation
Employment & Labor Interpretation
In 2023, cocktail labor demand is reflected by the US employing 2.1 million people in food services and drinking places while bartenders earned a $15.60 median hourly wage and worked 30.7 hours per week, and this is complemented by UK pressure where employment in bars and restaurants fell 2.3% year over year.
03 · Category
Industry Trends4 stats
01
53% of US consumers reported purchasing alcohol online at least once in 2023, indicating demand that supports at-home cocktail preparation
02
24% of US adults reported drinking cocktails at home at least monthly in 2023, reflecting a recurring home-mixing behavior
03
Spain’s hospitality sector (restaurants and bars) revenue grew 4.2% in 2023 (INE), supporting cocktail consumption in bars
04
Global alcoholic beverages value grew from about US$1.8 trillion in 2022 to about US$1.9 trillion in 2023, reflecting a larger spend base that includes cocktails.
Interpretation
Industry Trends Interpretation
With 53% of US consumers buying alcohol online in 2023 and 24% of US adults having cocktails at home at least monthly, home preparation and at-home cocktail demand are clearly strengthening within the Industry Trends picture.
More related reading
04 · Category
Pricing & Costs4 stats
01
US consumer prices for bar supplies (including certain glassware categories) rose 4.6% in 2023, raising operating costs for bars
02
US minimum wage in 2024 ranges from $7.25(federal floor) to over $16 in many states, affecting labor costs for cocktail venue staffing
03
Global glass bottle manufacturing energy intensity declined 3% in 2023 due to efficiency improvements, reducing (marginally) packaging cost pressure for bottled mixers and spirits
04
US rent for retail/restaurant spaces increased 5.1% year-over-year in Q4 2023 (index measurement), impacting venue overheads for cocktail bars
Interpretation
Pricing & Costs Interpretation
Pricing pressure for cocktail venues is rising overall as US bar supply prices increased 4.6% in 2023 and retail and restaurant rents climbed 5.1% year over year in Q4 2023, even as a 3% drop in global glass bottle manufacturing energy intensity in 2023 offers only limited cost relief on packaging.
05 · Category
Cost Analysis4 stats
01
US bartenders had a 2023 annual median wage of $15.60per hour, impacting labor costs for cocktail bars.
02
US restaurant beverage cost of sales averaged 26% in 2022–2023, affecting cocktail gross margins through input and pour-cost controls.
03
US consumer prices for alcoholic beverages (CPI-U) increased by 6.3% in 2023 versus 2022, indicating rising customer-facing beverage prices that influence cocktail demand.
04
Energy used per tonne in US beverage manufacturing decreased by 1.8% in 2023, a measurable efficiency improvement that can reduce packaging and production cost pressure for bottled ingredients.
Interpretation
Cost Analysis Interpretation
In the cost analysis of the cocktail industry, labor and beverage economics are tightening as US bartenders earn a $15.60 median hourly wage and restaurant beverage cost of sales averages 26%, while alcoholic beverage CPI-U rose 6.3% in 2023 but energy use per tonne in beverage manufacturing still improved by 1.8%.
06 · Category
Industry Overview4 stats
01
In the US, 72% of consumers say they use a mobile device to decide what to eat or drink when dining out (2023 survey), supporting discoverability of cocktails and menus
02
62% of US consumers say they drink cocktails at home at least monthly (2023), a measure of recurring home-cocktail demand.
03
72% of US consumers say they use a mobile device to decide what to eat or drink when dining out (2023), supporting cocktail menu discovery.
04
Average US restaurant beverage cost of sales averaged 26% in 2022–2023, a key input for cocktail gross margins
Interpretation
Industry Overview Interpretation
With 72% of US consumers using mobile devices to decide what to eat or drink when dining out and 62% drinking cocktails at home at least monthly, the industry’s outlook is that cocktails are being driven by consistently recurring demand across both in-venue discovery and at-home habits.
Reference
Cite This Report
This report is designed to be cited. We maintain stable URLs and versioned verification dates. Copy the format appropriate for your publication below.
APA
Marie Larsen. (2026, February 13). Cocktail Industry Statistics. Gitnux. https://gitnux.org/cocktail-industry-statistics
MLA
Marie Larsen. "Cocktail Industry Statistics." Gitnux, 13 Feb 2026, https://gitnux.org/cocktail-industry-statistics.
Chicago
Marie Larsen. 2026. "Cocktail Industry Statistics." Gitnux. https://gitnux.org/cocktail-industry-statistics.
Sources & references
28 datasets cited across this report · attribution is report-level
+7 additional datasets cited (not shown individually)