GITNUX MARKETDATA
Browse Our Category
Beverages Alcohol
Latest update:


Bc Wine Industry Statistics
The latest Bc Wine Industry statistics point to a striking shift in how British Columbia’s wineries are performing, with 2026 data setting a sharper bar for what growth, production, and market momentum look like now. If you think the story is just about volume, these numbers add the real tension behind sales, output, and sustainability pressures in a single snapshot.
Vietnam Beer Industry Statistics
See how Vietnam’s beer industry is performing right now, from the latest production and consumption figures to what they reveal about market demand. The page highlights the sharp shifts in brewing output and per capita intake, so you can understand not just where growth is coming from, but what’s changing in 2025 and beyond.
China Beer Industry Statistics
See how China Beer Industry is reshaping demand and pricing, from the latest 2025 sales and revenue figures to shifting production capacity and export momentum. The contrast between what consumers buy and what breweries can efficiently make makes the 2025 outlook feel less certain than it looks on paper.
China Baijiu Industry Statistics
See how baijiu’s industrial scale and value are reshaping in 2025, with production and market momentum measured against the costs and consumption realities manufacturers can’t ignore. The page ties year to year shifts to the bottlenecks and opportunities driving China’s baijiu industry right now, so you get the contrast between growth figures and what they actually mean on the ground.

Alcohol Drinking Statistics
Alcohol Drinking statistics in 2026 reveal how quickly habits and consumption patterns are shifting, and why the latest figures look nothing like what people assume. If you want to understand what is actually changing right now, these numbers connect trends to the real behaviors behind drinking.
Mexico Wine Industry Statistics
Mexico’s wine industry is showing a striking shift in 2025, with export gains and growing production activity that challenge the old assumption that the market is mostly domestic. See which figures are moving fastest and what they imply for Mexico’s competitiveness on the global label.
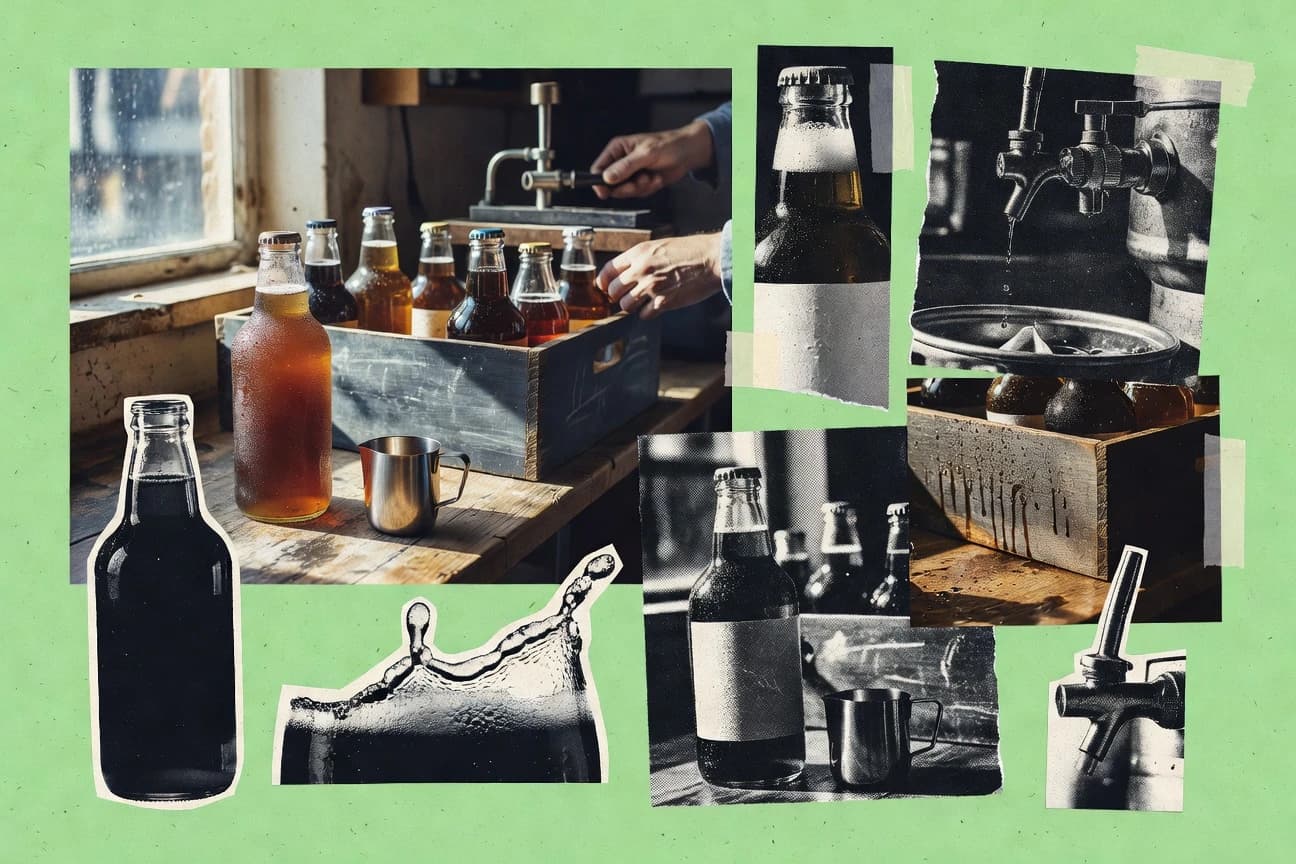
Craft Beer Industry Statistics
Craft Beer Industry tracking shows how quickly things are changing, with craft brewer counts rising to 9,118 and brewery employment at 600,000 in 2025, even as average annual craft beer sales settle at about 7.4 million barrels. These numbers set up a real tension between workforce growth and market volume, making it worth checking what is driving the shift.
Brazil Wine Industry Statistics
Brazil’s wine industry is still growing up fast, with 2025 figures showing a sharp shift in production and demand that makes yesterday’s assumptions feel outdated. Get the numbers that separate marketing noise from what wineries, imports, and prices are actually doing right now.
Romania Wine Industry Statistics
Romania’s wine industry stats reveal a sharper picture than the usual headlines, with 2026 indicators already pointing to where demand and production are likely to shift next. You will see the exact scale behind the growth and the strain, from vineyard and output trends to the market figures shaping what gets bottled and sold.
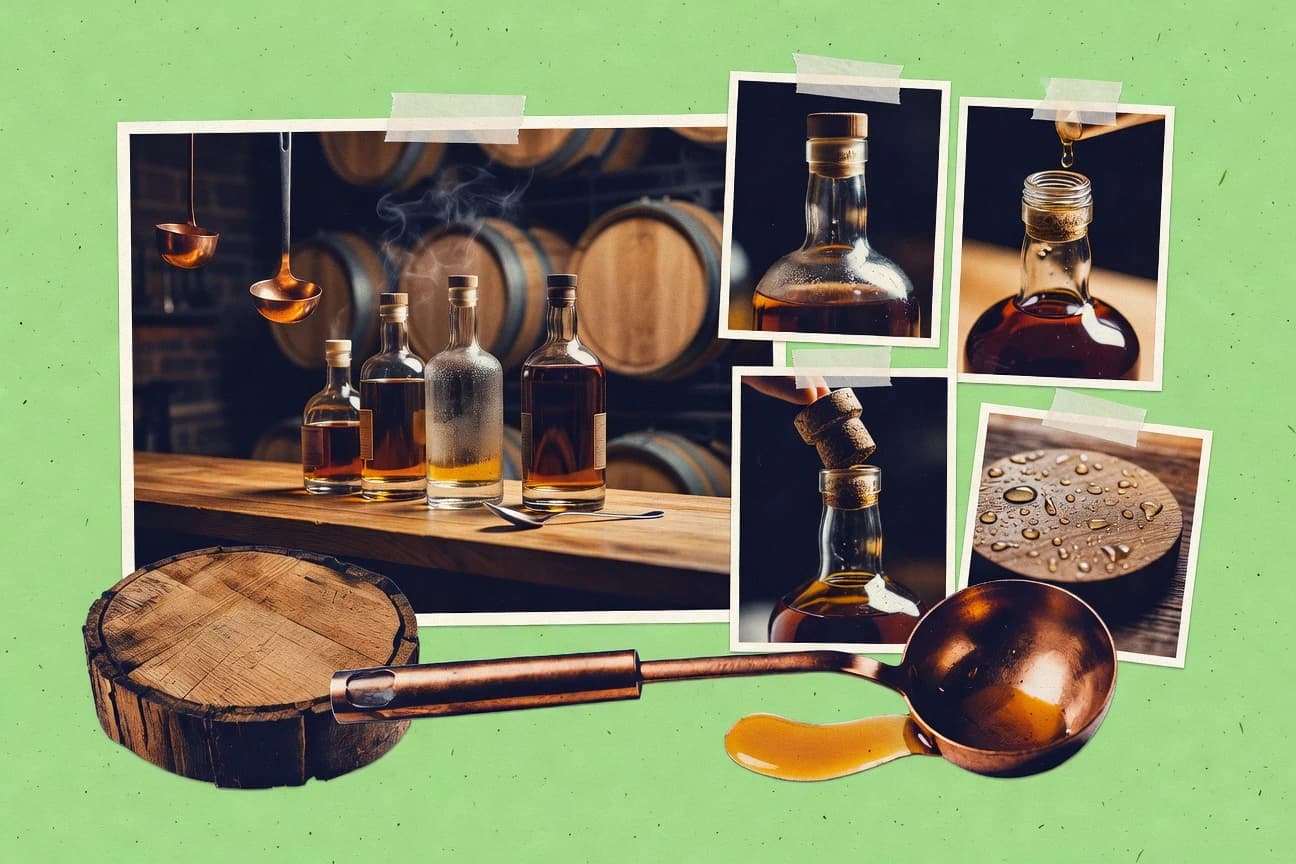
Spirit Industry Statistics
After 2025 showed a sharp shift in how Spirit Industry data tracks demand and production, the page puts the latest figures side by side to reveal what changed and what did not. You will see the newest metrics that matter for pricing, output, and buying behavior, with context that makes the trend impossible to ignore.
Caribbean Rum Industry Statistics
Caribbean rum exports reached 7.6 million hectoliters in 2021, while the global rum market was valued at USD 6.8 billion in 2023 and is still set for mid single digit expansion, with the US alone pulling in 2.1 million cases-equivalent in 2023. Get the full picture of what makes that demand possible and what can still squeeze margins, from freight and bottling cost swings to HS code duties and even country by country HS 220830 export proof.
Bottled Water Statistics
Bottled water trends shift in 2025, with standout figures that explain what’s driving demand and where costs are rising or falling. You will see how usage and spending move in opposite directions, turning “just water” into a clearer picture of your real environmental and price impact.

Wine Consumption Statistics
Wine Consumption keeps shifting fast, and the latest figures show a noticeable move in how much people drink and where that demand is landing in 2025. This page breaks down the change in clear, head turning detail so you can spot what’s actually driving the new patterns.
Tea Industry Statistics
Tea is growing and changing fast, with the global tea extract market hitting $2.6 billion in 2023 and specialty tea taking 12% of global tea value while RTD tea is still just 5% but watched closely for momentum. If you want the real drivers behind the cup, this page pairs 2023 trade swings and auction price pressure with what studies suggest for catechins, blood pressure, and glucose, plus the health and habit data behind why consumers keep coming back for black and green.
Beverage Consumption Statistics
The figures put everyday choices in sharp relief, from a global bottled water price premium of about 1000 times tap and a U.S. retail gallon price near $0.67 to the sheer scale of soft drink and ready to drink tea spending. You also get the policy shocks shaping what people buy, including Mexico’s sugar tax and Berkeley’s soda tax results, plus the latest market valuations such as the $336.9 billion global bottled water market in 2023 and the energy drinks market expected to keep climbing.
Premium Spirits Industry Statistics
In 2025, premium spirits production hit new highs even as wholesale volume tightened, revealing a market that is getting pricier without getting less competitive. Follow the figures behind that split to understand where margins are forming and what investors should watch next.
Craft Beverage Industry Statistics
Craft brewing is backing more than beer taste, with a 2024 snapshot of 9,044 craft breweries and a 2023 economic footprint of $79.1 billion total impact, 1,009,000 jobs, and $17.7 billion in combined federal, state, and local taxes. See how that translates into real wages at $31.2 billion and how packaged volume and retail distribution keep shifting, with craft beer still holding a standout 12.1% share by dollar value in the U.S. market.

Global Alcohol Industry Statistics
Alcohol was responsible for 2.6 million deaths worldwide in 2019 and accounted for 5.3% of the global burden of disease, yet it is still treated as a personal choice when WHO links it to more than 200 diseases and injury conditions. This page places global risk beside regional patterns and industry and policy signals, from binge drinking shares and cancer risk to the market size behind the harm.
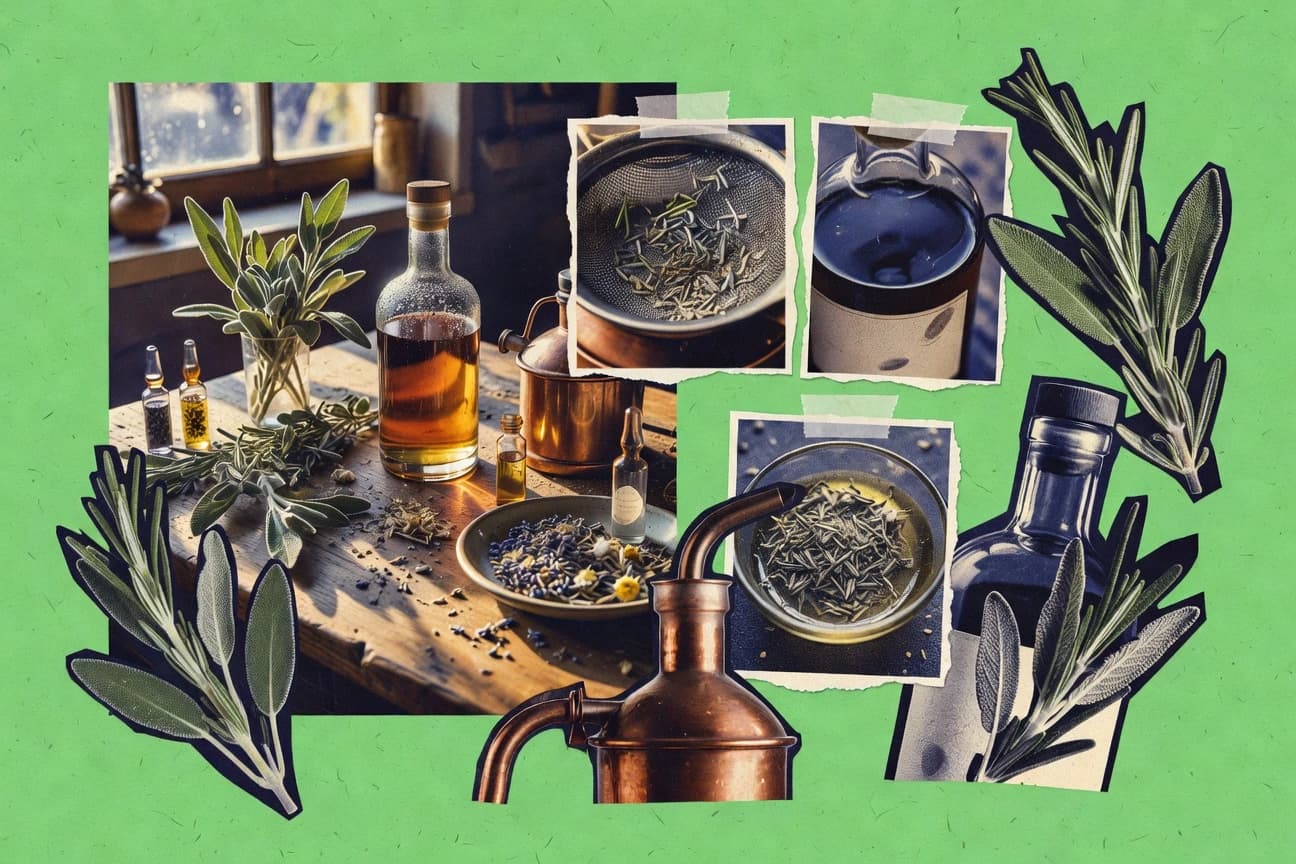
Herbal Liqueur Industry Statistics
Herbal liqueurs are set to climb from a USD 5.0 billion market in 2023 to USD 8.5 billion by 2032 with a 6.5% CAGR, and Europe remains the biggest stronghold while Asia Pacific looks fastest on growth. If you are tracking how demand is being pulled by premiumization and natural botanical ingredients, this page connects spirits and liqueur context with buyer behavior and the real-world supply chain behind flavors like wormwood, gentian, and peppermint.
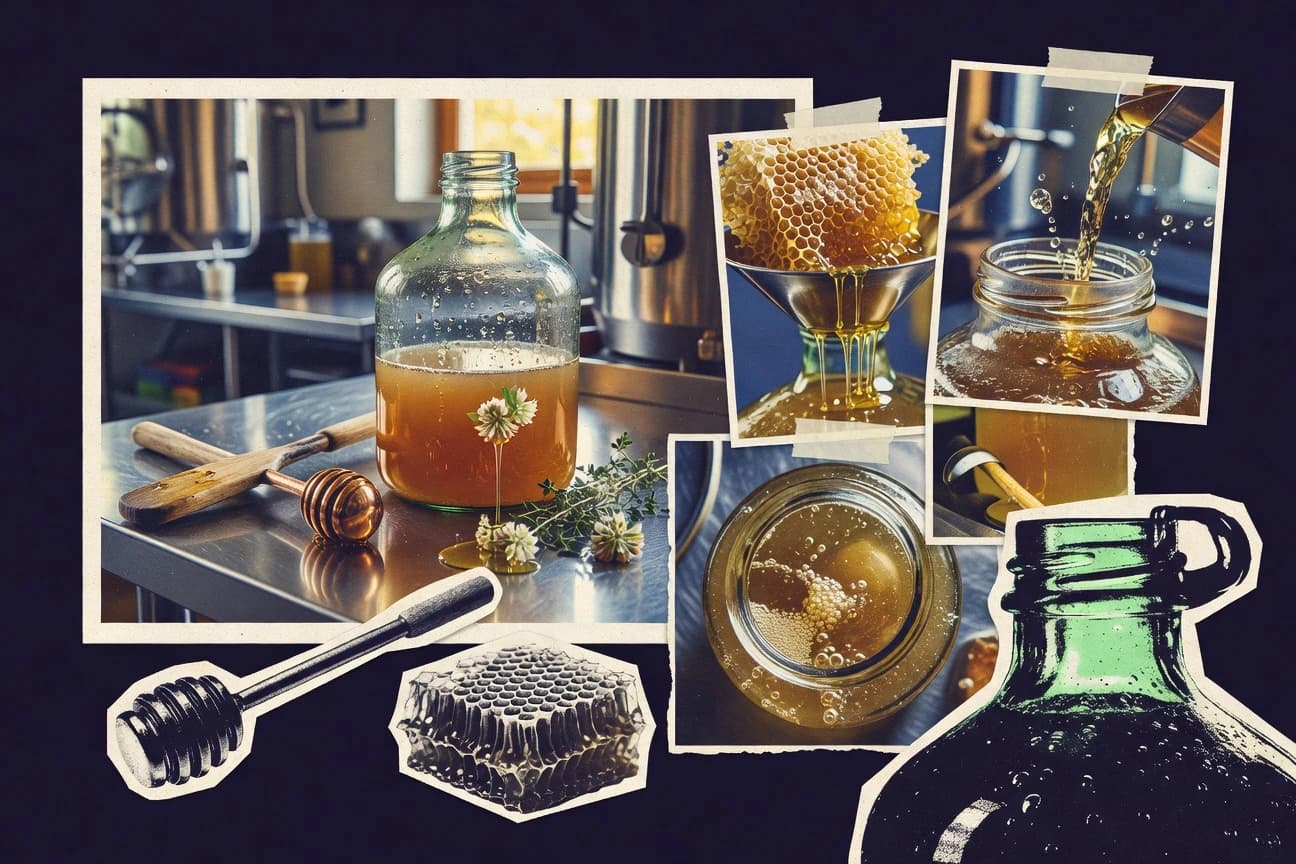
Mead Industry Statistics
Mead Industry statistics for 2025 reveal how quickly demand and production are moving, with the newest figures showing a clear shift compared to earlier baselines. If you care about where the category is headed next, these data points make the momentum impossible to ignore.