GITNUX MARKETDATA
Browse Our Category
Beverages Alcohol
Latest update:


Coffee Industry Statistics
Coffee demand keeps stretching to new records, with global consumption at 170.8 million 60 kg bags for 2023/24 and specialty coffee making up 50% of the US market, while prices are flashing faster with Arabica averaging $1.65 per lb in 2023 and Robusta peaking at $2,200 per MT in 2024. See how shifting tastes like 70% US home brewing and a 12% jump in 2023 ready to drink sales collide with supply risk and stocks estimated at 59.8 million bags by end 2023/24, shaping where value lands next.
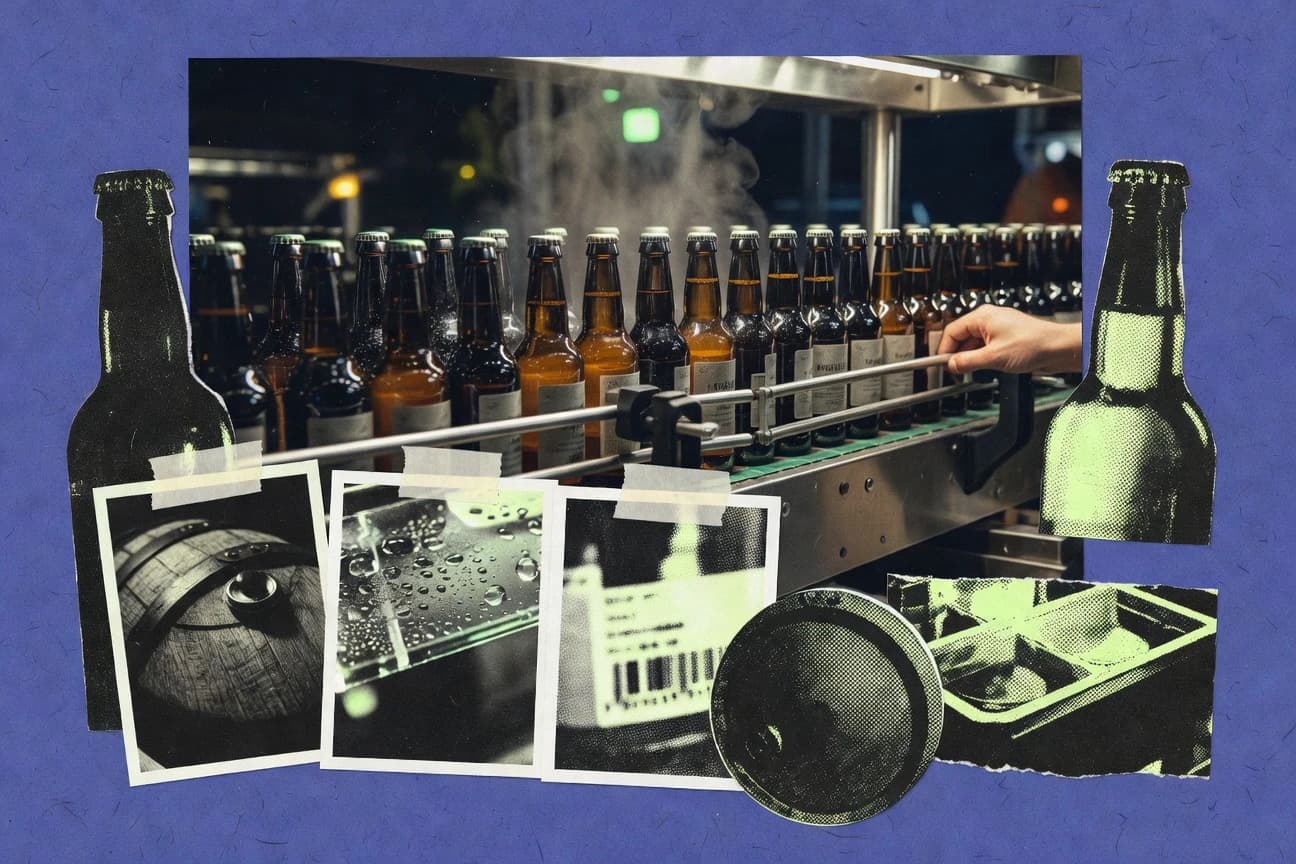
Beverage Alcohol Industry Statistics
Germany makes up about 10% of global beer consumption, while the ready to drink market hit $88.3 billion in 2023 and non alcoholic categories are growing alongside traditional excise revenue and output. Get the sharp contrasts between demand, health burden, and industry costs across beer inventories, distillery feedstock and U.S. binge drinking rates, plus what alcohol related activity adds to economic output and public finances.
Energy Drink Industry Statistics
A 2021 U.S. product composition check found 64% of energy drinks contain B vitamins, yet just 12% of U.S. adult men report current consumption. Track how caffeine labels, sugar free momentum, and rising scrutiny are shaping the category through the latest market and safety findings, including the EFSA conclusion that occasional adult intake up to typical exposure levels is not a safety concern.
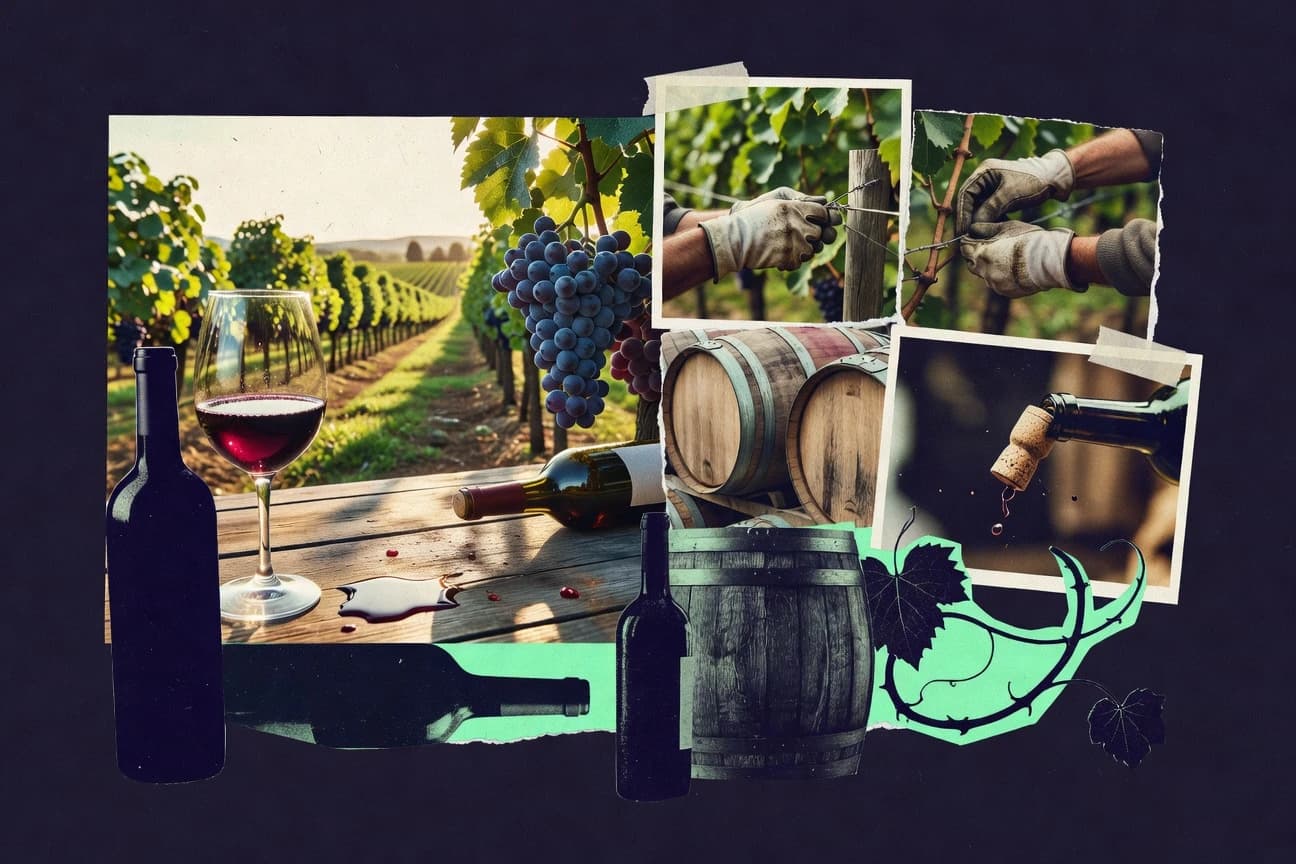
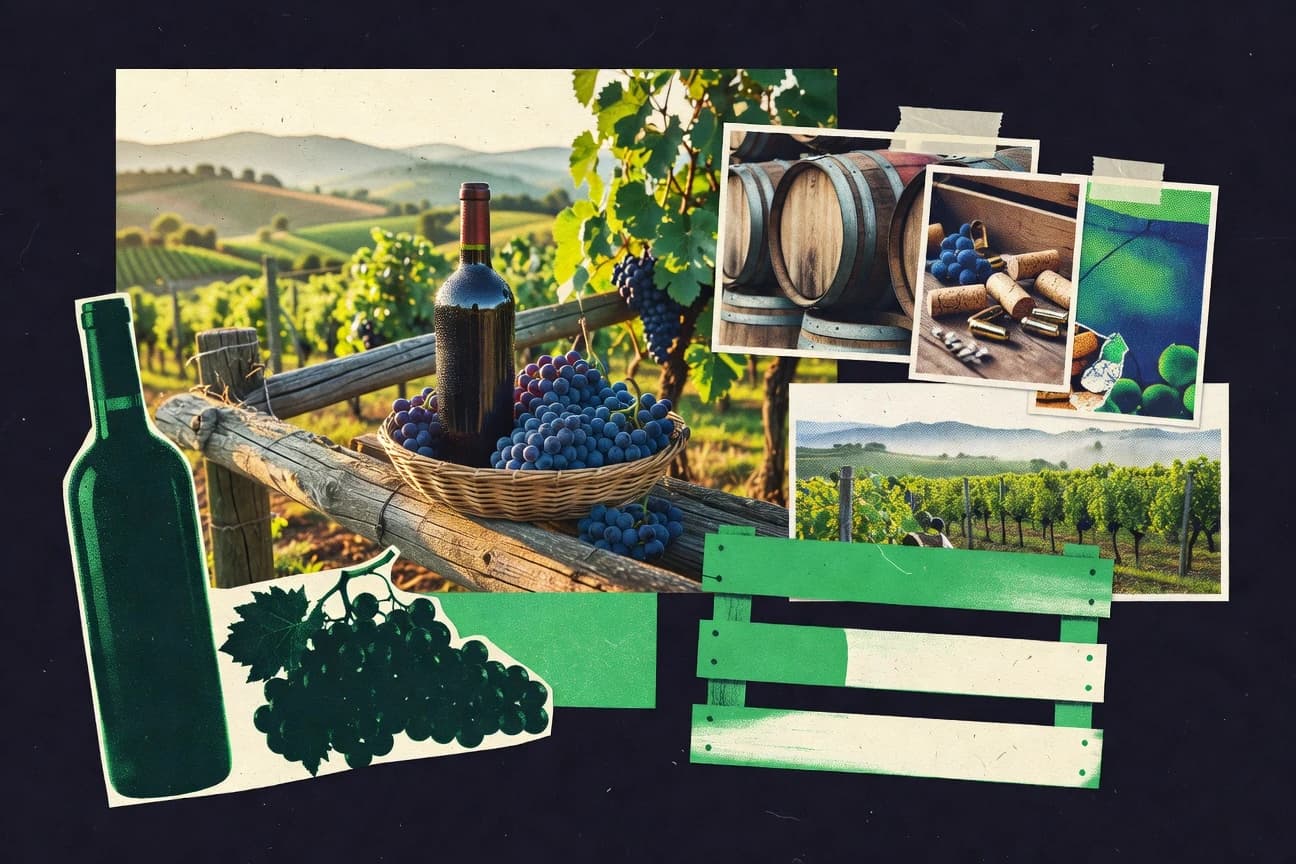
Global Wine Industry Statistics
US wine e-commerce is up 10% year over year and DTC is now 7.0% of sales, while China trails at $1.6 billion in wine imports, pushing growers and sellers to rethink who they sell to and how. Follow how EU sustainability coverage spans 1.7 million hectares and how the wine carbon footprint target of at least 55% GHG reduction by 2030 collides with energy and logistics realities that can swing costs and emissions.
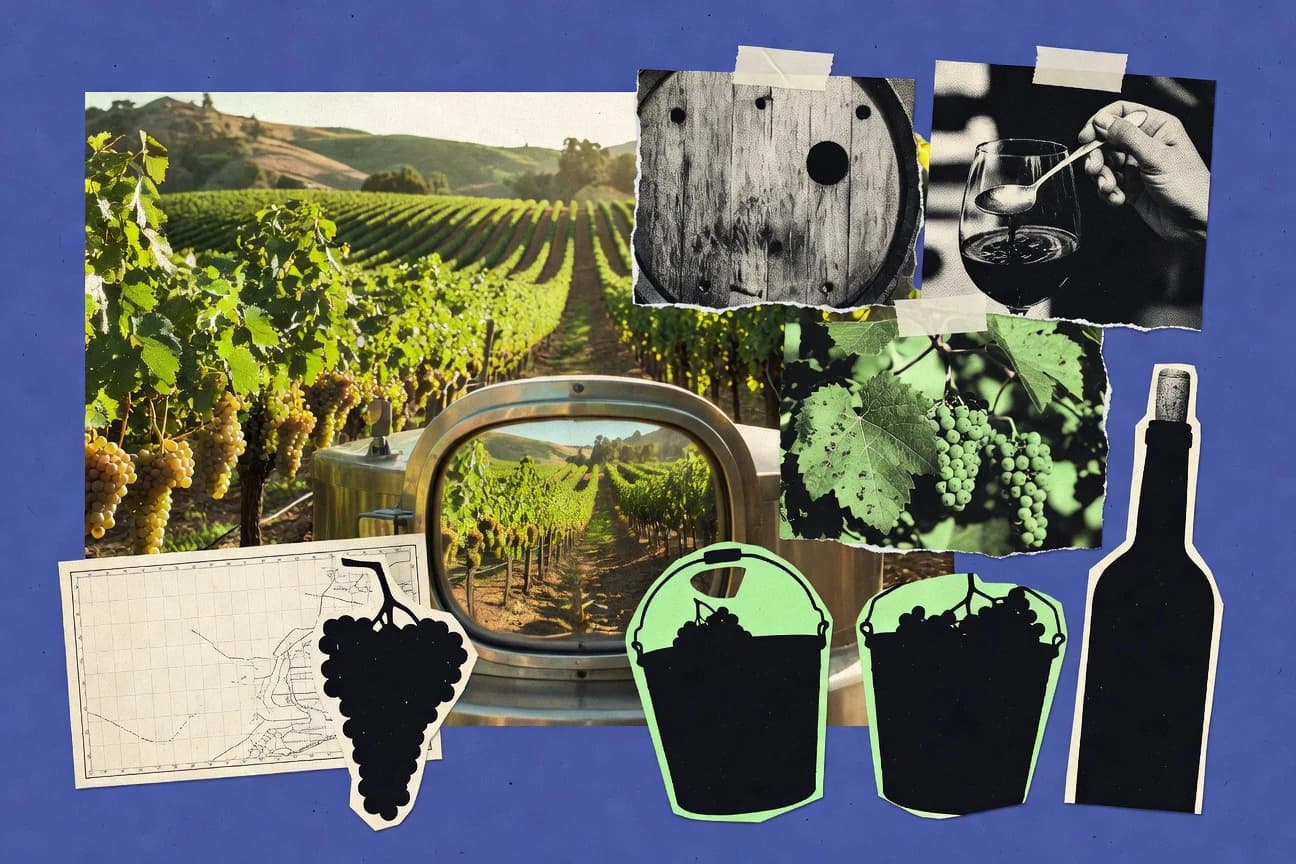
Napa Valley Wine Industry Statistics
Napa Valley’s wine results keep pulling away from the pack as 2023 brought a sweep of acclaim and influence, including 95% of Wine Spectator’s 95-plus scorers in the Top 100 plus Napa’s dominance with 28 wines named to Wine Enthusiast’s Top 100. Then the impact widens beyond the cellar with wine industry economic power totaling $17.2 billion in 2023 and Napa drawing 3.8 million visitors, a scale that makes one question impossible to ignore: how does the region keep producing gold standard bottles while also turning tourism into a core economic engine?

Washington Wine Industry Statistics
Washington’s wine industry powered a $7.8 billion economic impact in 2022 while turning wine alone into $3.2 billion in direct output, and it is a jobs engine too with 110,000 workers statewide. Follow the full ripple effect from $1.7 billion in wine tourism spending and $220 million in exports to $1.2 billion in state and local tax revenue, and you will see how Washington grapes, tasting rooms, and vineyard investment connect to everyday household income.
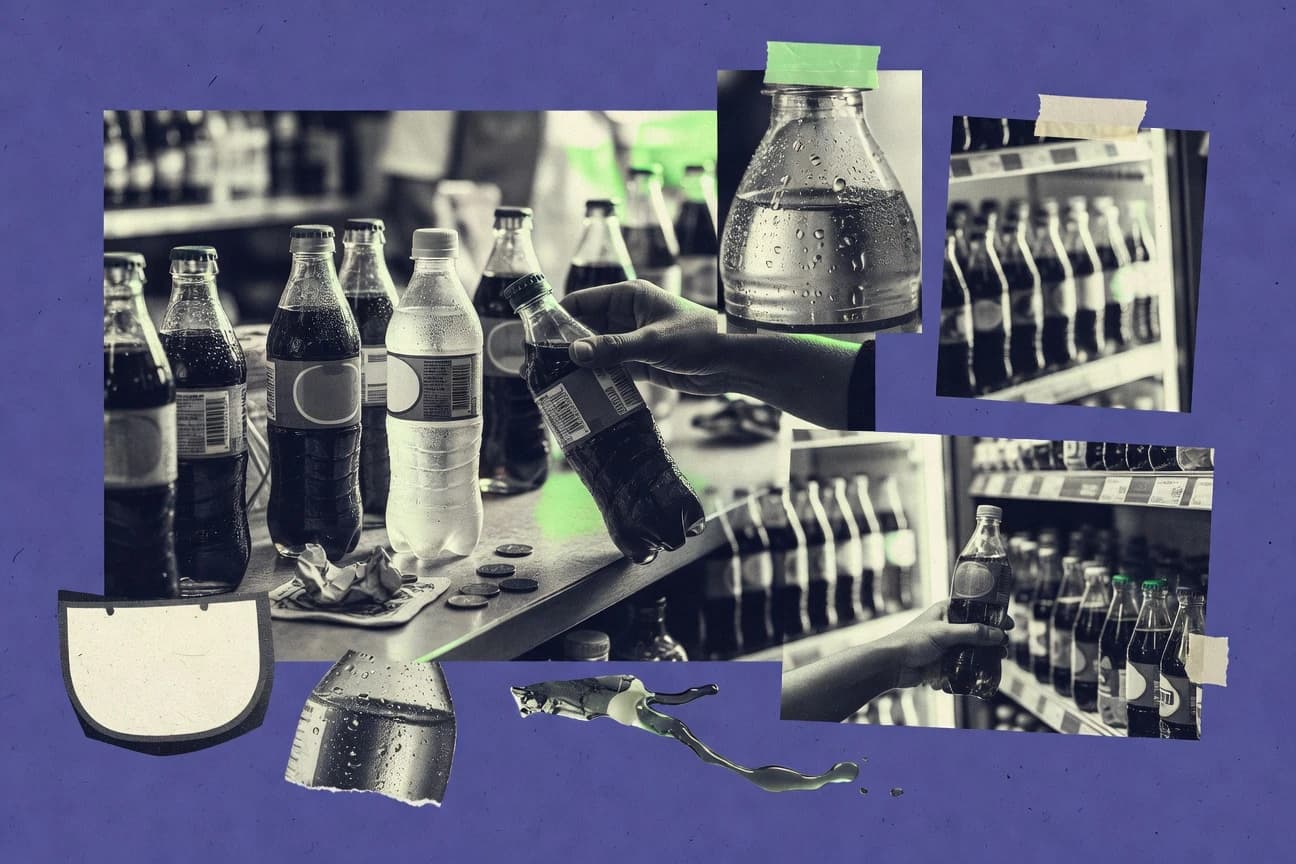
Soft Drink Consumption Statistics
North American shoppers still buy billions of carbonated soft drinks, with 2023 U.S. sales at $41.0 billion and CO2e emissions rising alongside electricity and process energy pressures. This page connects the consumer shift toward diet and zero options with upstream price swings in carbonated inputs and shows how those costs and choices track to health outcomes like weight gain and diabetes risk.
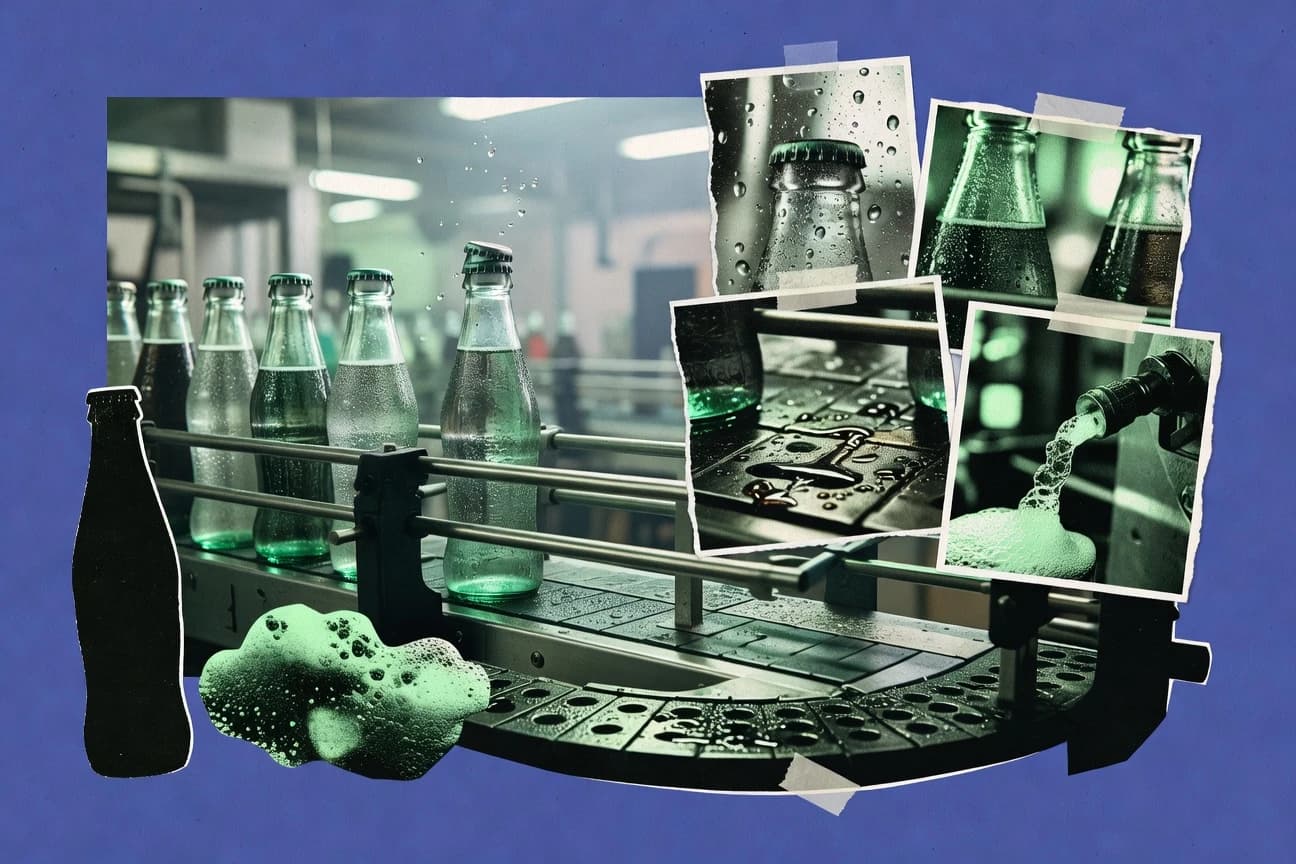
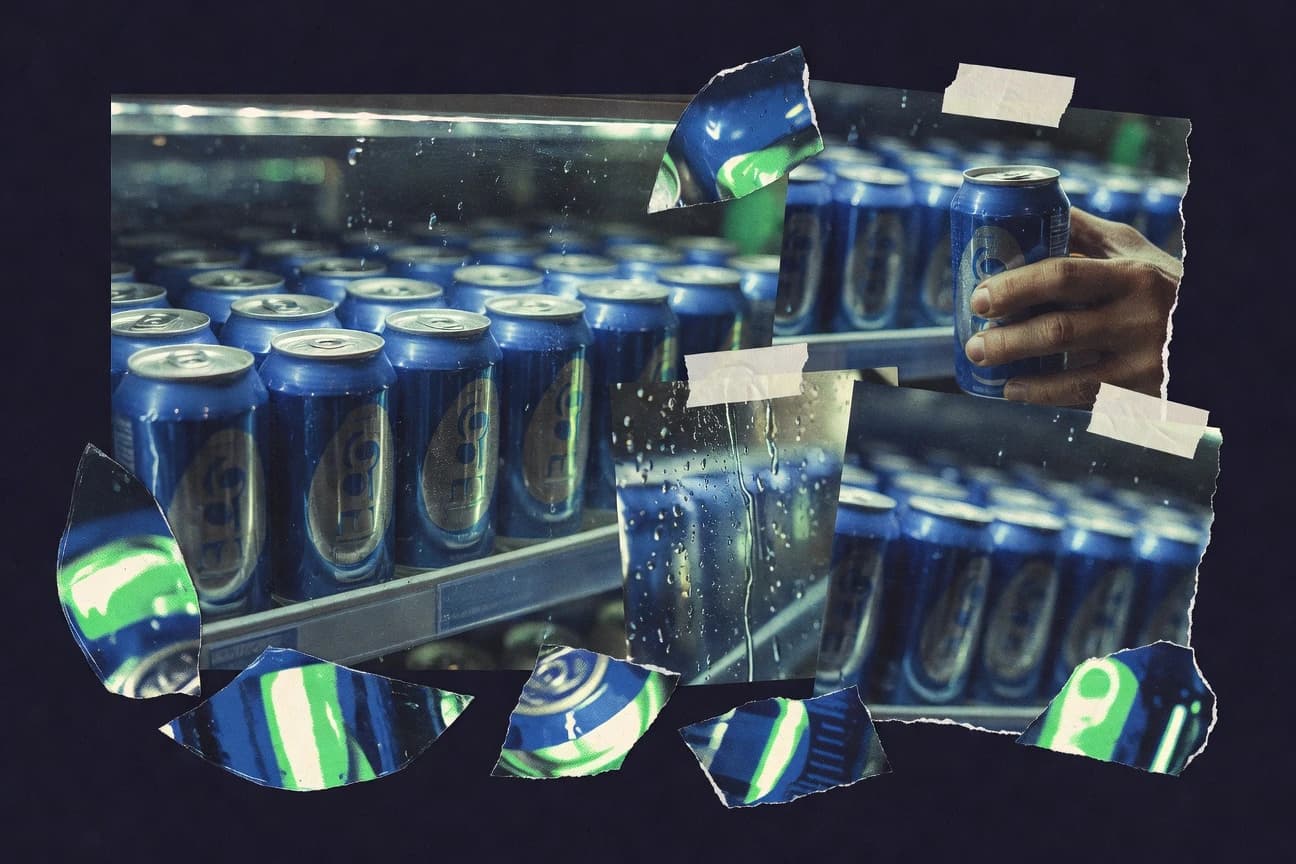
Soda Industry Statistics
Even with PepsiCo’s 11.4% net revenue lift in 2023, soda demand is being pulled in two directions at once as zero sugar keeps accelerating and health policies keep tightening, with 38% of 2024 global launches going sugar free or low sugar and a WHO-aligned 5.1% of U.S. adults meeting the free sugars cutoff. Pair that with the packaging reality behind every bottle and can, from PET’s 1.2 kg CO2e per liter lifecycle impact to aluminum’s 0.045 kg CO2e per can kilogram, and you get a fast, current snapshot of what is driving costs, choices, and emissions in soft drinks.

Cocktail Spirits Industry Statistics
See how Cocktail Spirits Industry demand and pricing are moving in 2025, with key indicators that show where growth is actually happening and where it is stalling. The contrast between fast shifting consumer behavior and slower changes in production and distribution makes these statistics hard to ignore.
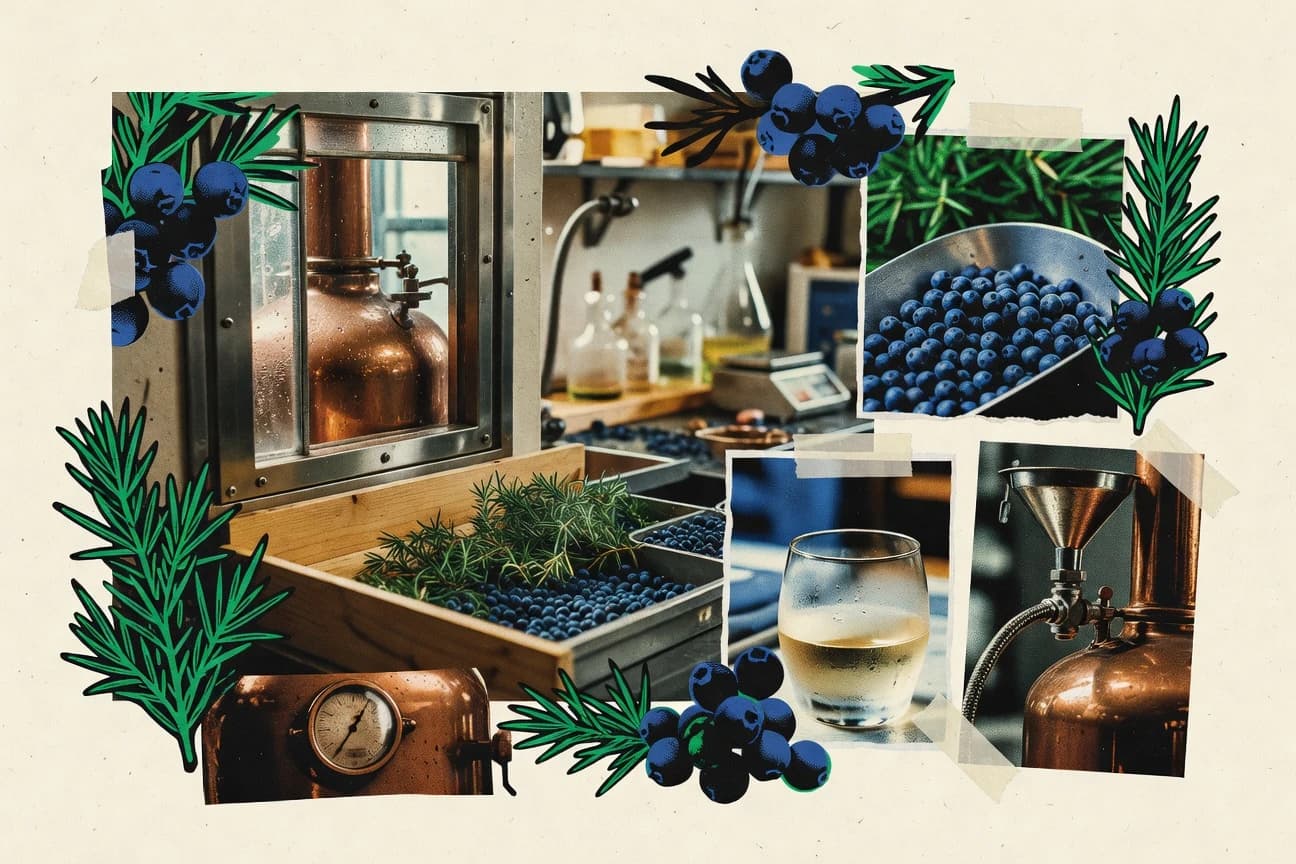
Gin Industry Statistics
Gin Industry statistics reveal how a 2025 surge in sales is reshaping what drinkers expect next, even as key supply and production pressures tighten. Get the clearest snapshot of where growth is coming from and what it’s costing, so you can separate real momentum from short term noise.
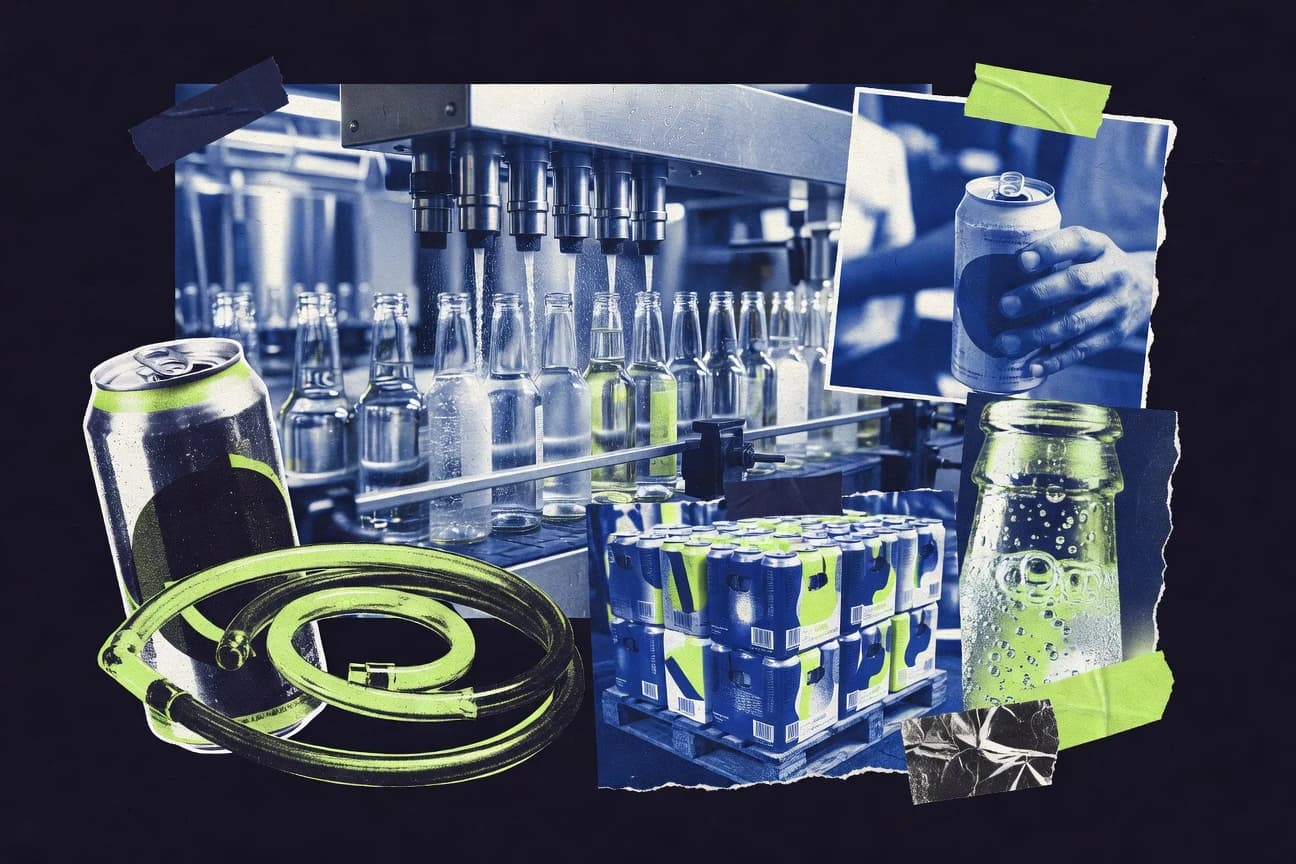
Hard Seltzer Industry Statistics
Hard seltzer is projected to keep climbing, with a 4.0% CAGR for 2019 to 2026 and a forecast market value of $37.1 billion by 2028, even as U.S. shelf pricing rises 6.1% and consumer switching hits 38%. The page connects buyer demographics to real bottlenecks like alcohol licensing rules, import value growth 1.5 times from 2019 to 2022, and EU labeling and packaging compliance costs that can quietly reshape who gets to compete.
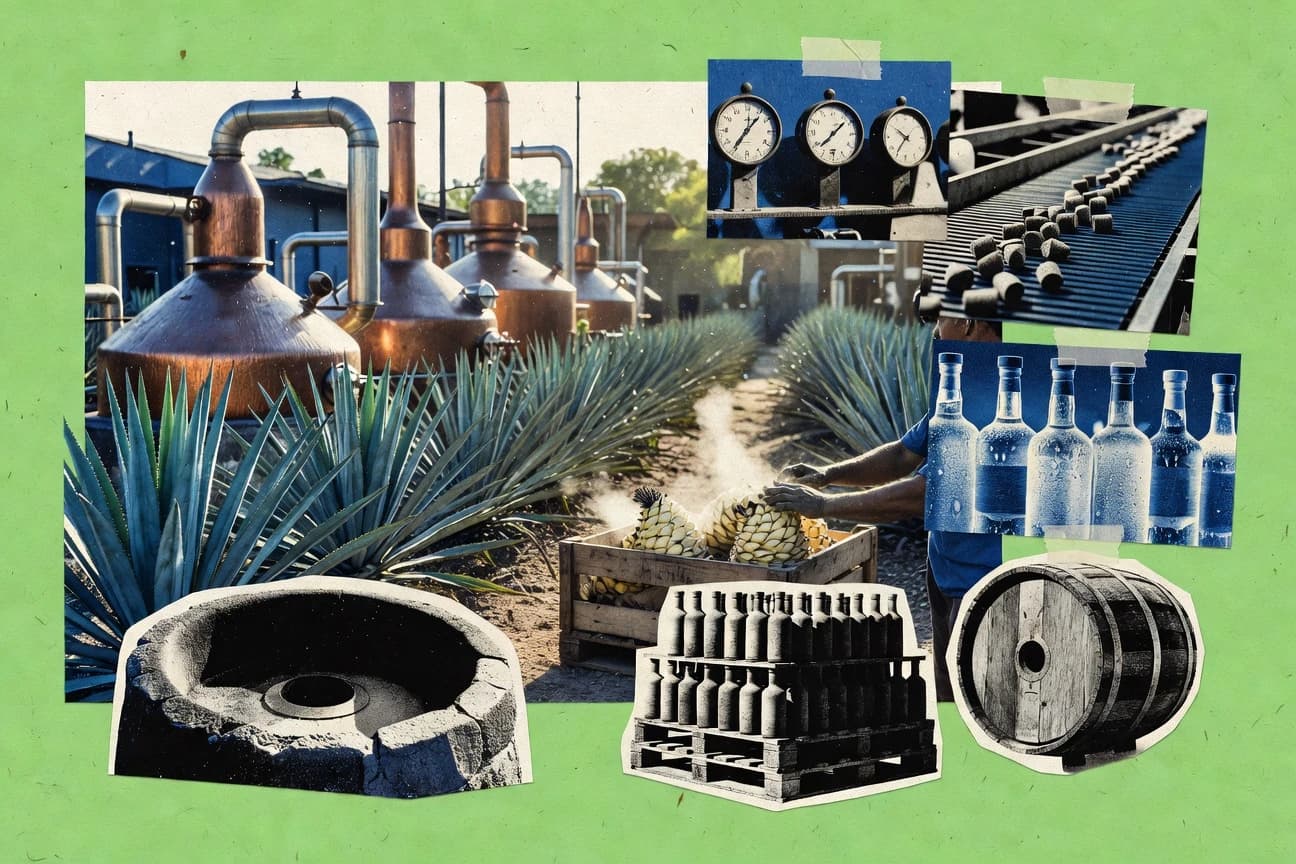
Tequila Industry Statistics
From 1.3% to 0.2%, Tequila Industry’s latest stats reveal how sharply growth can slow even as the market keeps expanding, and the latest figures explain why. You will also see how U.S. import demand and Mexico production pressures line up in real numbers, so the next move looks less like guesswork and more like strategy.

Chile Wine Industry Statistics
Chile’s wine industry is shipping billions in volume while tightening the sustainability and traceability that buyers increasingly demand, including 26 percent renewable electricity uptake and 120 wineries disclosing carbon footprint data as of 2022. You will also see where the biggest pressure points still sit, from packaging driving 45 percent of climate impacts to logistics and water stress reshaping how wine is grown and delivered.
Israel Wine Industry Statistics
Israel Wine Industry statistics up to 2025 reveal how a market of 3,500+ wineries is reshaping what gets produced and where it goes. The contrast between domestic demand and export momentum makes the 2025 picture feel unexpectedly sharp, and worth a closer look.
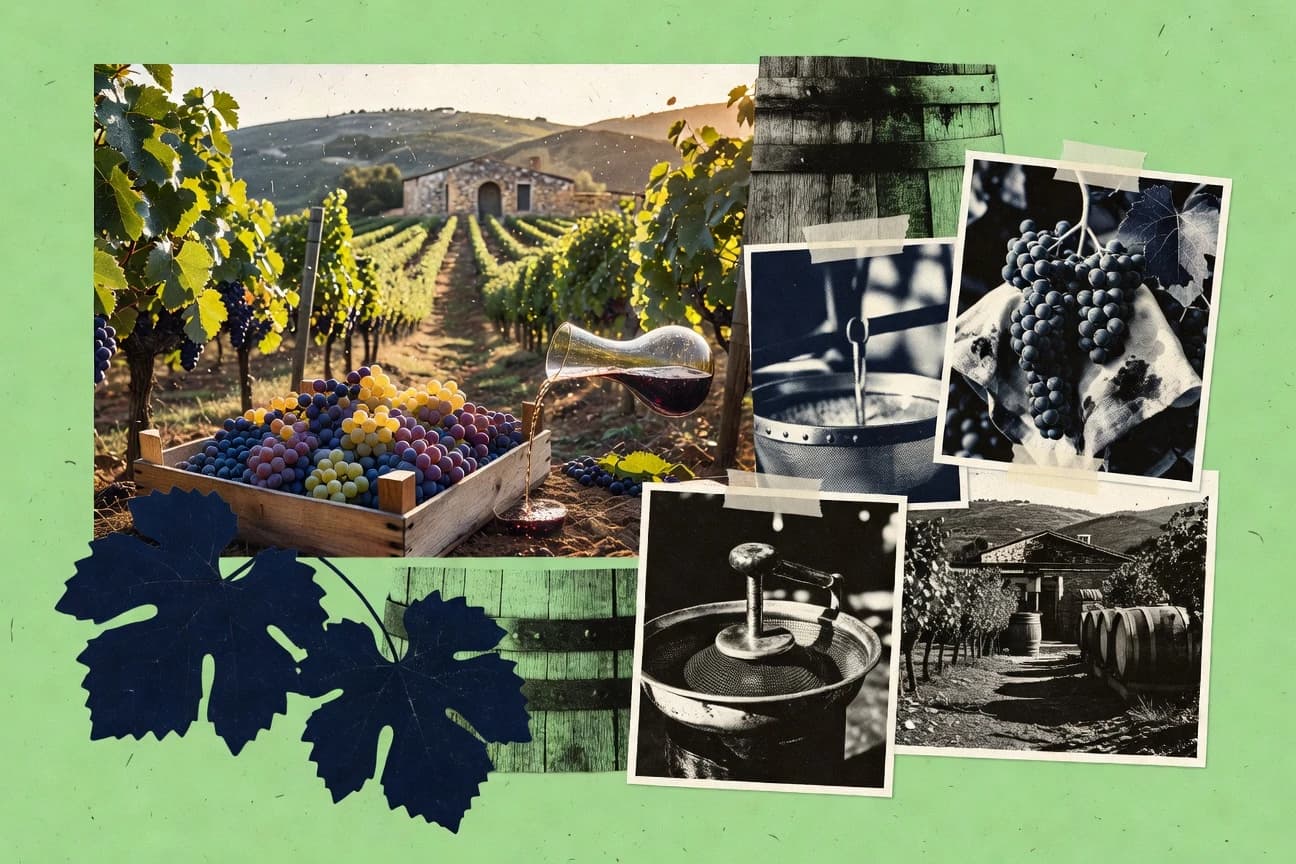
Italy Wine Industry Statistics
Italy’s wine industry is showing a sharper, more recent balance between vineyard value and production realities, with 2025 figures highlighting how quickly market pressure is reshaping what growers can afford to make. See where demand and supply tension is most visible across Italy’s regions and what that means for the next planting cycle.
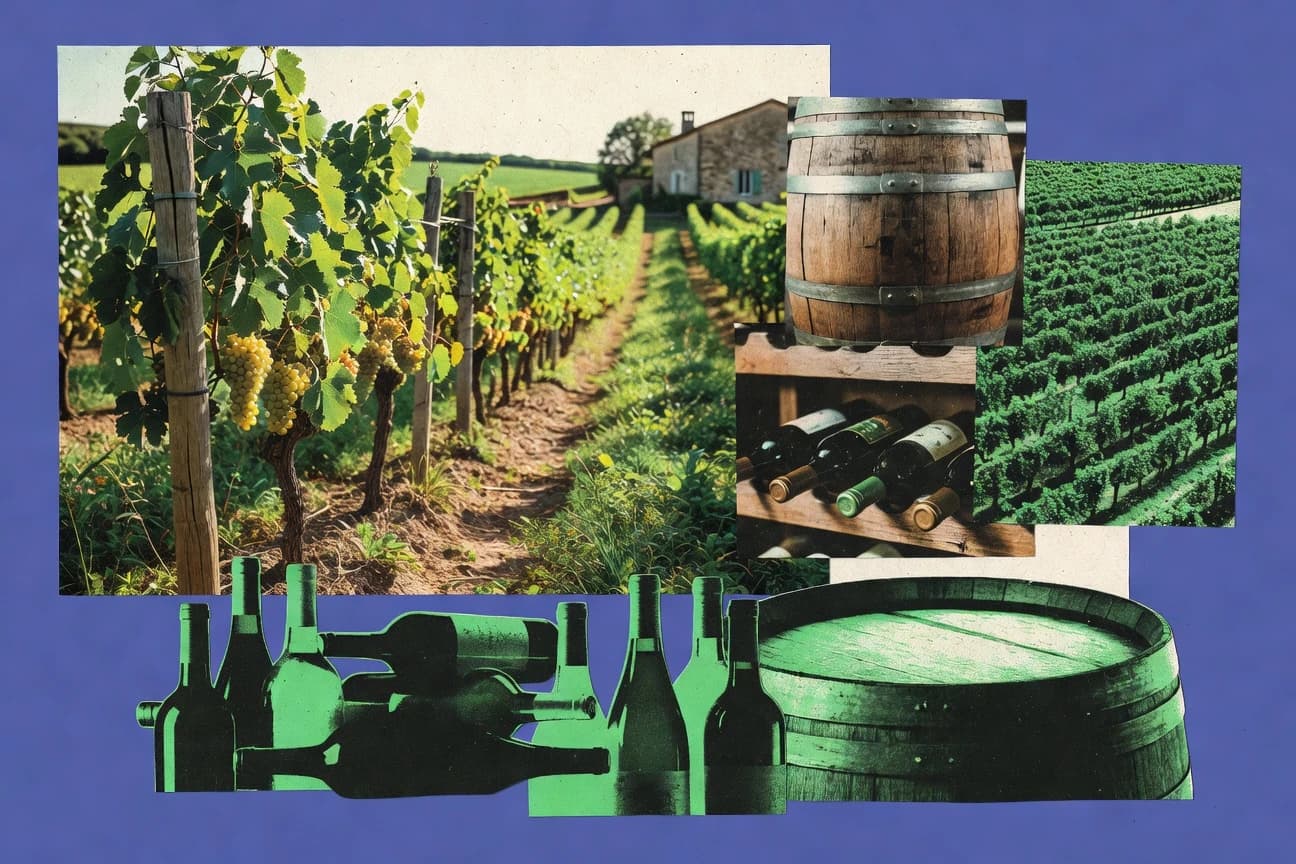
France Wine Industry Statistics
France Wine Industry statistics for 2026 bring the latest view on how demand, production, exports, and pricing are shifting together, not separately. The contrast between what is being made and what consumers and international buyers are actually choosing makes the numbers feel immediate and worth a closer look.
Craft Brewery Industry Statistics
Craft Brewery Industry data turns up a sharp 2026 snapshot of where demand, staffing, and production economics are heading, and it does not match the comforting assumptions many brewers still work from. If you want to understand what is really changing fast enough to affect tasting rooms and wholesale orders, you will want these latest figures in front of you.
Napa Wine Industry Statistics
See how Napa’s wine universe looks right now, with 2026 projections on acreage and production that can shift your expectations fast. The page pairs those forward looking figures with the latest bottling volumes, spotlighting where demand is tightening and where it is loosening across the region.

Alcohol Use Statistics
Alcohol Use statistics aren’t just about drinking, they reveal how risk shifts with age, frequency, and binge patterns, with 2025 figures highlighting the gap between people’s perceptions and their actual consumption. If you want to understand what the latest data says about who is most affected and when, this page gives the clearest snapshot.
Japan Beer Industry Statistics
Japan’s beer scene is showing a sharp split between consumption volume and recent value trends, and the 2025 figures put that tension in clear focus. Get the key industry statistics that explain why demand looks steady in one way but profits and product mix are moving differently, beer by beer.