GITNUX MARKETDATA
Browse Our Category
Beverages Alcohol
Latest update:

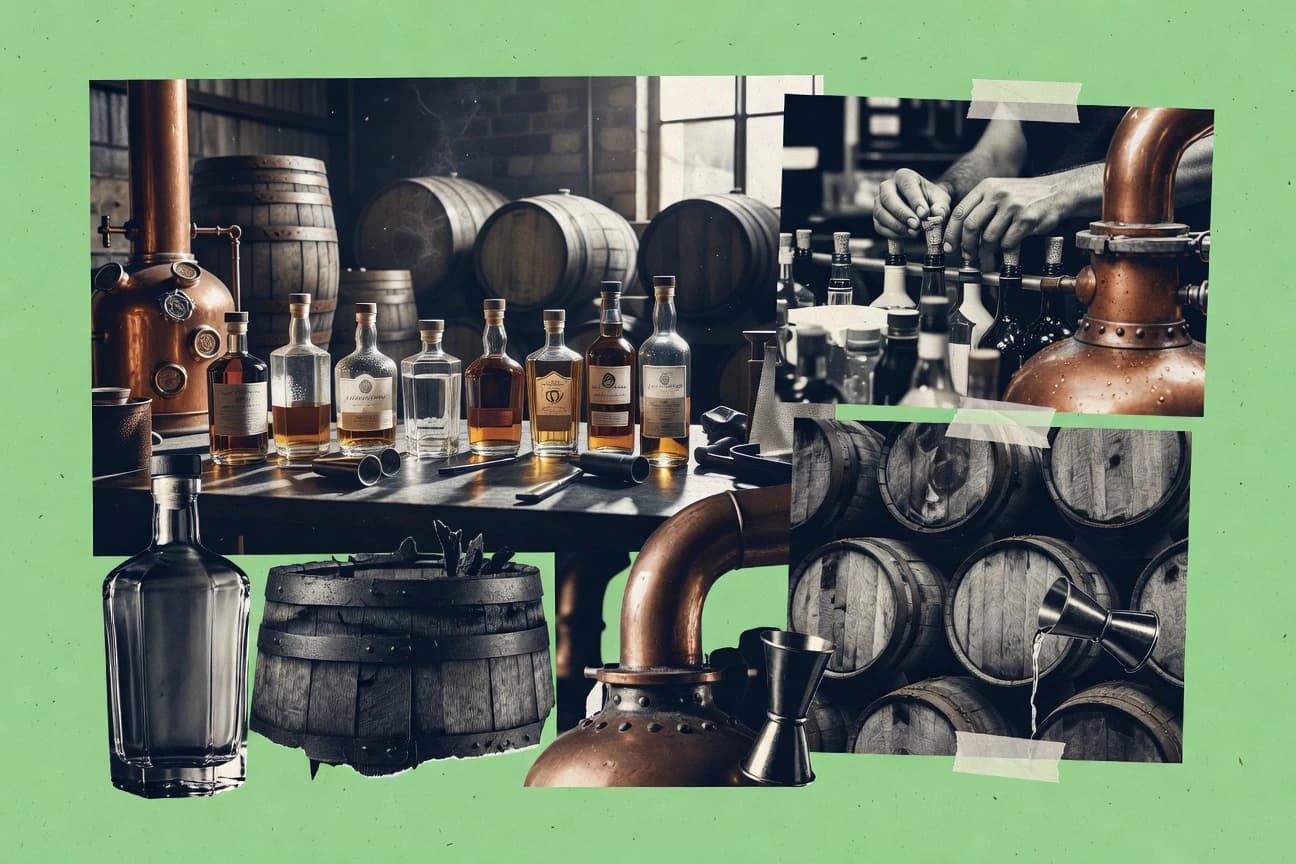
Whisky Industry Statistics
With 2026 figures showing Scotch volumes moving in the opposite direction to Irish whiskey demand, these Whisky Industry statistics force a sharper look at what drinkers are actually choosing now. Pair the latest market totals with production and export signals to see where momentum is building and where it’s quietly stalling.
Japanese Alcohol Industry Statistics
Japan’s alcohol industry stats show a sharp 2025 shift in demand and production, with costs and purchasing power moving in opposite directions. See how the latest figures for consumption volume and shipment trends expose what buyers are choosing now, and what that means for brands trying to stay profitable.
Cognac Industry Statistics
See what changed in 2025 across Cognac production, exports, and pricing signals, and why that shift matters for buyers, brands, and investors alike. The page tightens the latest industry statistics into a clear picture of momentum versus headwinds so you can judge demand with confidence.

Mezcal Industry Statistics
Mexico’s mezcal industry is shifting fast, with production up to 2024’s 33.0 million liters while exports climb and brand level competition tightens. The numbers behind those moves show exactly who is gaining ground and what that means for pricing, labeling, and the next wave of growth.
Liquor Sales Statistics
Liquor Sales statistics show how the latest year’s shift in consumer demand is reshaping where every bottle lands, with 2026 data setting a sharper pace than the prior trend. See which categories and channels are gaining momentum and which ones are losing ground so you can spot the next sales swing before it becomes obvious.
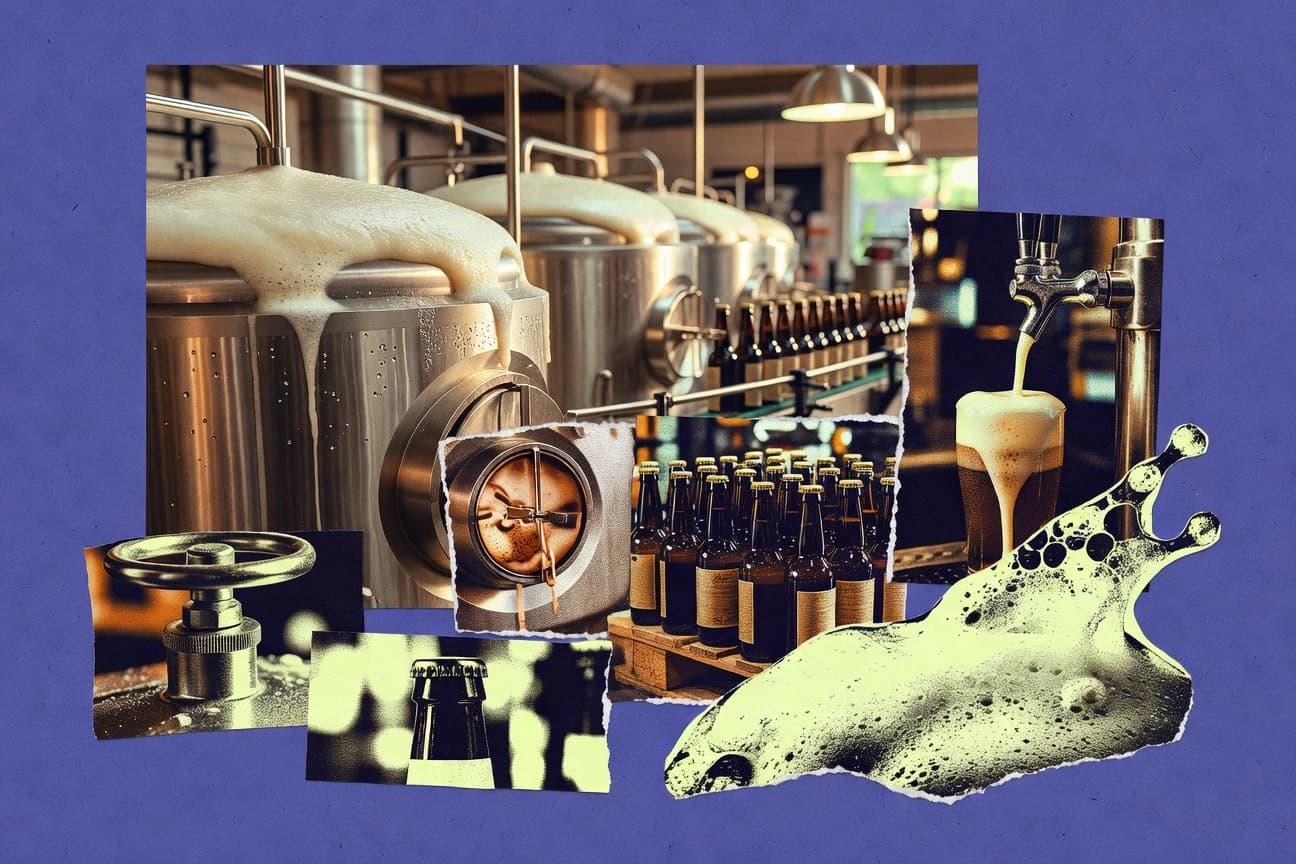
Brewery Industry Statistics
Brewery Industry’s latest figures show how quickly the market is shifting, with 2026 standing out in the data where many category trends have been moving more slowly. Get the key statistics behind that change and see what it could mean for operators trying to plan capacity, pricing, and sourcing with confidence.
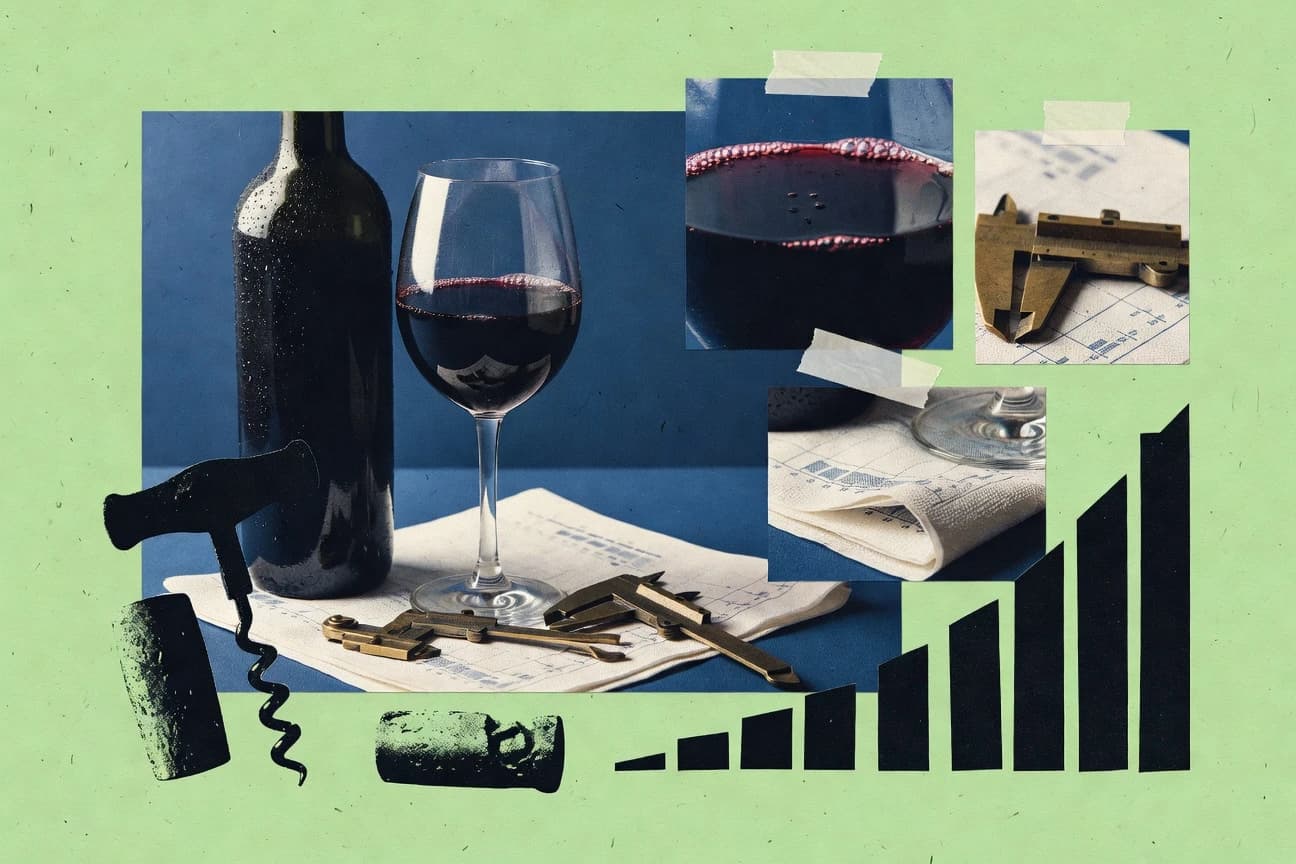
Wine Statistics
Wine buyers are shifting fast, with 61% choosing wines that fit personal taste over brand labels in 2025, and online purchases now accounting for 28% of all sales. See how that preference pivot changes what gets stocked, promoted, and actually moves from shelf to glass.
Global Beer Industry Statistics
Global beer is projected to keep expanding with a 2.9% CAGR through 2019–2024, even as COVID shocks and a 27.7% global volume drop in 2020 still echo in recovery curves, while cost pressures and climate rules pinch from packaging to energy. Track the market from $636.1 billion in 2023 beer value to aluminum gains and EU ETS averages at €80 per tonne, plus supply tightness like barley output at 149.5 million tonnes in 2022 and yeast and cooling timelines that shape how breweries plan production.
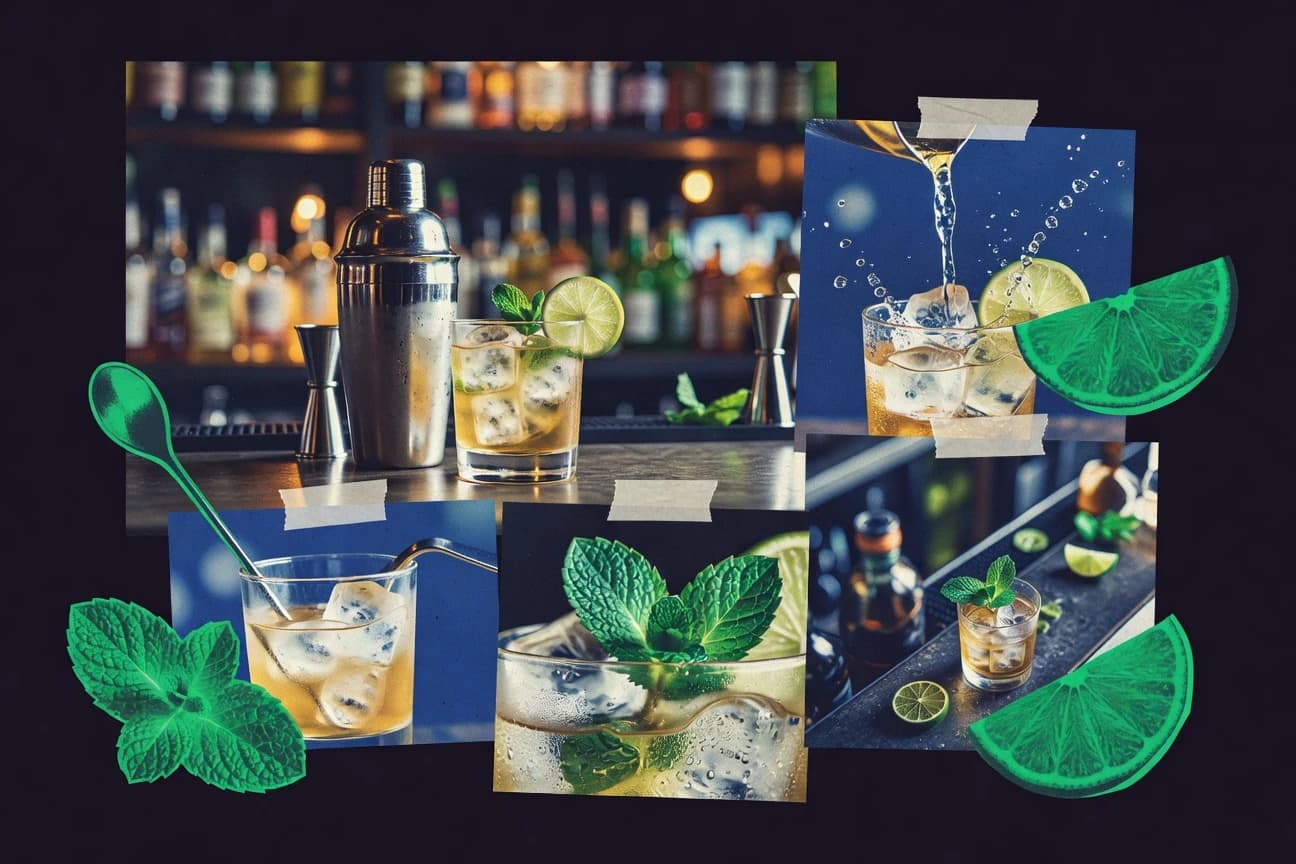
Cocktail Industry Statistics
From an 8.7% CAGR for cocktail mixers (2023 to 2030) to a 53% share of US consumers buying alcohol online, the page traces how home mixing went from occasional to routine while bar economics feel the squeeze. With US cocktail bars alone at an estimated $1.9 billion revenue pool and operating costs rising through labor at $15.60 per hour and beverage cost of sales averaging 26%, it connects demand and margins in one tight read.
Energy Drink Sales Statistics
Energy Drink Sales are showing a clear 2026 split between where demand is accelerating and where it’s flat, with the biggest gains tied to a shift in buyer preferences. See which categories are pulling away and what that means for the next wave of sales strategy.
Vodka Industry Statistics
Global vodka production is up to 11,374,700 hectoliters, a jump from 10,427,000 hectoliters the year before, while the market is valued at $61.5 billion in 2023. It is a rare industry where Russia still dominates consumption and spirits policy meets fast moving brand momentum, from top producers to premiumization and flavored vodka’s surge.
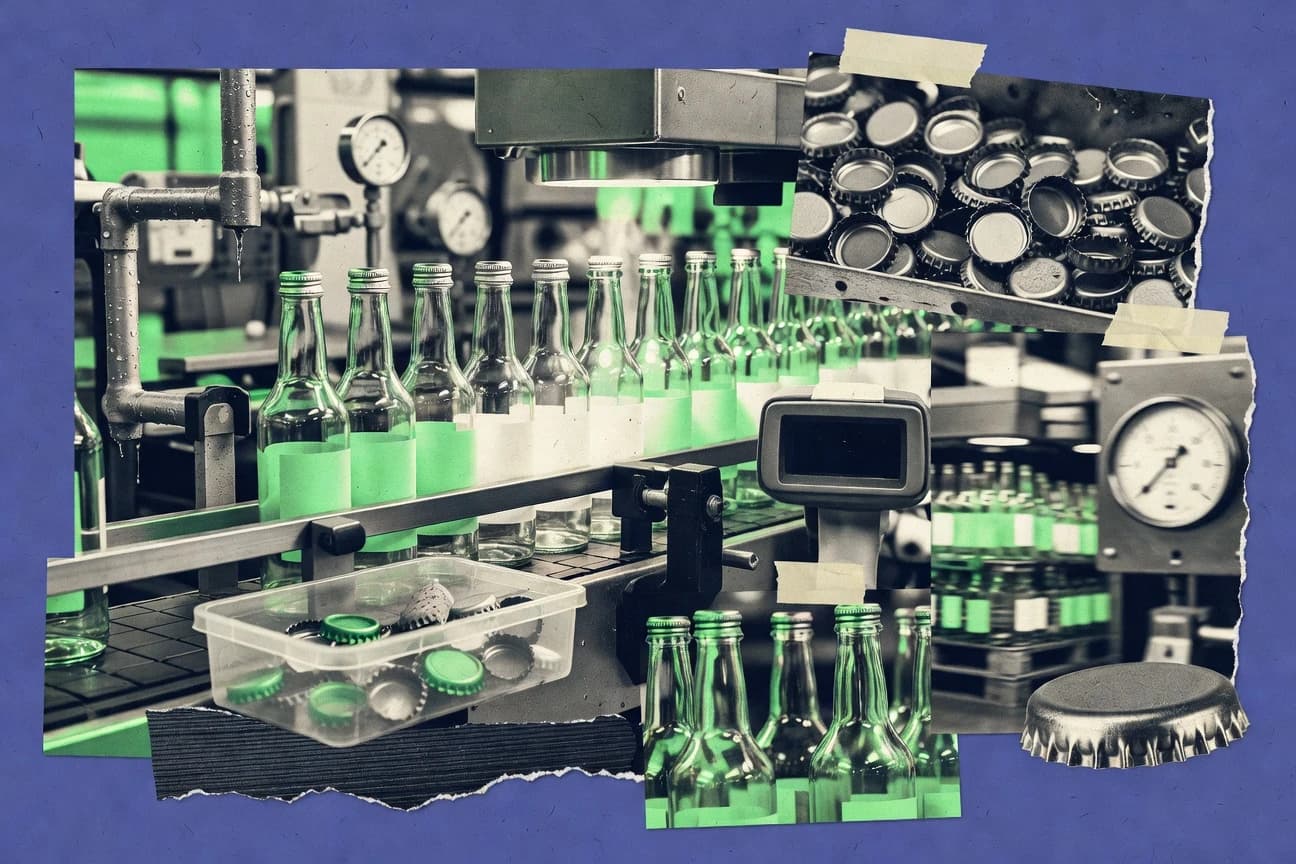
Germany Beer Industry Statistics
Germany’s beer scene is still exporting at scale, with 22.2 million hectolitres shipped in 2023 while breweries produced 85.1 million hectolitres at home, creating a +14.3 million hectolitres surplus that contrasts sharply with domestic consumption of about 79.1 million hectolitres. Get the full picture behind the brewhouse and the supply chain, from registered breweries and trade partners to malt, hops, and cost pressure reflected in beer and malt producer price moves.
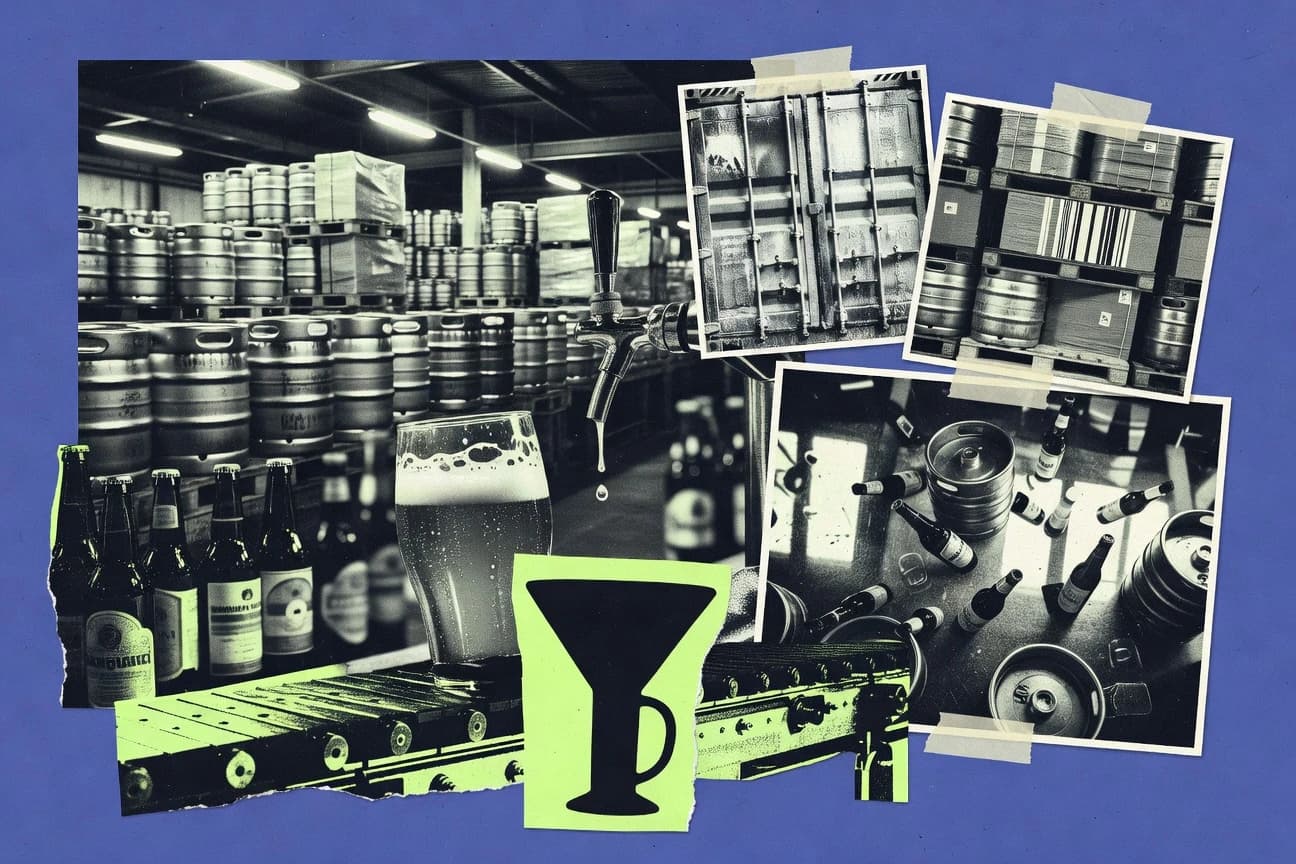
Beer And Wine Industry Statistics
Beer and wine are projected to surge while operations get more trackable and efficient, from beer growth targeting $355.5 billion by 2030 to wine climbing toward $2,607.0 billion, alongside 84% of food and beverage manufacturers using barcode scanning and traceability systems. The twist is how fast customer acquisition and compliance tech is moving, with 78% of beer and wine marketers relying on email and 21% of traceability projects adding RFID, even as alcohol buying habits shift across the US and EU.
Spirits Industry Statistics
Global spirits are projected to grow at a 3.3% average annual rate from 2023 to 2028, with the ready to drink segment climbing from US$22.9 billion in 2023 to US$30.3 billion by 2028, even as the EU still posted a 1.7% drop in consumption volume in 2022. Follow how whisky, vodka, gin, and tequila all expand to new value highs while export, tax, and price pressures reshape what consumers actually buy and how brands compete.
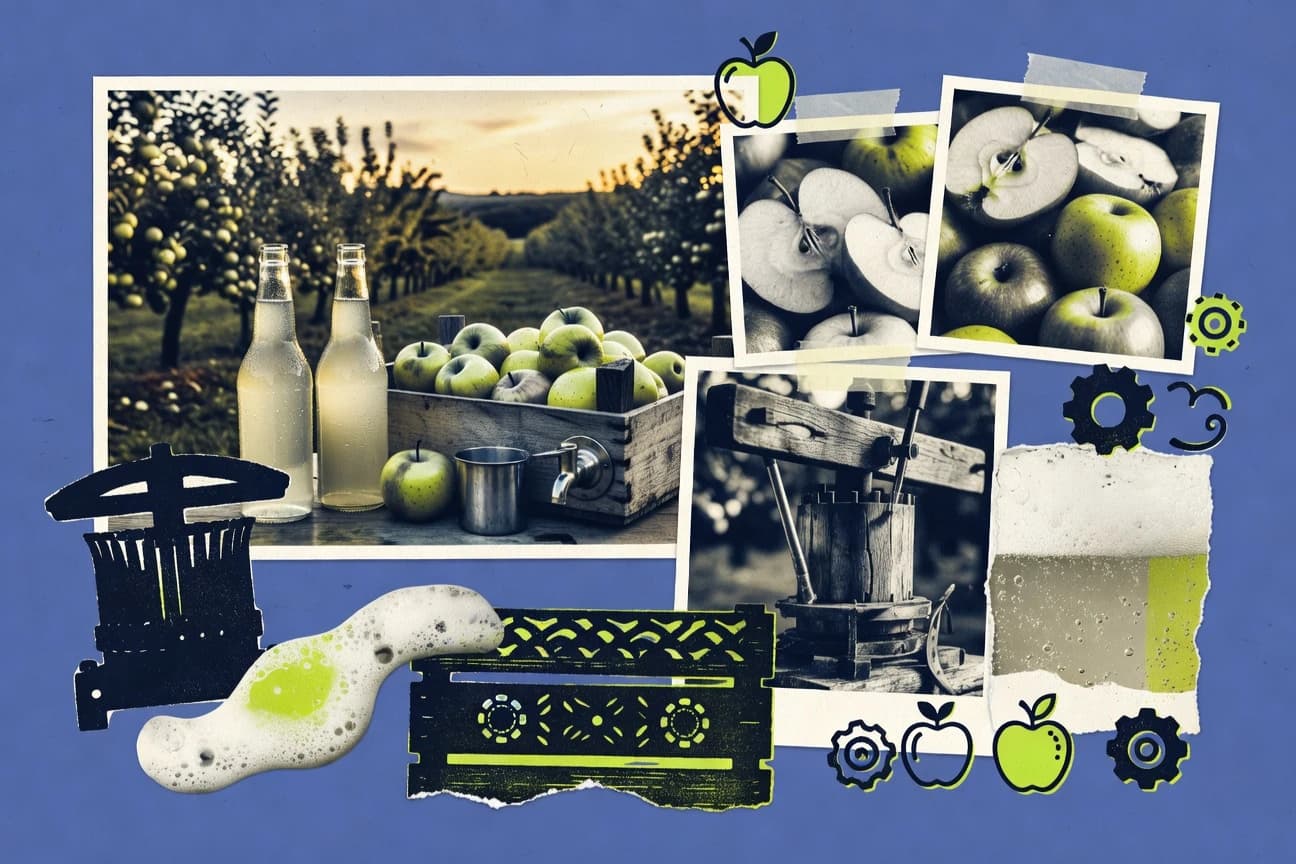
Cider Industry Statistics
Fruit flavors are now the choice signal for younger drinkers, with 73% of US consumers aged 18–34 preferring flavored cider varieties in a 2022 survey, while EU categories move under strict guardrails like 12.5 mg/L maximum patulin and tight sulphur dioxide limits. See how process gains such as 72°C for 15 seconds delivering around a 6 log yeast kill sit beside branding and supply figures like 29.0 million hectoliters of EU cider and perry in 2022 and 3.9% growth in US hard cider shipments, so you can tell what is changing and what regulators still demand.

Uk Wine Industry Statistics
UK wine drinkers were buying more than ever in 2025, with import volumes continuing to rise while the gap between what is stocked and what is consumed tightens. If you want to understand where demand is heading and how quickly UK shelves are being refilled, these UK Wine Industry statistics give you the clearest picture of the shift.
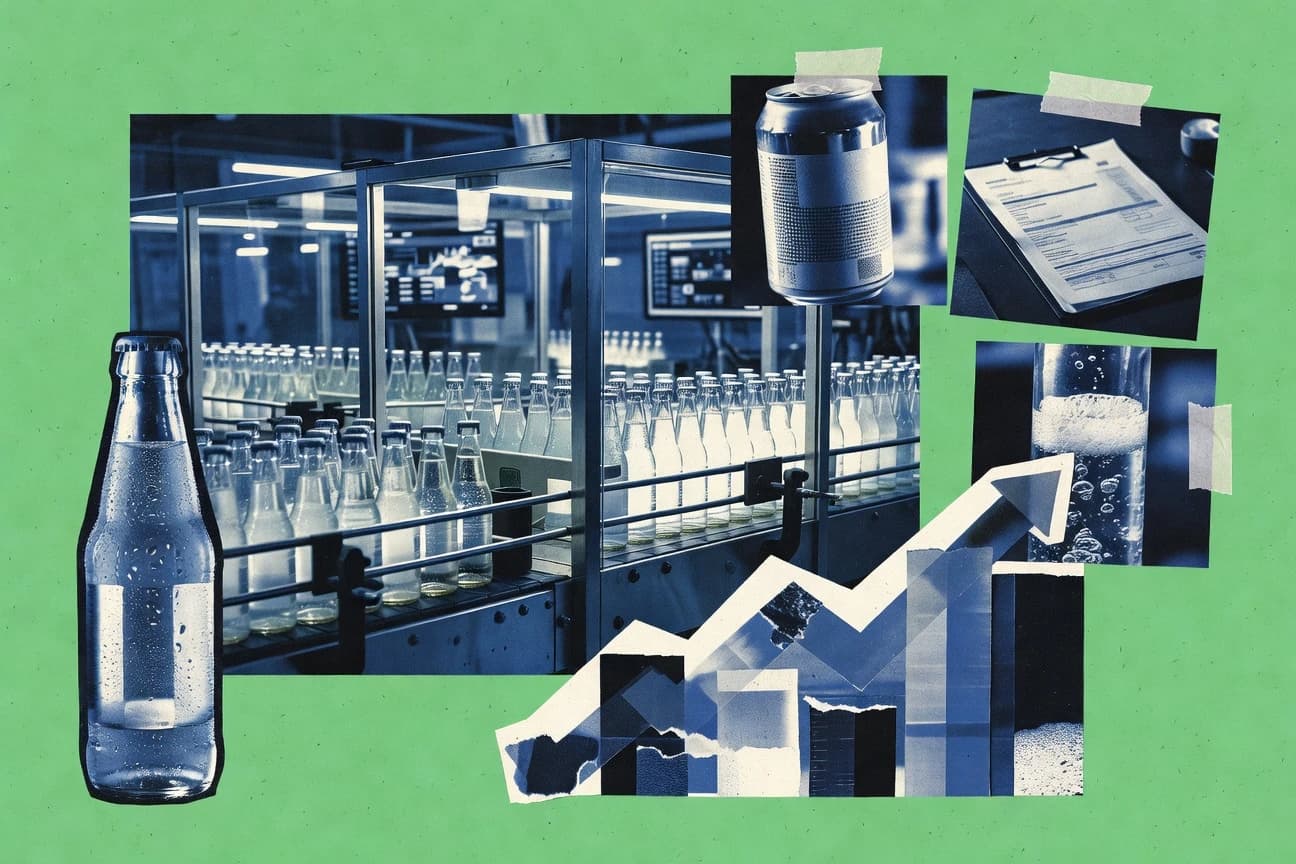
Beverage Industry Statistics
Beverage demand keeps flipping from indulgence to function and restraint with 62% of global consumers preferring low or no sugar options and 71% actively seeking functional health benefits. At the same time, the industry is scaling fast through e commerce and energy drink momentum, with 18% growth online among urban shoppers in 2023 and energy drinks projected to jump from USD 53.1 billion in 2023 to USD 92.4 billion by 2030, so this page ties consumer shifts to where revenue is actually heading.
Alcohol Industry Statistics
Global alcohol spending hits $1.7 trillion in 2022 as consumption patterns split sharply, with Europe topping at 9.8 liters of pure alcohol per person in 2019 while low and no alcohol options surged 31% in 2022 and RTDs climbed to 4 billion liters. Follow the trade, taxes, production, and health impacts, from alcohol contributing to 3 million deaths each year worldwide to craft beer and export booms that are reshaping how drinks are made and sold.
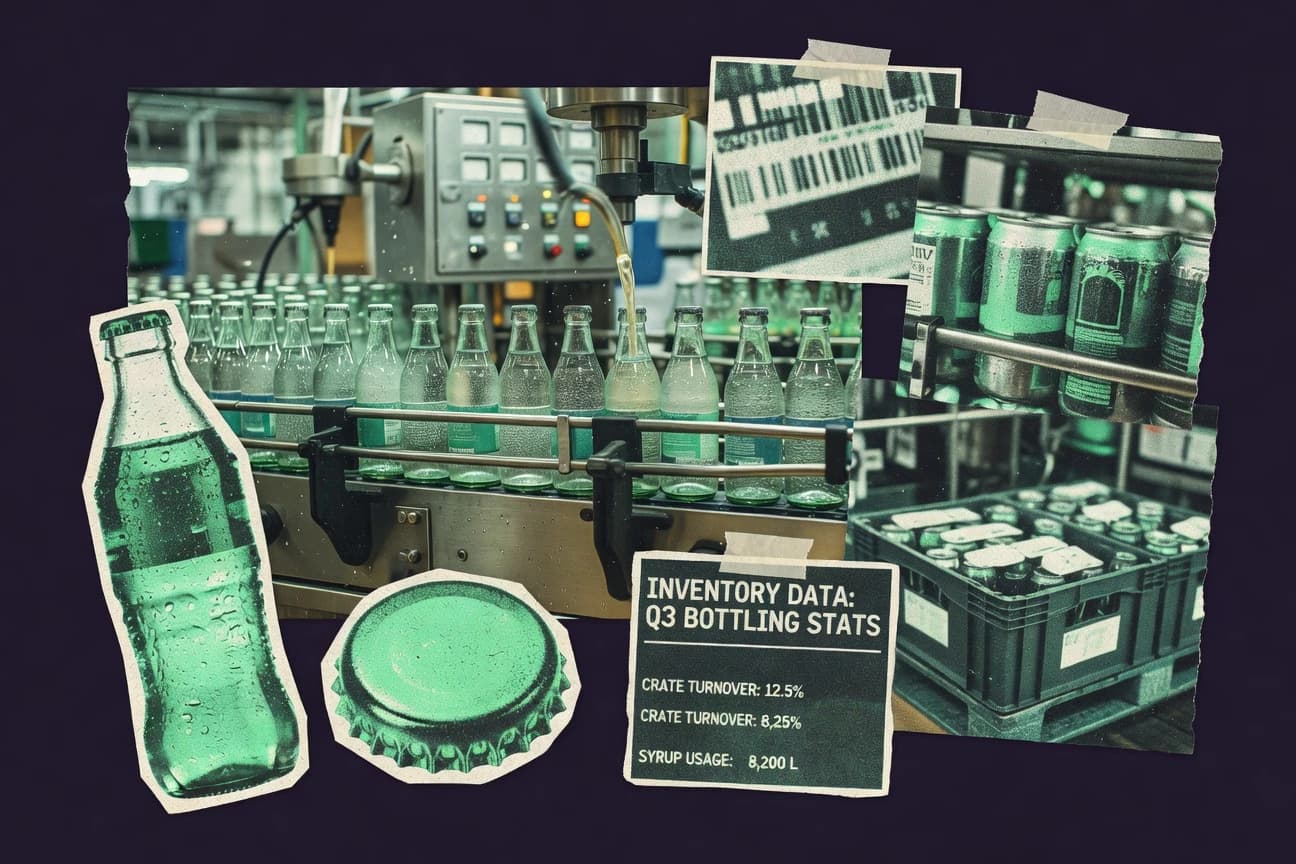
Soft Drink Industry Statistics
Carbonated soft drinks still dominate, with Coke at 19.2% U.S. share and a global volume of 31.4 billion unit cases from The Coca Cola Company in 2023, but the growth fight is clearly shifting to lower sugar and adjacent categories like energy, RTD tea, and bottled water, where the U.S. already hit 44.4 gallons per capita. Pair that with pressure points from sugar regulation and health risks, plus aggressive sustainability targets that are tightening packaging and water practices, and you get a snapshot of where soft drinks are headed next.
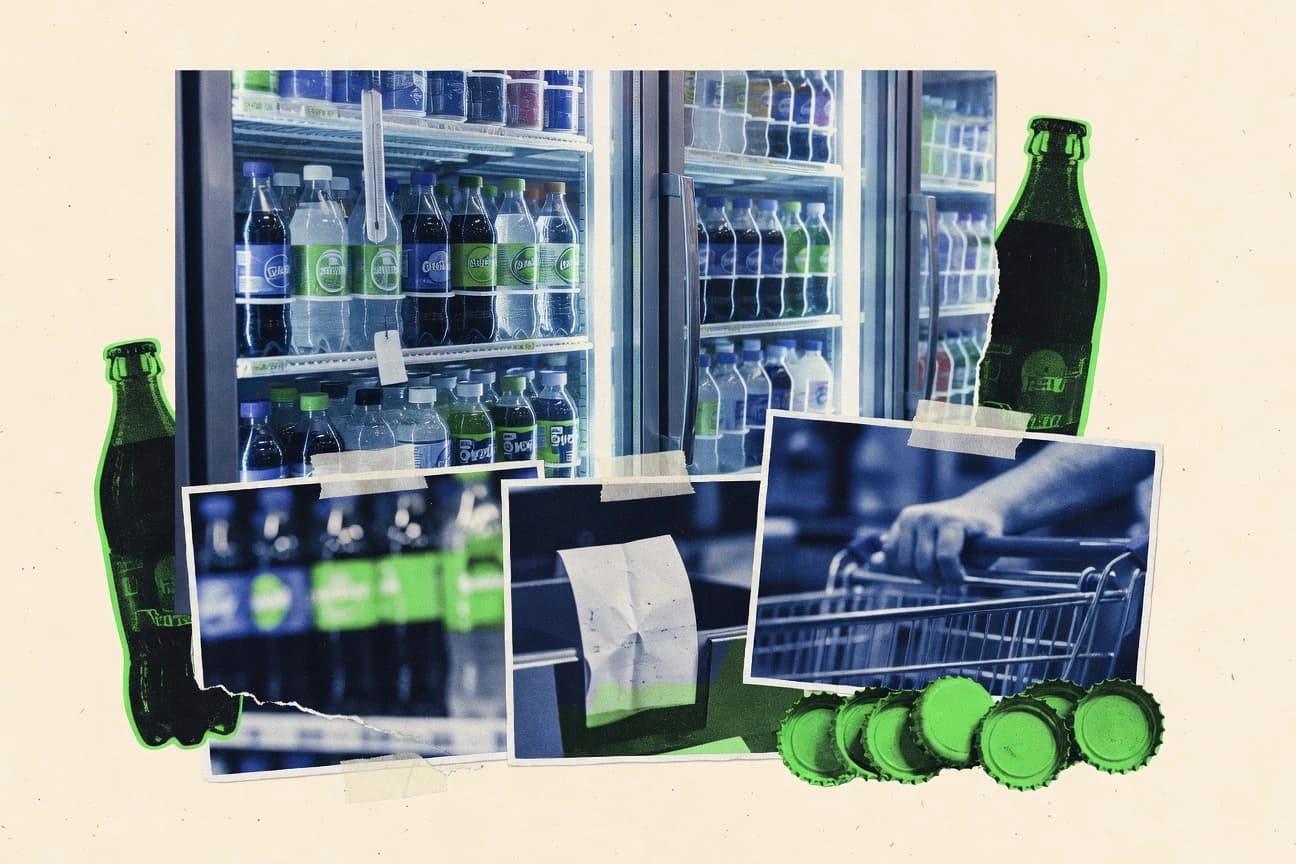
Soft Drink Sales Statistics
Global soft drink market revenue hit $614.3 billion in 2023, but the balance is shifting fast as energy drinks and premium sparkling keep gaining while key giants trade places. From Coke Classic’s 19.2% volume share to Dr Pepper surpassing Pepsi as #2 in US CSD sales at 8.3% in 2023, this page maps the brand moves, category rebounds, and regional swings behind what people actually reach for.