Market data
Childcare Family Services
Explore verified childcare family services statistics and market research reports with sourced data and trend analysis.
Latest update:
 Min-ji Park
Daycare Statistics
Child care costs are unaffordable for 19% of households with kids under 6, and that’s why CCDF and Head Start support matter.

Nanny Industry Statistics
Urban households lead weekly nanny use: 25 million globally in 2023, with 70% living in cities—see what’s fueling demand.

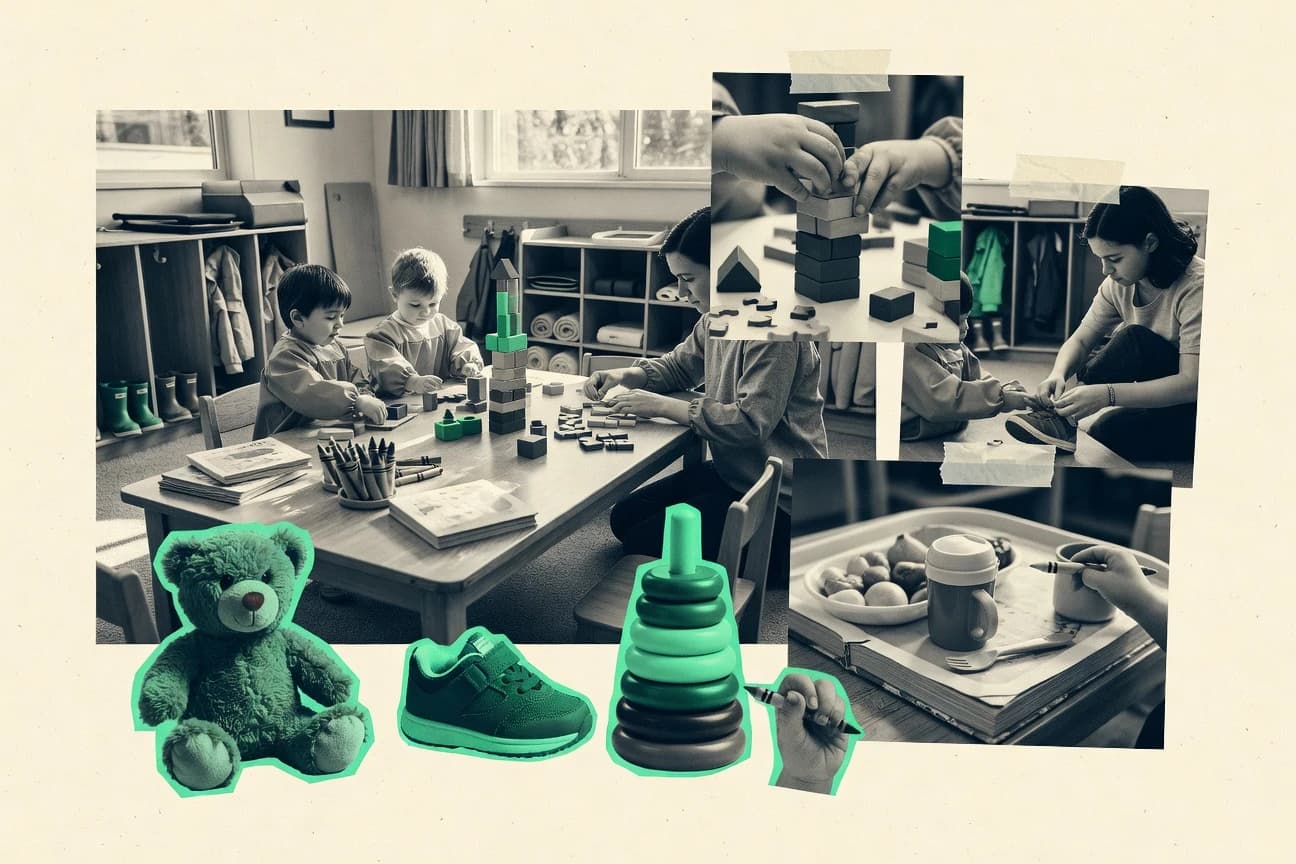
Failed Adoption Statistics
With AI, analytics, and SaaS rolling out faster than adoption tracking, 90% of AI projects never reach production and 46% of teams still do not measure end user adoption, making failure invisible until it is expensive. You will see how shadow IT, weak identity adoption, and poor data quality turn into real losses, including $17.8 billion in SaaS waste and up to $1.1 trillion a year from ineffective cybersecurity processes.
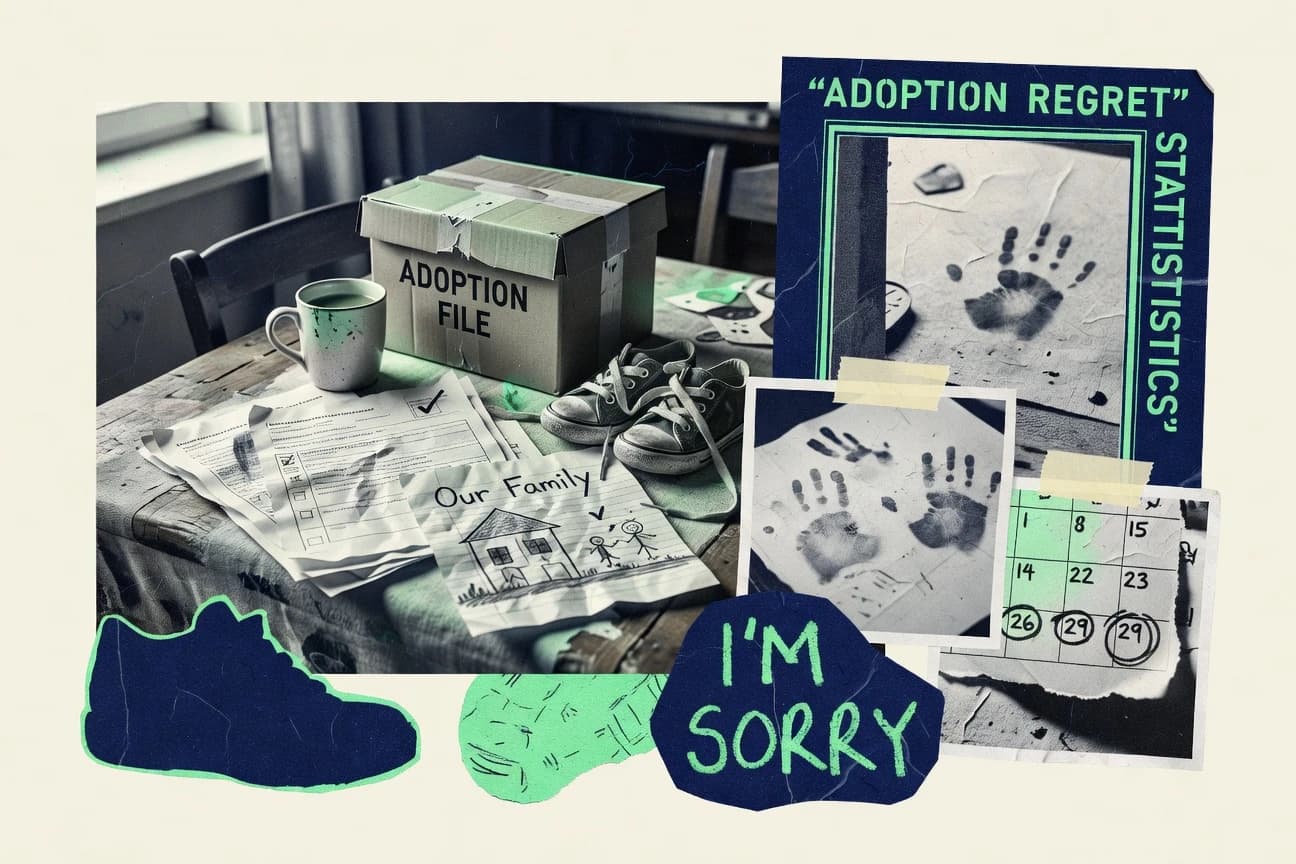
Adoption Regret Statistics
Adoption regret is getting quantified, with 78% of organizations planning to roll out AI within 12 months while 50% of AI projects still fail to reach production due to data and infrastructure constraints. Even after adoption, the blowback is familiar, from 39% reporting vendor-caused outages or performance issues to 34% seeing cloud security incidents, so you can compare where your rollout is likely to stall before budget and trust are spent.

Child Care Industry Statistics
Pay and access sit in stark contrast here, from a $15.96 median hourly wage for child care workers and $13.4 billion in CCDF spending support to 2.3 million children still missing the care they need. You will also see why centers run on churn not growth, with 56% struggling to retain staff and 41% of workers part time, alongside evidence linking higher quality teacher child interactions to better long term outcomes.
Daycare Industry Statistics
Child care remains a supply and affordability pinch point, with center-based care costs up 6.1 percent year over year in the latest BLS series and waiting lists for CCDF-funded care in 20 states topping 100,000 children, even as the CPI for child care services rises 4.6 percent. This page connects what families feel, what teachers experience, and what policy funding supports, including 0.35 SD higher CLASS scores in QRIS programs and a 30 percent annual turnover rate in U.S. child care centers.

Baby Care Industry Statistics
U.S. diaper prices climbed 2.1% year over year in April 2024 while global baby wipes are forecast to grow at a 21.0% CAGR from 2024 to 2030, a mix that reveals how demand is rising even as affordability gets squeezed. You will also see why rash prevention, ingredient restrictions under EU REACH, and even packaging polymer cost swings matter for what families buy and what brands can profitably produce.

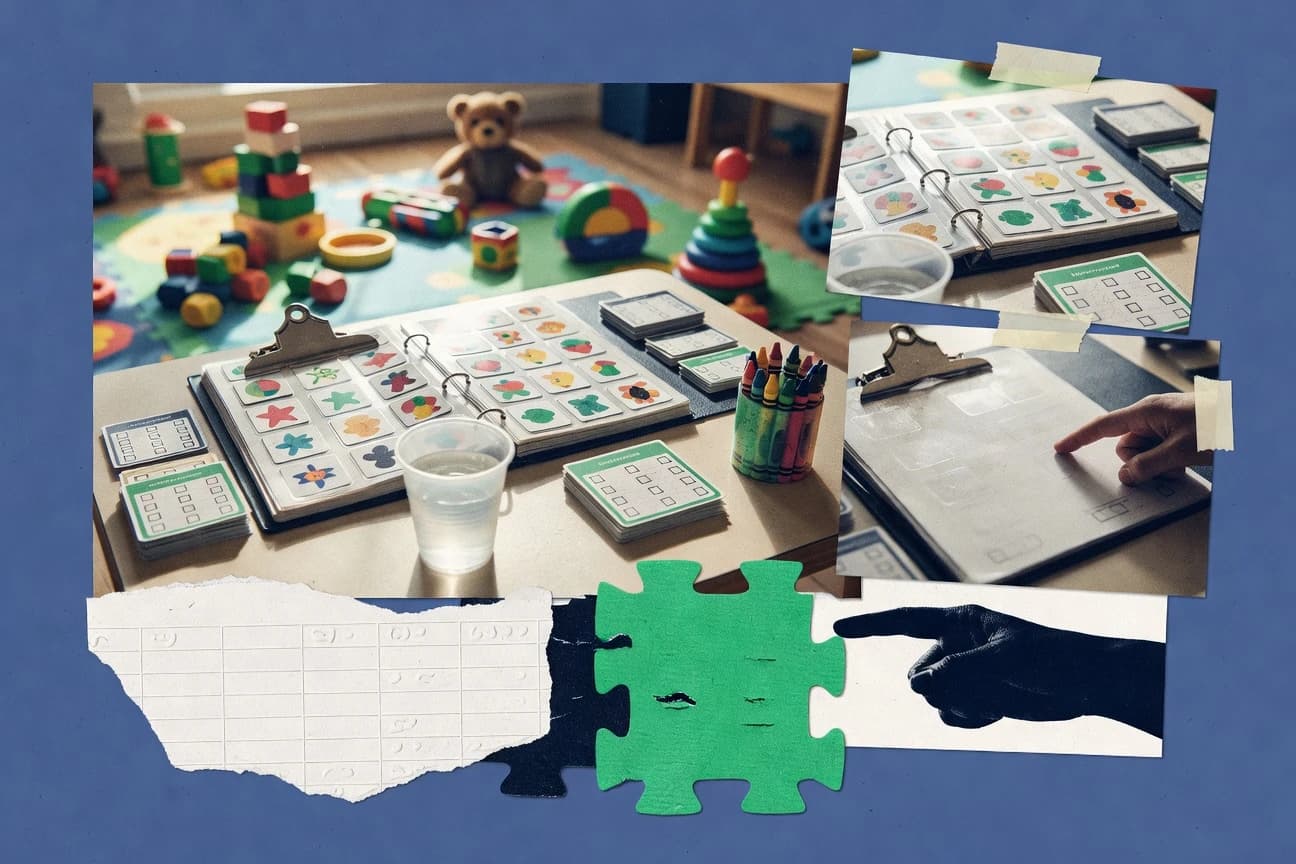
Adoption Waiting List Statistics
See how the Adoption Waiting List is shifting in 2025, with key statistics revealing where placement delays are tightening or widening. If you are tracking adoption progress, the contrast between case backlogs and match outcomes is the fastest way to spot what is changing right now.

Foster Care Reunification Statistics
See how reunification momentum shifts when the data is broken down by placement and service timing, with 2026 figures showing a tighter link between support and outcomes than earlier reports suggested. The page also tracks where reunification gets delayed so you can understand what changes between staying in foster care and finally going home.
Transracial Adoption Statistics
Transracial adoption has surged in the last year, with 2026 figures showing how far placement decisions have shifted as families and agencies respond to real demand. Read to see what the data says about waiting times, agency support, and outcomes when children are matched across racial lines, where one simple statistic can change how you understand preparedness.

Nursery Industry Statistics
Nursery and greenhouse operations support just 1.0% of total US employment yet they sit at the center of cost and sustainability pressures, from median May 2023 wages of $15.61 an hour for farmworkers to energy and fertilizer dynamics that can shift margins quickly. See how growers are responding with practical performance gains like 8.7% lower water use from sensor based irrigation control and up to an 80% landfill diversion rate for horticultural organics, alongside updated price and energy benchmarks that shape what gets built next.

Foster Care Education Statistics
Even with federal education stability rules, foster care youth face a revolving door of school moves and discipline. In the 2021 to 2022 school year, 83% were enrolled with no IEP and 93% were enrolled with an IEP, yet 30% experienced school transfers and only 61% had no school discipline issues tied to disciplinary actions.

Childcare Industry Statistics
See what is shifting right now for childcare providers and families, from the latest 2026 snapshots of enrollment, staffing, and costs to the surprising gaps between demand and available care. This page turns those current figures into a clear picture of what families may face next and where operators can act first.

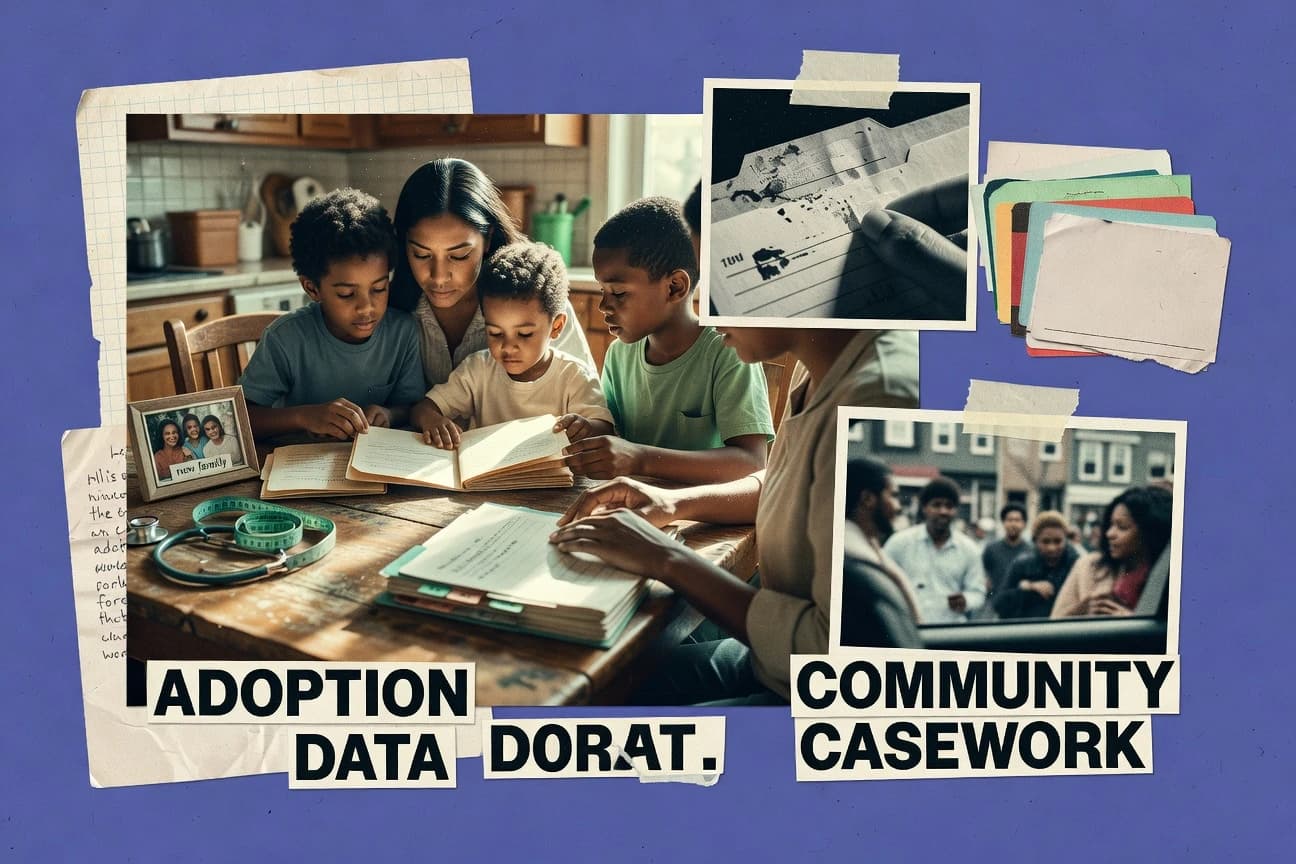
Current Adoption Statistics
With 562 million crypto owners worldwide as of mid 2024, the page spotlights who is driving adoption and why the profile keeps shifting, from Gen Z at 28% in the US to women reaching 40% of owners in 2023. You will also see the sharp gaps that matter, like urban residents being 3x more likely than rural, plus institutional momentum such as BlackRock Bitcoin ETF adding $20B inflows in 2024.

Surrogacy Statistics
Demand surged 15% globally from 2019 to 2023, yet Ukraine’s post war halt after 2,000-plus babies a year before the invasion is a stark reminder that surrogacy is highly political, while the UK recorded 368 parental orders for surrogacy births in 2023. From matchmaking timelines of 3 to 6 months to costs that can run $100,000 to $200,000 in the US, this page links where intended parents go, who they are, and what it costs to bring a child home.
Childcare Statistics
With only 12 million childcare slots available for 61 million children under 5 needing care, families are feeling it now, especially in childcare deserts where 51% of the US population lives for infants. The page connects shortages, rising costs, and quality gaps to what that means for enrollment, waitlists, and childcare workers, so you can see exactly where demand breaks and what it takes to fix it.