Market data
Agriculture Farming
Explore verified agriculture farming statistics and market research reports with sourced data and trend analysis.
Latest update:
 Leah Kessler
Vietnam Feed Industry Statistics
Aquafeed consumption hit 13.2 million tons in 2023—discover what’s driving shrimp and pangasius demand in Vietnam.
Oat Industry Statistics
Oat milk hit $2.1B globally in 2022—projected to reach $8B by 2030 as health demand rises. Explore the Oat Industry data.

Aquaculture Statistics
Shrimp aquaculture generated $40B in trade value in 2020—discover how this boom can also strain waterways and ecosystems, not just wallets.
U.S. Agriculture Statistics
In 2022, 2.90 million U.S. farm operators were reported—and 36% were women. Explore how the agriculture workforce shapes outcomes.
Poland Poultry Industry Statistics
Poland exports 1.1 million tons of poultry meat—how this massive trade flow supports jobs, investment, and prices. Latest industry stats.
Animal Feed Industry Statistics
Global R&D spend is $2B a year on sustainable feed ingredients—see which innovations are gaining traction across poultry, cattle, and swine.

Chicken Statistics
In 2022, global poultry feed reached $140B—supporting a chicken industry that produced 137M metric tons. Dive into the numbers behind demand.
Feed Industry Statistics
Fishmeal protein share in aquafeed fell to 10% in 2022 (from 20% in 2000)—see what’s driving ingredient shifts across animal feed.

Aquaculture Industry Statistics
With 218 million jobs worldwide, aquaculture is powering livelihoods—discover the 2020 figures behind its booming production, trade, and regional growth.
Chicken Industry Statistics
In 2022, U.S. exports reached 7.6 billion pounds and were worth $5.1 billion—see how global demand shapes the chicken industry.

Japan Dairy Industry Statistics
Per-person fresh milk fell to 31.2 kg in 2022 (down 0.5% YoY) while Japan’s dairy market reached 2.95 trillion JPY—discover the shift.
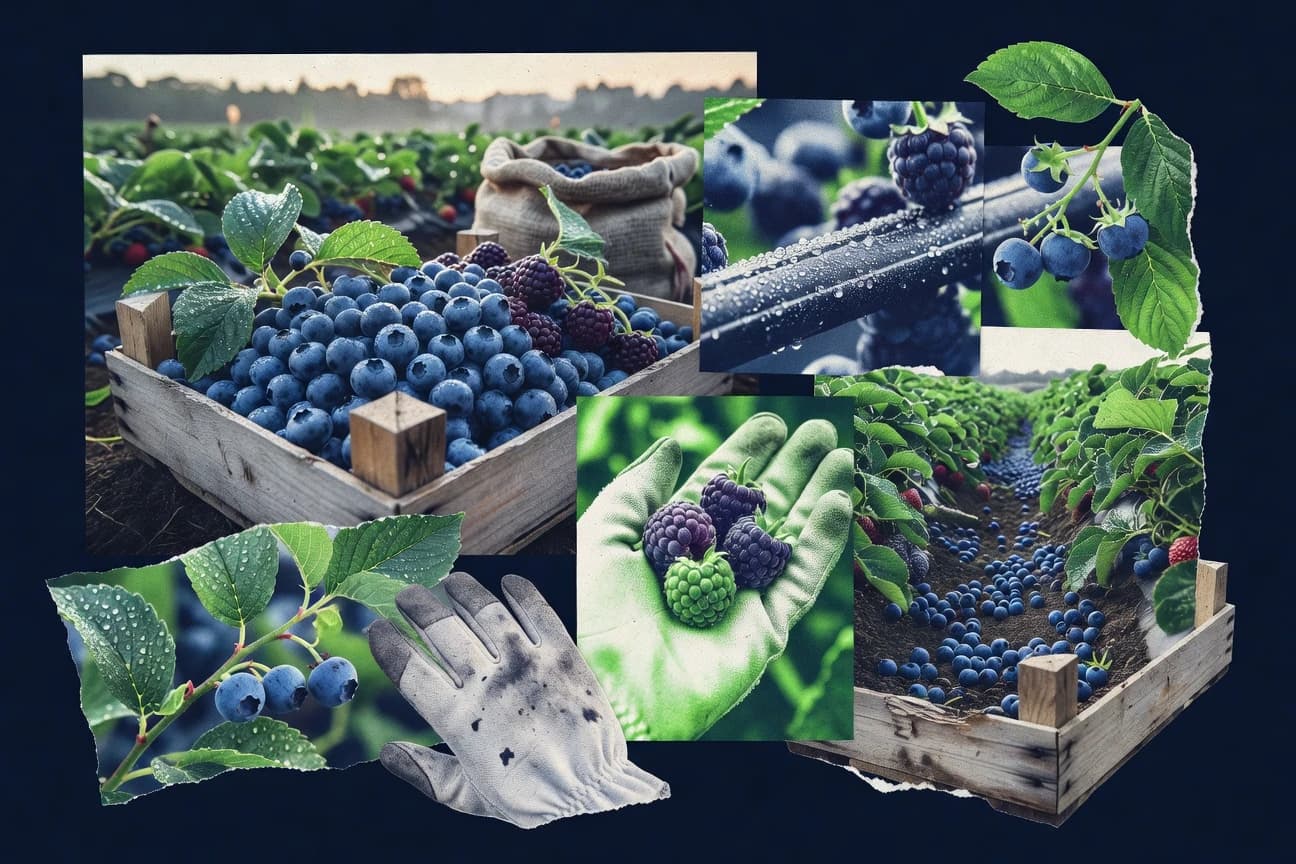
Berries Industry Statistics
Global berry spending tops $98.2B in 2023 yet hits $128.9B by 2030—see the stats shaping the berries industry.
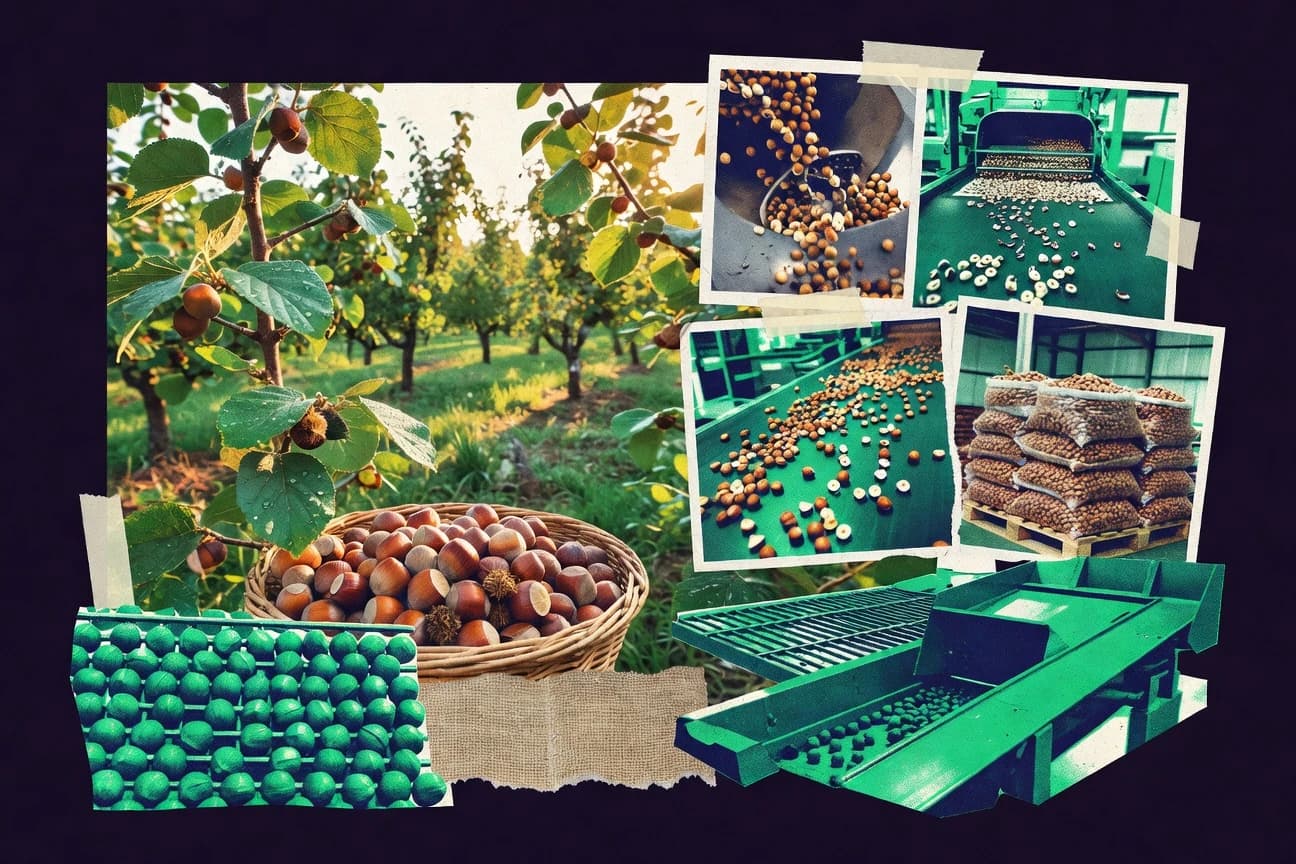
Hazelnut Industry Statistics
Turkey grows 67% of the world hazelnuts, yet global prices average $4.50/kg—see the key numbers shaping today’s hazelnut industry.
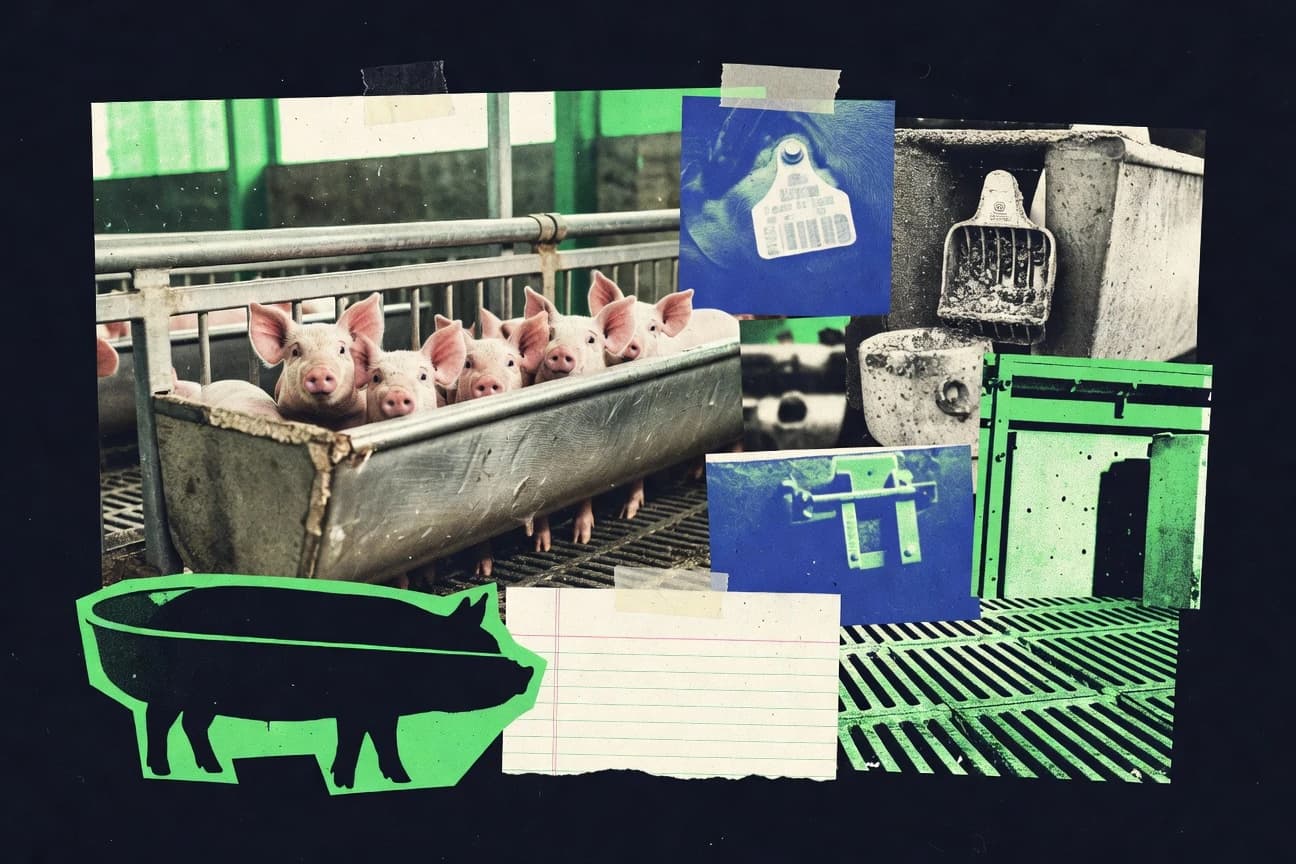
Pig Industry Statistics
ASF has cost the global pork industry $50B since 2018–2022—see the latest figures on demand, trade, and production risks.

Russia Dairy Industry Statistics
Cheese production rose 5.4% in 2022 to 650,000 tons—discover what’s driving Russia’s dairy shift in 2023.
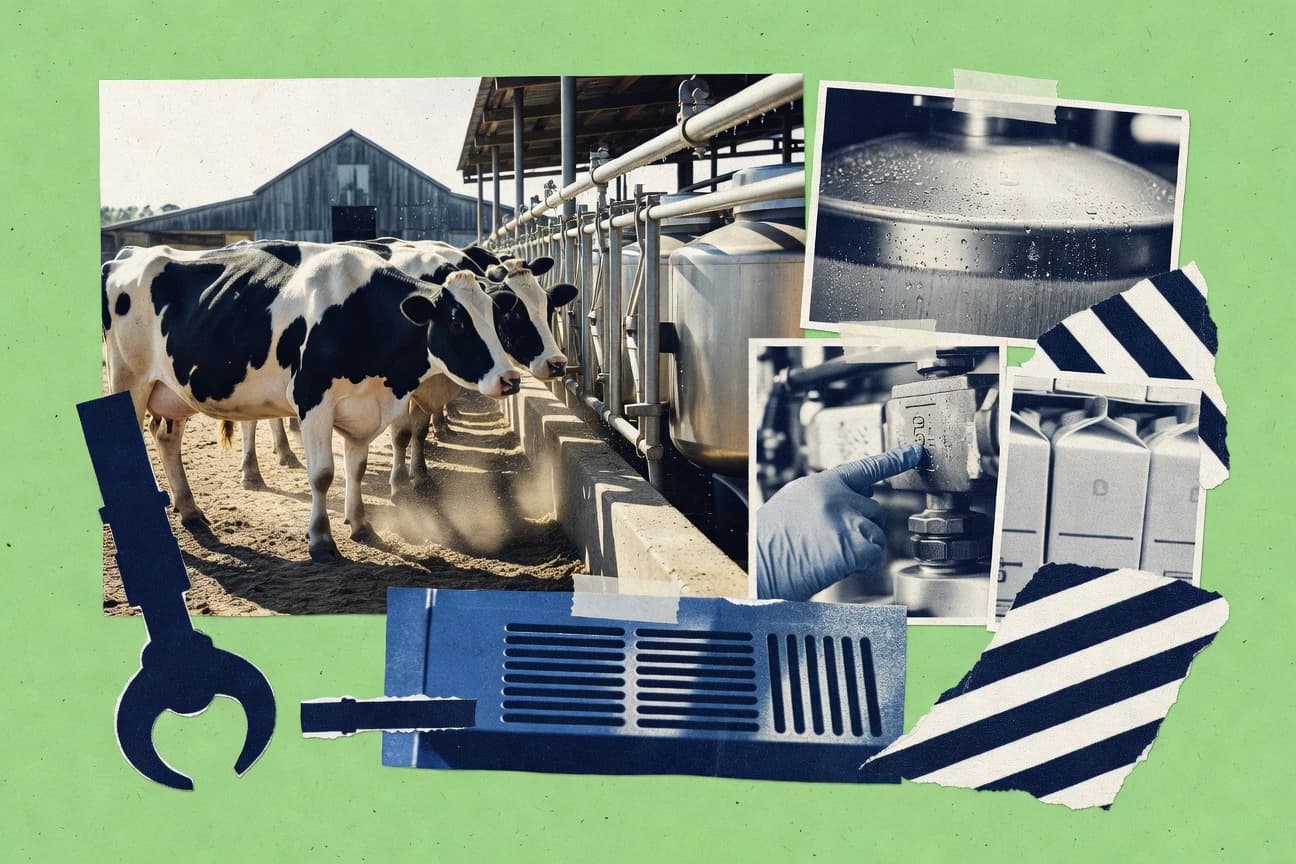
Canada Dairy Industry Statistics
With dairy farming cash receipts hitting $8.2B in 2022 (up 6.5%), Canada’s sector is more resilient than you think. See the stats.
Peach Industry Statistics
US per capita peach consumption fell to 3.2 lb in 2022—down from 3.5 in 2021—while fresh peaches still dominate at 65%.

Japan Pork Industry Statistics

Animal Nutrition Industry Statistics
Probiotics use in poultry feed jumped 12% to 1.2M tons in 2023—see what’s driving adoption across animal nutrition.