GITNUX MARKETDATA
Browse Our Category
Agriculture Farming
Latest update:


Duck Industry Statistics
Duck Industry’s latest figures show how production and demand are reshaping the market right now, with a 2026 snapshot that highlights where volume is rising and where margins are getting squeezed. If you want to understand what these shifts mean for buyers and producers, this is the page that turns the dashboard into decisions.
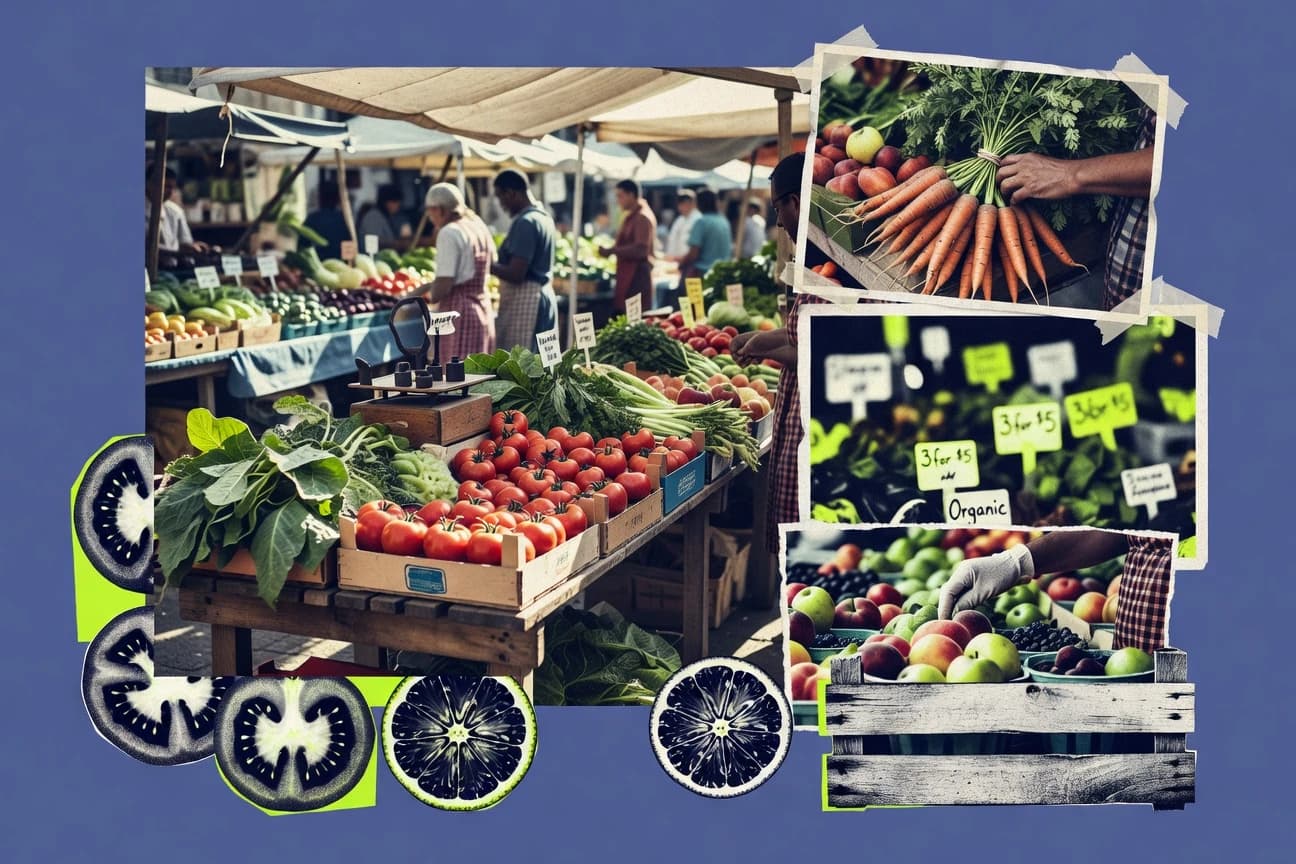
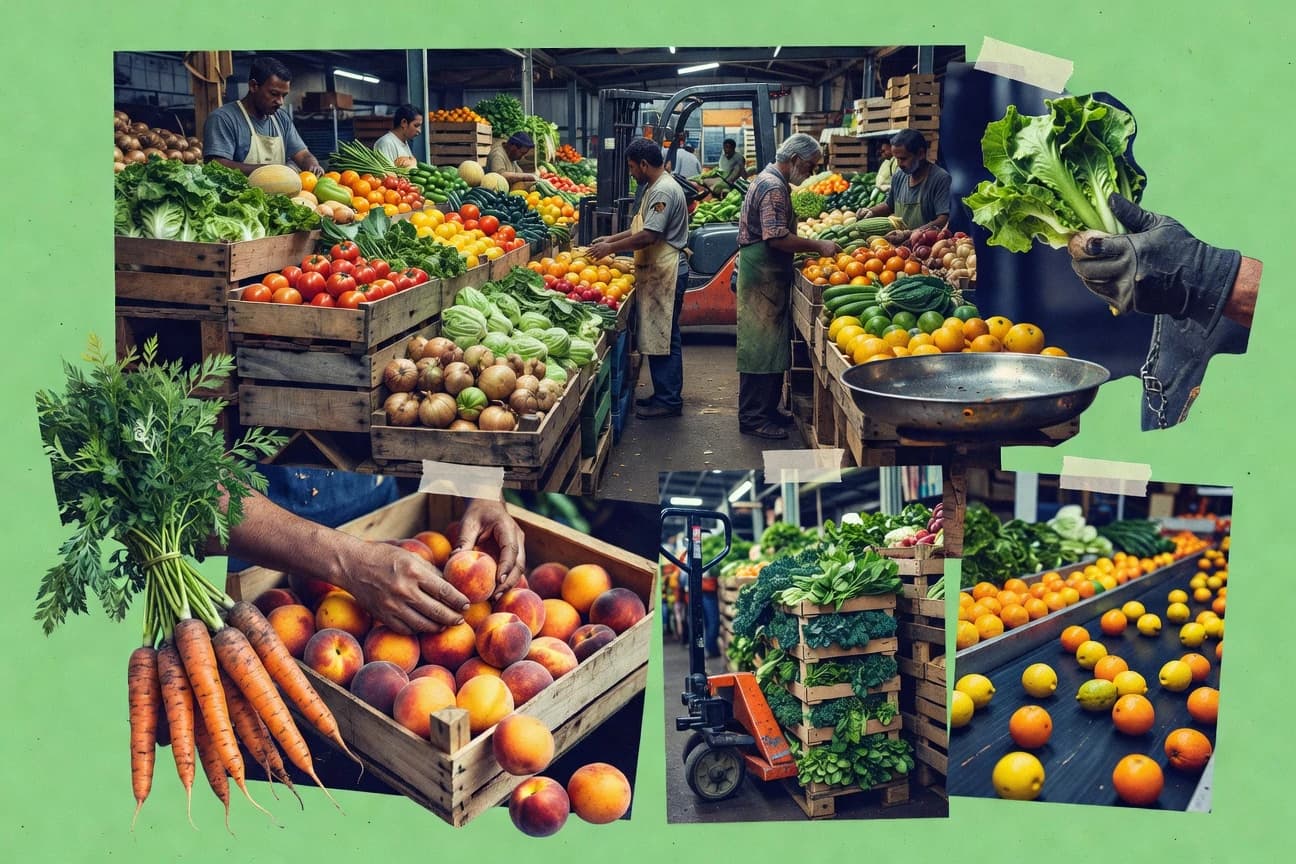
Farmers Market Statistics
Fresh figures from the latest Farmers Market reporting reveal how much participation has shifted and which produce categories are pulling the most attention right now. You will see the gap between vendor presence and what shoppers actually buy, plus the 2026 signals that are already reshaping what stalls should stock.

Palm Oil Statistics
Palm oil still drives the biggest slice of global vegetable oil demand with a 37.0% share in 2022, but the climate and impact range is what makes the page truly consequential, from LCA estimates near 30 gCO2e per MJ to well over 200 gCO2e per MJ depending on land use change. You will also see how production scale and regulation collide, with EU RED II pushing 100% sustainability documentation in compliant schemes while mill efficiencies, EFB energy substitution potential, and biodiversity signals quantify the tradeoffs behind every policy and plantation decision.

Portugal Cork Industry Statistics
Portugal Cork Industry 2026 figures put precision behind what many assume about the sector, with output and trade moving in real, measurable ways that do not always match the headlines. If you want to understand where demand is tightening or easing and what that means for producers in Portugal right now, these statistics are the quickest way to see it.
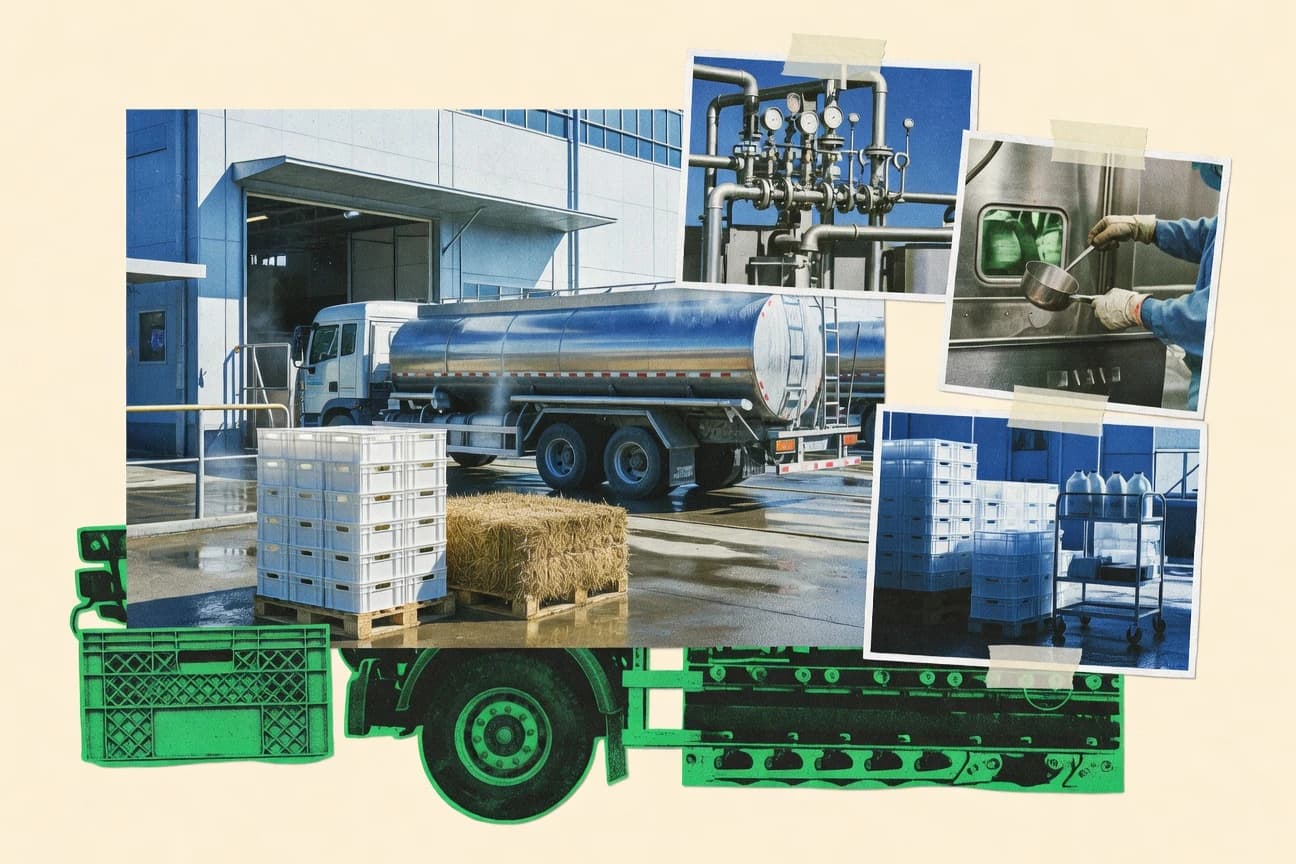
China Dairy Industry Statistics
See how China’s dairy industry is reshaping itself, with fresh 2026 figures highlighting what’s changing in output, trade, and market pressure at the production level. If you think the sector is still driven by the same old dynamics, these up to date statistics are the quick reality check.

Colombia Flower Industry Statistics
Colombia’s flower industry is heading into 2025 and the page pulls the clearest signals on where demand and production are tightening or accelerating, down to the figures buyers actually feel. See how the most current metrics line up against earlier swings, so you can separate steady growth from short term noise.
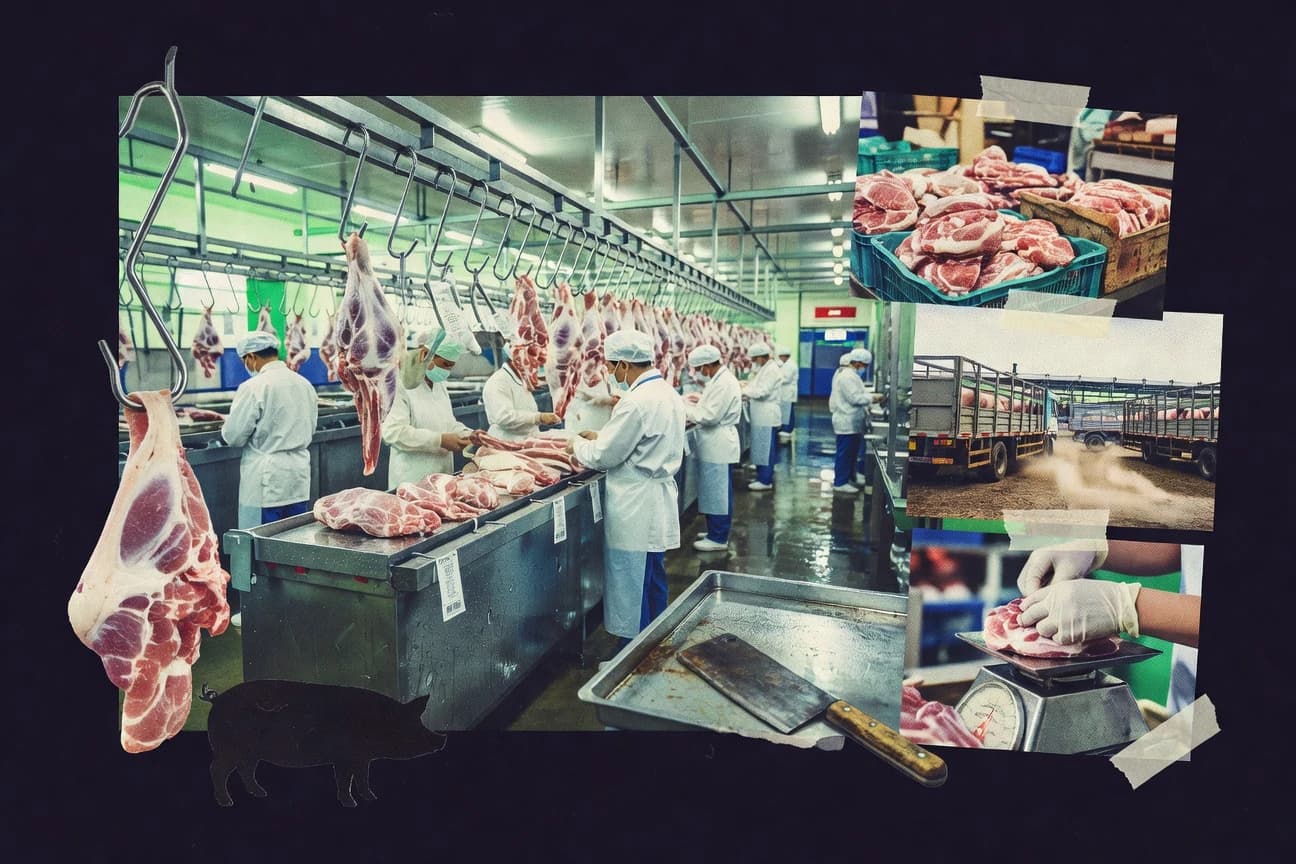
China Meat Industry Statistics
China’s pork and feed cost picture in 2025 is stark, with pork retail prices up 25.6% year on year in April 2024 as wholesale prices fell 6.1% year on year in June 2024, setting up a real squeeze between farm economics and what shoppers pay. Use these China Meat Industry statistics to connect the full chain, from 54.8 million tonnes of pigmeat production in 2023 and 45% integrated pork output to import dependency of about 15% and detailed cold chain and processing benchmarks.
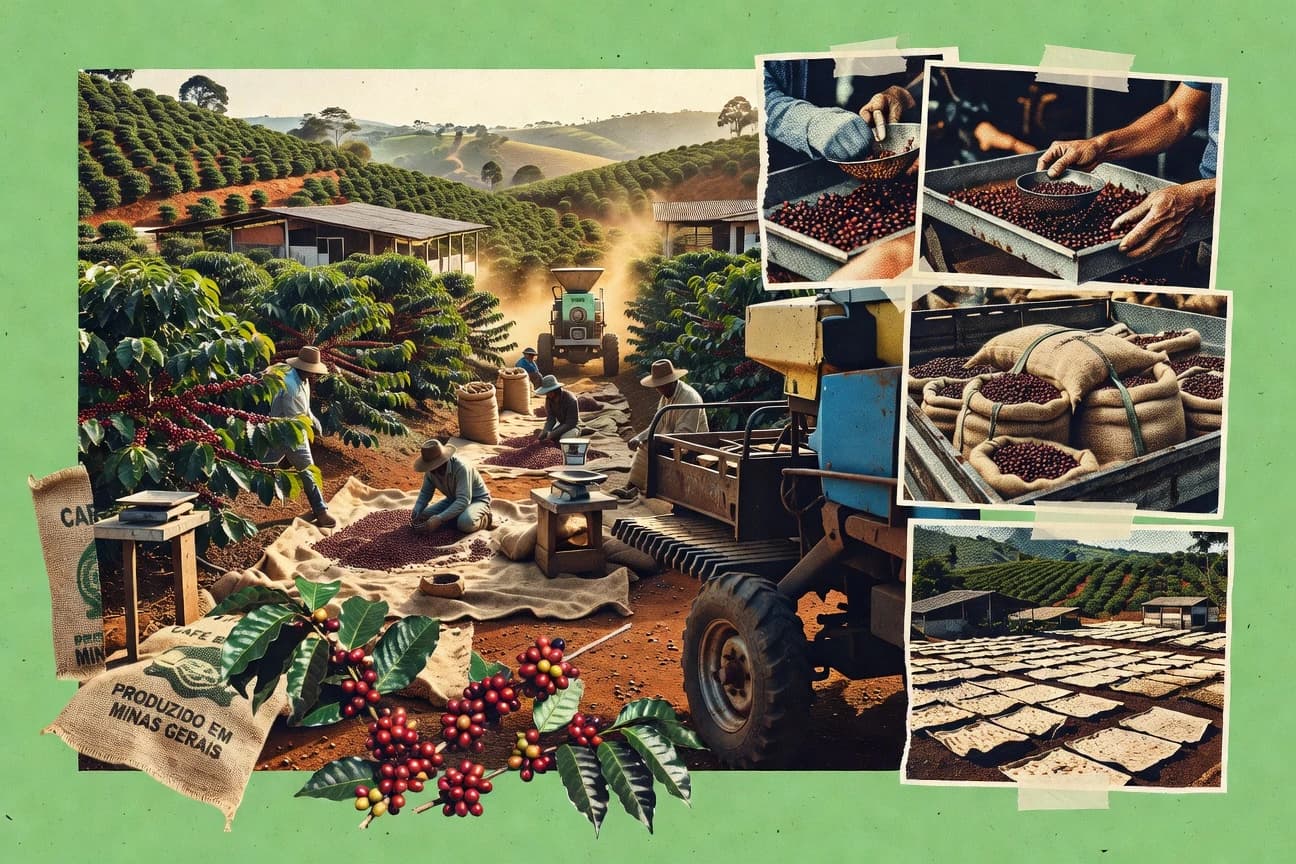
Brazil Coffee Production Statistics
Brazil sends a remarkably small 2.5% of its coffee export value to the United States, while major European markets take far bigger shares, with Belgium at 14.6% and Switzerland at 17.8% in 2022 data. The contrast across destinations like Turkey at 7.1% and the UK at 21.4% makes it a sharp way to understand where Brazilian coffee demand is concentrating.
Produce Industry Statistics
Precision agriculture, vertical farming, and tracking are reshaping how produce is grown and moved, with the global precision agriculture market forecast to reach $12.0 billion by 2030 and produce traceability projected to climb to $16.6 billion by 2030. At the same time, the numbers behind waste and cold chain pressure stay stark, with 40% to 50% of food loss happening between harvest and retail and refrigerated transport contributing about 3% of food system emissions.
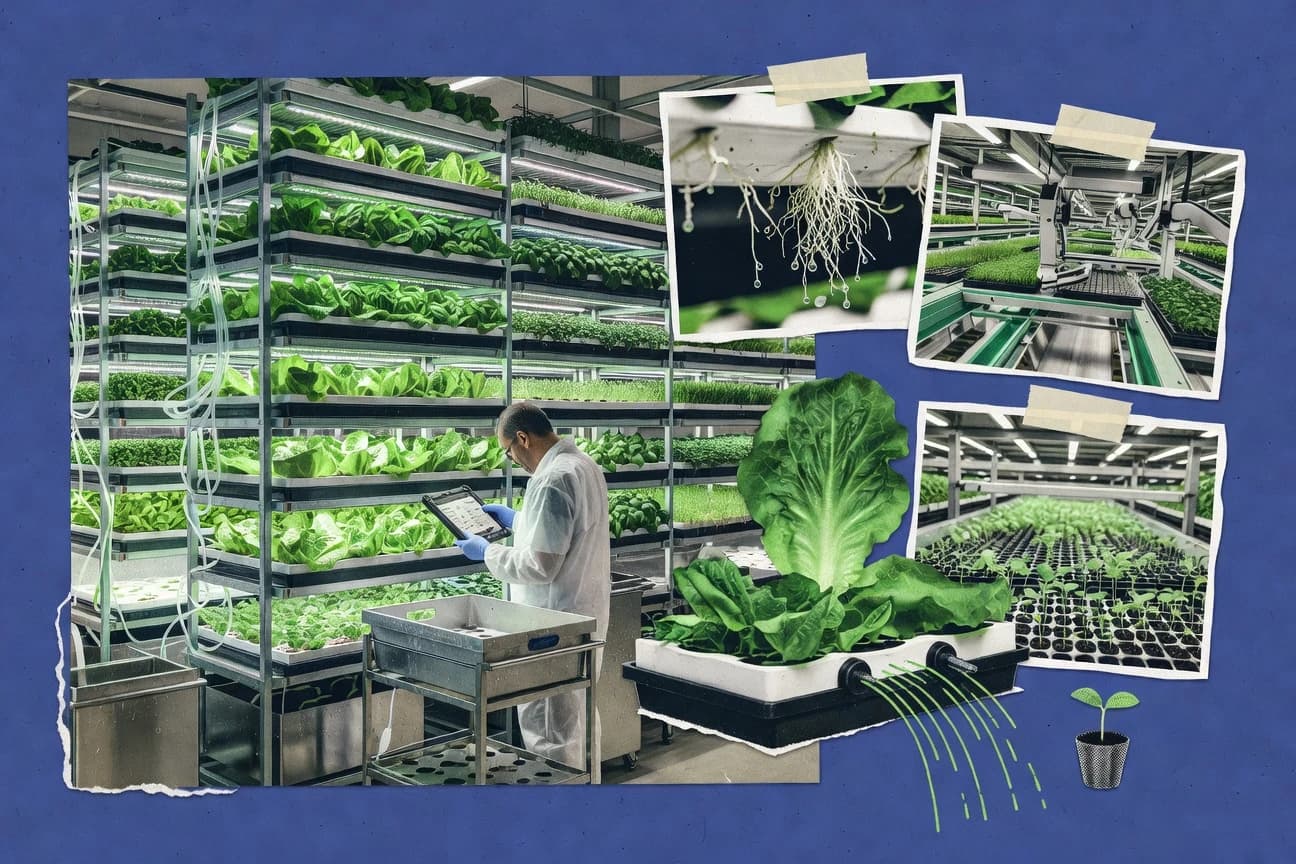
Vertical Farming Industry Statistics
When 56% of the world already lives in cities, vertical farming stops being a niche idea and starts looking like the practical answer to pressure points like 70% of freshwater withdrawals used for agriculture, 33% food lost or wasted, and 18 to 25% of global greenhouse gas emissions tied to AFOLU. This page connects those constraints to the momentum behind controlled environment agriculture, including the global vertical farming market projected to reach about $12.7 billion by 2030 and the health and resource gains claimed by hydroponic and LED stack systems, where electricity becomes the make or break cost lever.
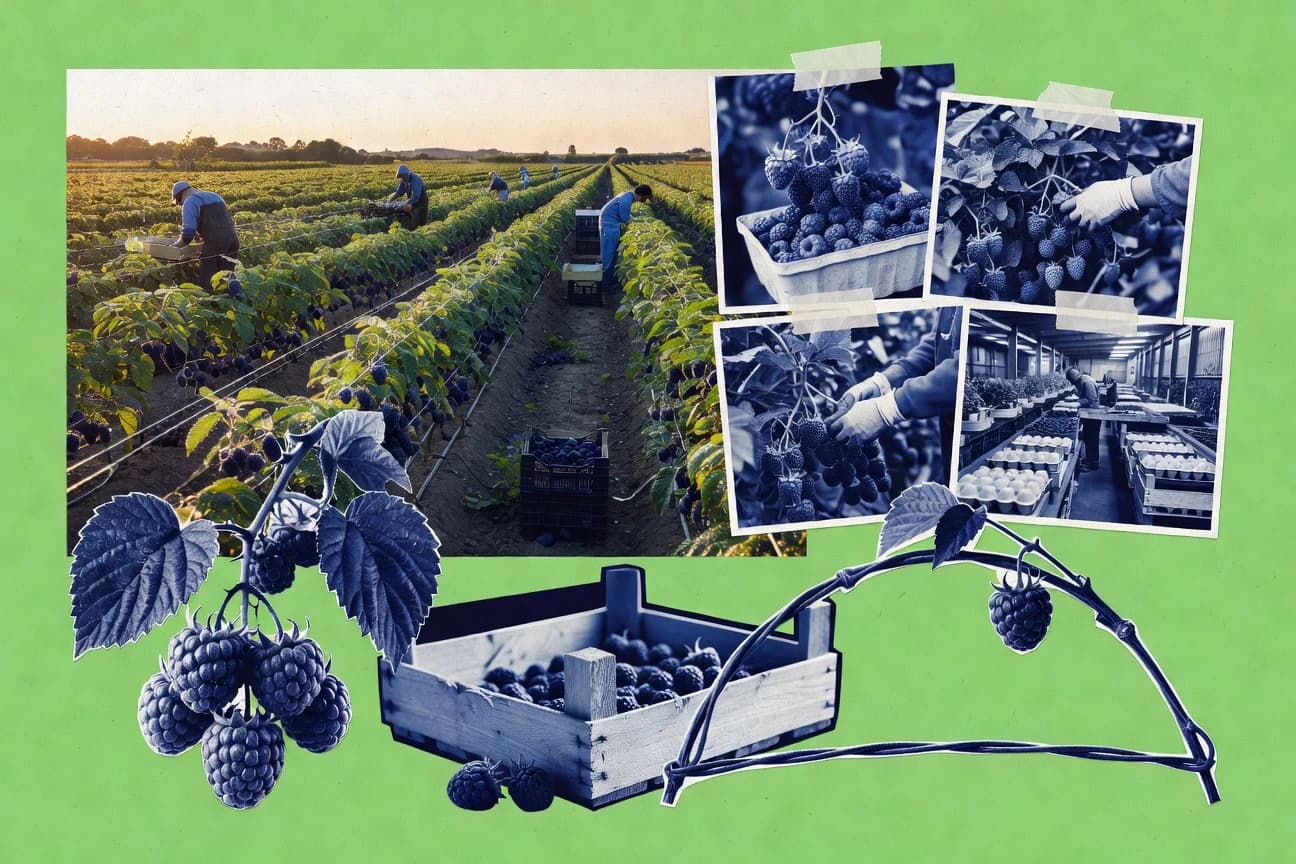
Raspberry Industry Statistics
Raspberry shipments and adoption have surged to 15.7 million units in 2022 while Raspberry Pi OS keeps rolling out at over 10 million downloads a month, setting the scale for why this hardware keeps showing up everywhere from classrooms to maker benches. Then the specs get just as revealing, from Pi 5’s NVMe boot path and dual 4Kp60 outputs to the tight power and connectivity contrasts across the lineup.
Argentina Agriculture Statistics
Argentina’s agriculture is still a GDP anchor, bringing in 6.2% of national output in 2022 while agriculture, forestry, and fishing made up 19.6% of total value added. Yet the page juxtaposes that scale with a 2.3% annual contraction in 2022 alongside a +27.0 billion agricultural trade surplus, showing how yields, land use, irrigation, and export taxes translate into momentum despite pressure on farm value.
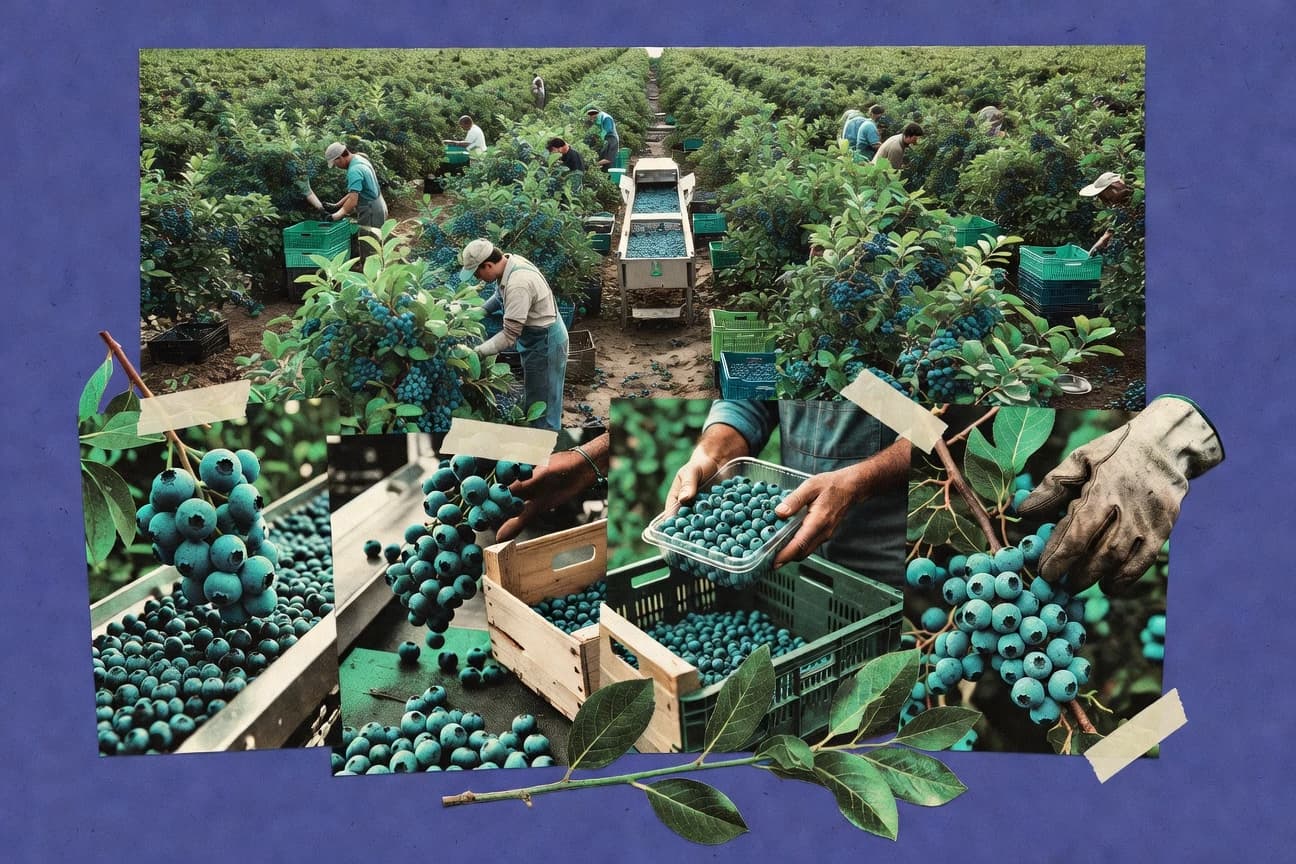
Blueberry Industry Statistics
With global blueberry output at 2.7 million acres harvested worldwide in 2022 and the market now reaching $9.6 billion in 2023 fresh and frozen, the page pulls the biggest growers, top importers, and trade flows into one clear view. Then it contrasts how postharvest choices and cooling timelines can swing shelf life by days, while recent pricing and labor inputs help explain why berries worth billions still depend on the cold chain.
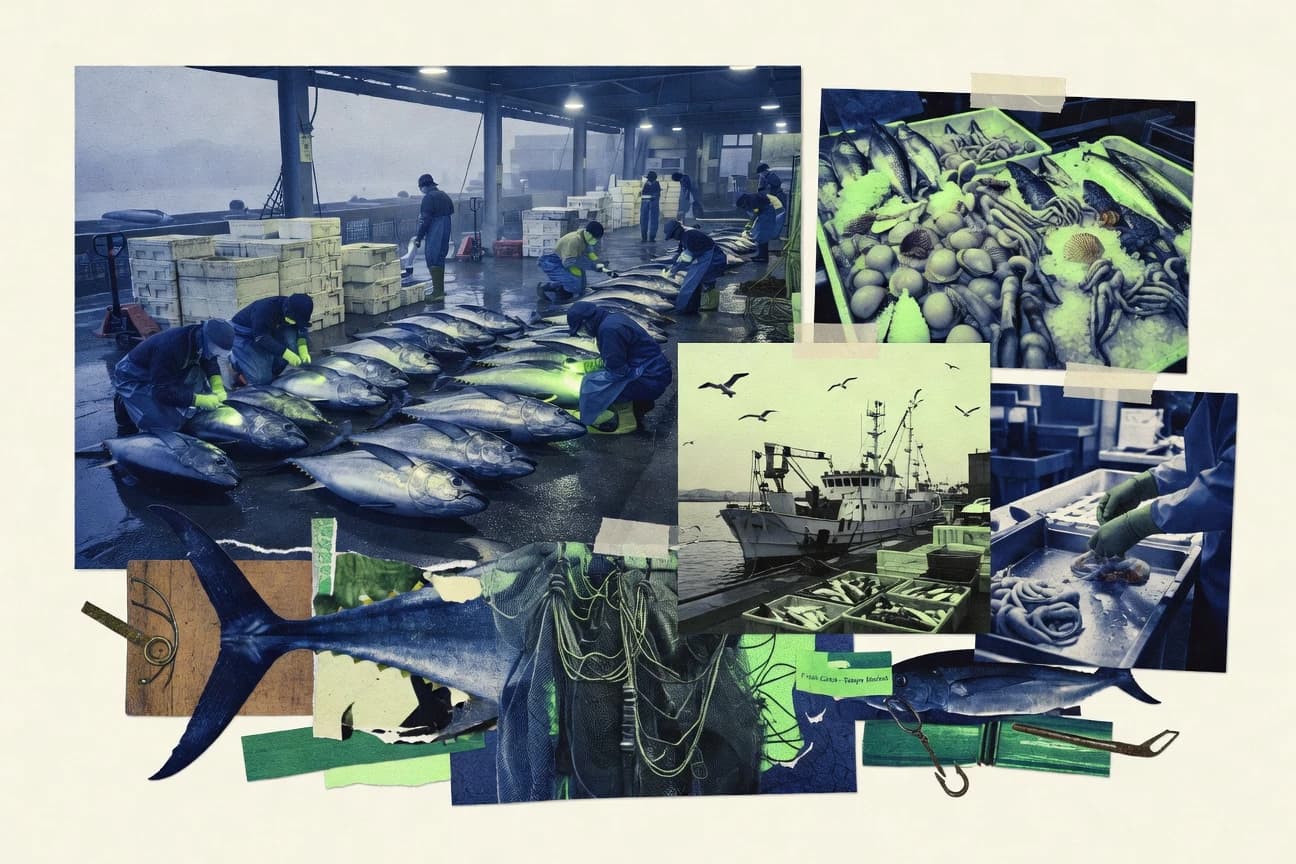
Japan Seafood Industry Statistics
Japan’s fishery production value rose 4.8% year on year and topped JPY 4 trillion in 2022 while the labor force is aging with 50.3% aged 60 plus, a sharp reminder that today’s supply depends on tomorrow’s capacity. Follow how coastal fisheries hold 39.3% of value and aquaculture adds 21.7% alongside trade pressures like USD 7.9 billion in imports and USD 5.8 billion in exports.
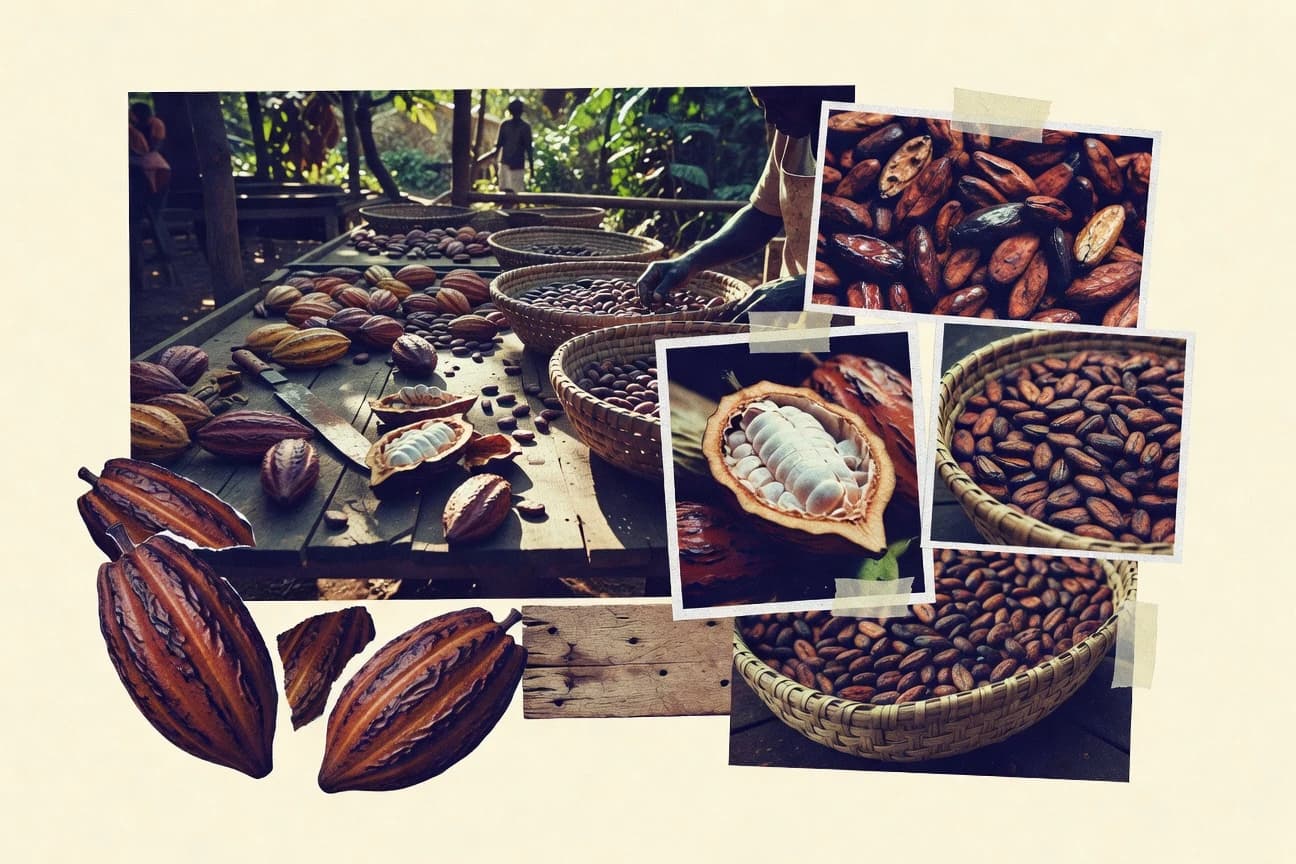
Cocoa Industry Statistics
Cocoa tightness eased to about a 1.6 month stocks-to-grindings ratio in 2022/23, yet prices still whipsawed and EU rules from 2024 keep tightening the compliance and packaging pressure. You will find the cost and quality bottlenecks behind chocolate demand, from shell waste and fermentation noncompliance to a 0.7% downgrade rate, plus farm gate price moves in Côte d’Ivoire and Ghana that help explain why yields and standards matter.
Agricultural Industry Statistics
Food systems are under pressure from both markets and climate, with agriculture responsible for 11% of global greenhouse gas emissions and tariffs averaging 15% on farm products compared with 4% for industrial goods. Track trade, costs, and supply risks across everything from the $1.8 trillion global food export value in 2021 to the $30 billion plus annual agricultural insurance premiums and the 33% EU budget share tied to the CAP.

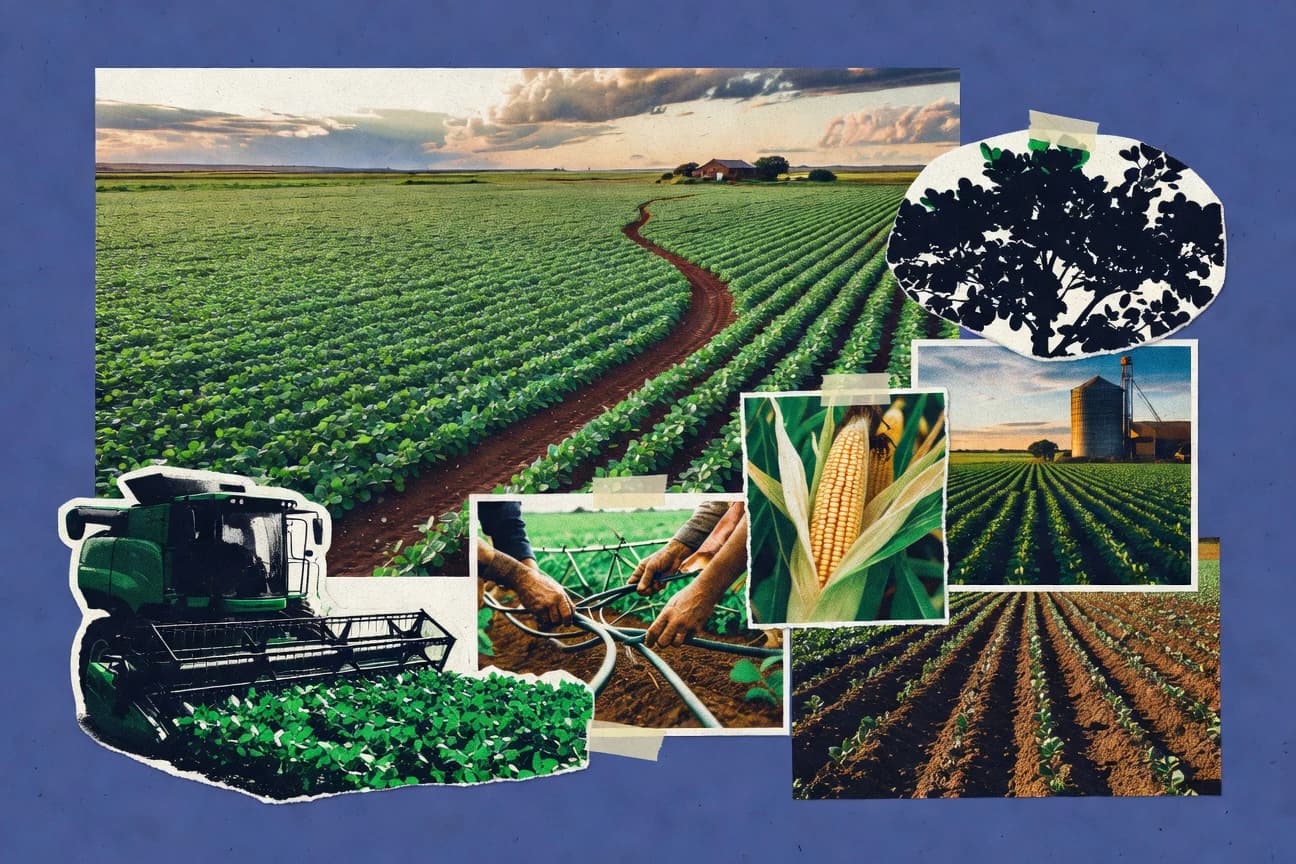
Us Agriculture Industry Statistics
U.S. farmers generated 15.3 billion bushels of corn and 4.16 billion bushels of soybeans in 2023 alongside 12.1 million 480-lb cotton bales and 203.5 billion dollars of farm output for GDP, highlighting how much production volume and economic value move together. Then look past the fields to what sustains the system with 10.4% of total U.S. employment, record 196 billion dollars in agricultural exports in fiscal 2022, and precision agriculture now on about 50% of corn and soybean acres, where efficiency pressures meet climate and cost realities.

Fishing Industry Statistics
Fishing and aquaculture move massive sums and jobs, with global fish trade hitting $164 billion in 2020 and total employment reaching 59.5 million people that same year, yet the pressure on stocks is unmistakable with 35% of global stocks fished at unsustainable levels in 2020 and bycatch taking about 10% of annual catch. This page puts those economic wins and environmental tradeoffs side by side, so you can see why markets keep expanding while sustainability indicators lag.
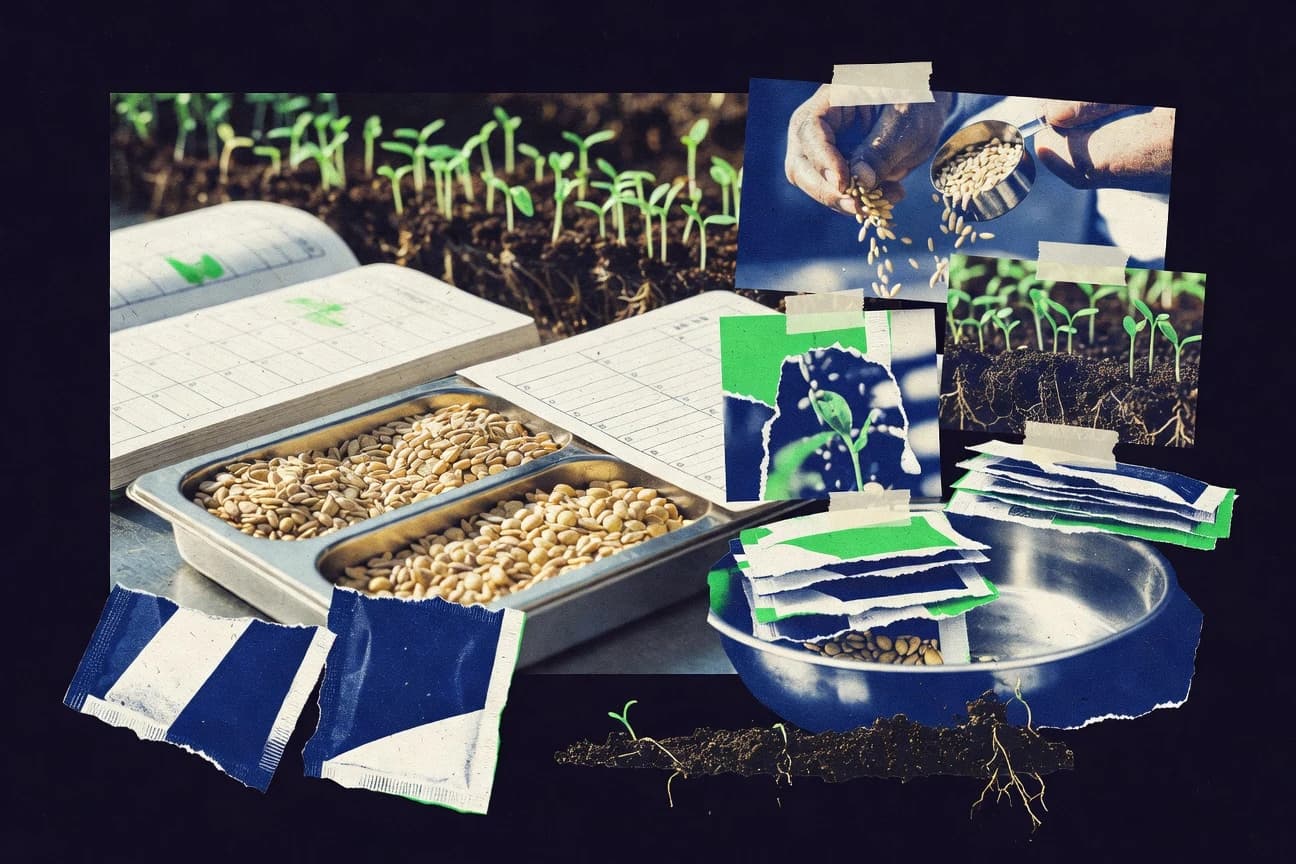
Seed Industry Statistics
Global seed market value is set to jump from USD 62.74 billion in 2023 to USD 99.05 billion by 2030, driven by a 6.8% CAGR, while the balance of power stays tight among top breeders like Bayer at 24% share and Corteva’s USD 8.5 billion seed revenue. See how market concentration, regional trade shifts, and fast moving biotech adoption are reshaping what farmers actually get, and who captures the next growth wave.
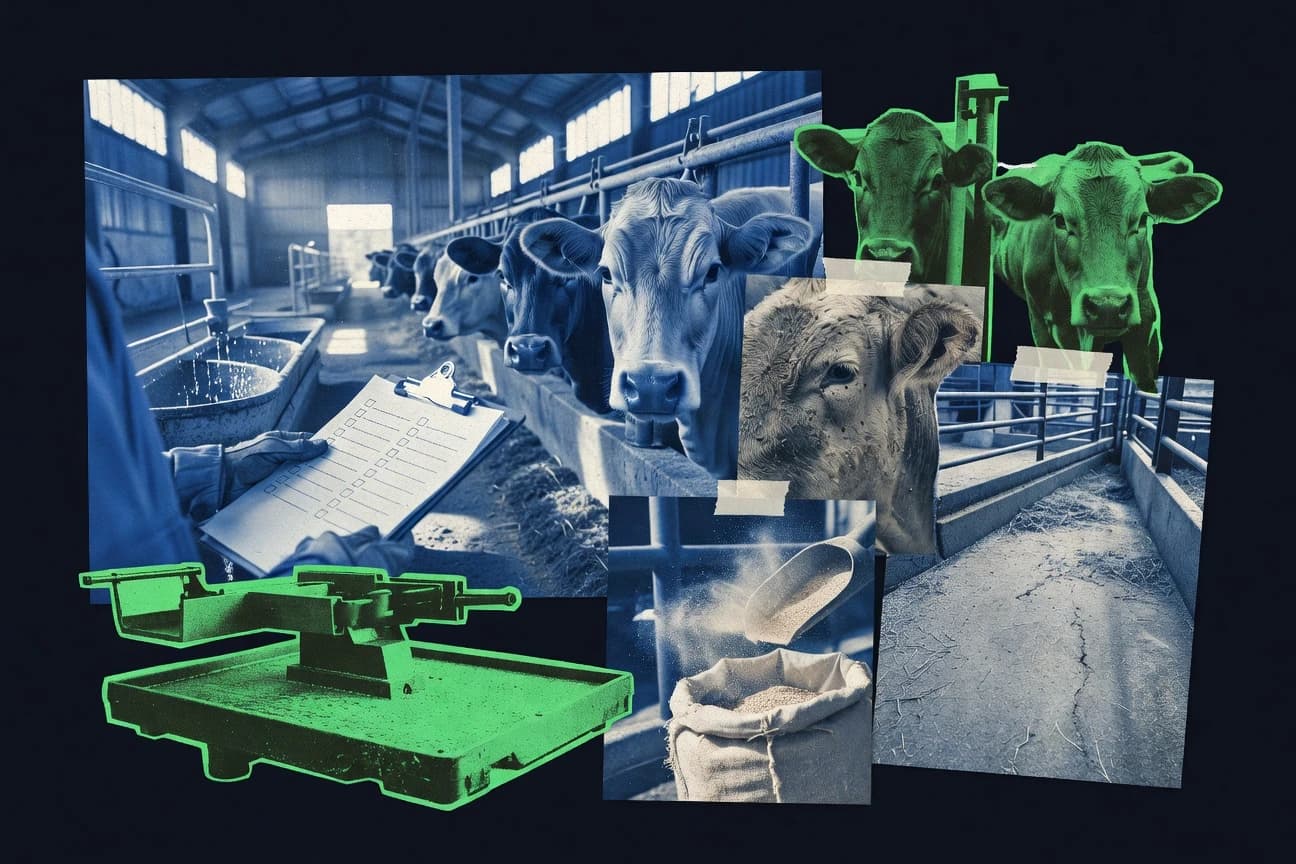
Livestock Industry Statistics
Antibiotics and emerging zoonotic threats are tightly linked to livestock, with over 70% of globally produced antibiotics used in animal systems and 60% of human infectious diseases traced to animal origins. At the same time, industrial scale and animal health collide with welfare and climate realities, from 70 billion land animals slaughtered yearly to livestock accounting for 14.5% of human induced greenhouse gases, making this page essential for anyone tracking food, health, and sustainability together.