GITNUX MARKETDATA
Browse Our Category
Agriculture Farming
Latest update:

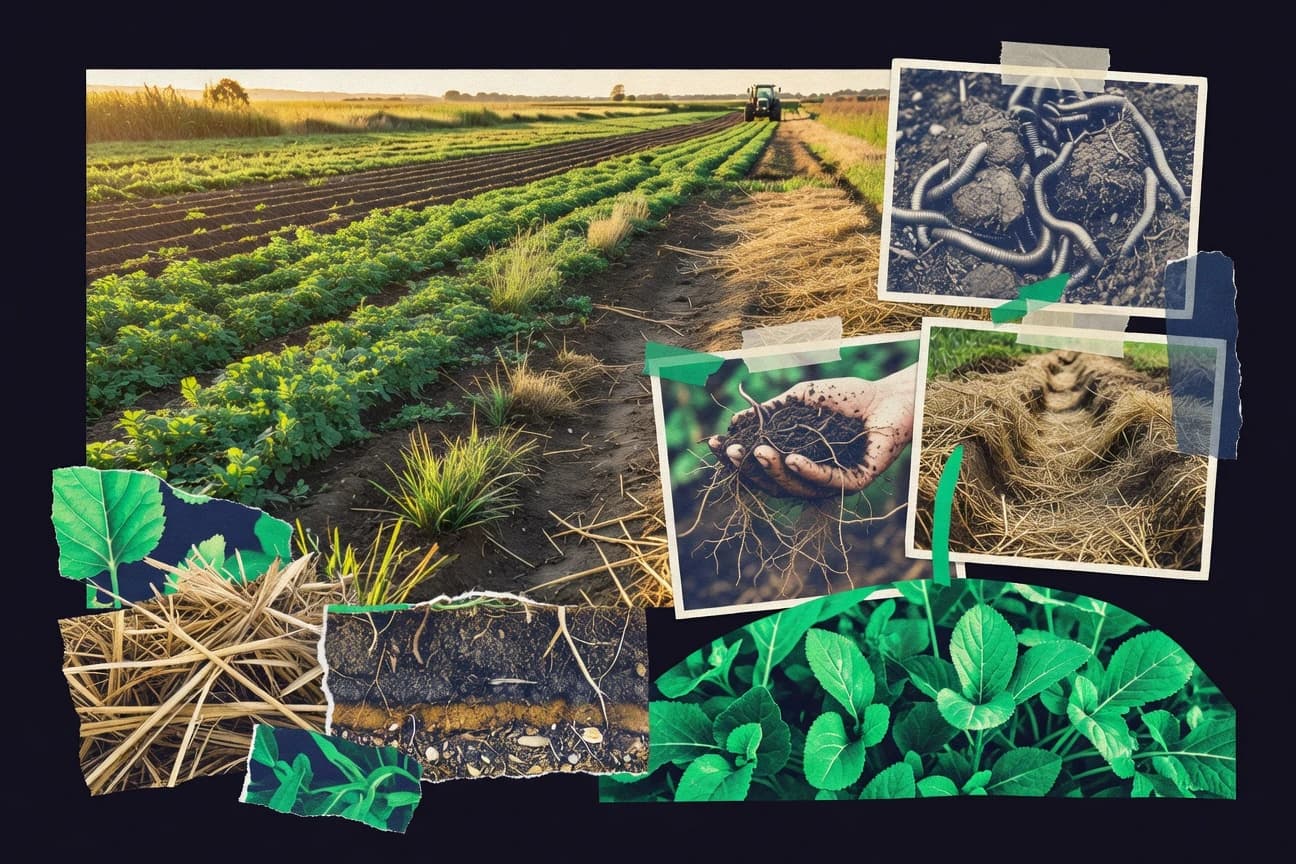
Regenerative Agriculture Statistics
Regenerative agriculture is flipping expectations fast with 2025 ready signals like insect populations up 50 to 100 percent, pollinator abundance 2 to 4 times higher, and soil carbon building up to 1.5 tons per acre per year. At the same time, regen systems cut erosion by 50 percent and boost beneficial life from mycorrhizal networks to dung beetles, showing how soil health, biodiversity, and farm resilience move together rather than competing.
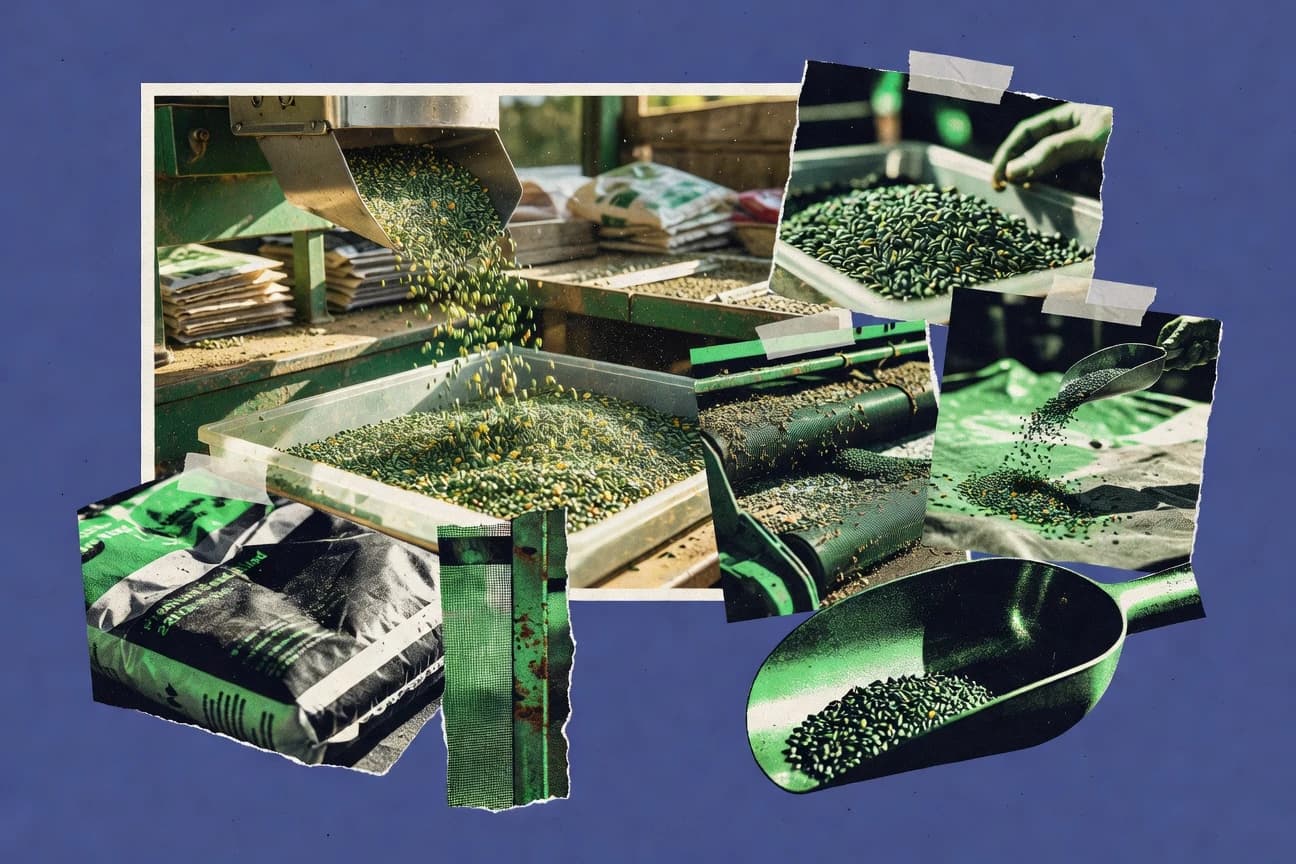
Seeds Industry Statistics
From GM seeds reaching 190 million hectares in 2023 to precision breeding and AI selection lifting purity by 15 percent, this page tracks the fastest movers shaping today’s seed performance. You also get the market power picture behind them, including Monsanto’s 35 percent global corn share in 2023 alongside a USD 62.45 billion global seeds market that is set to climb to USD 100.6 billion by 2030.
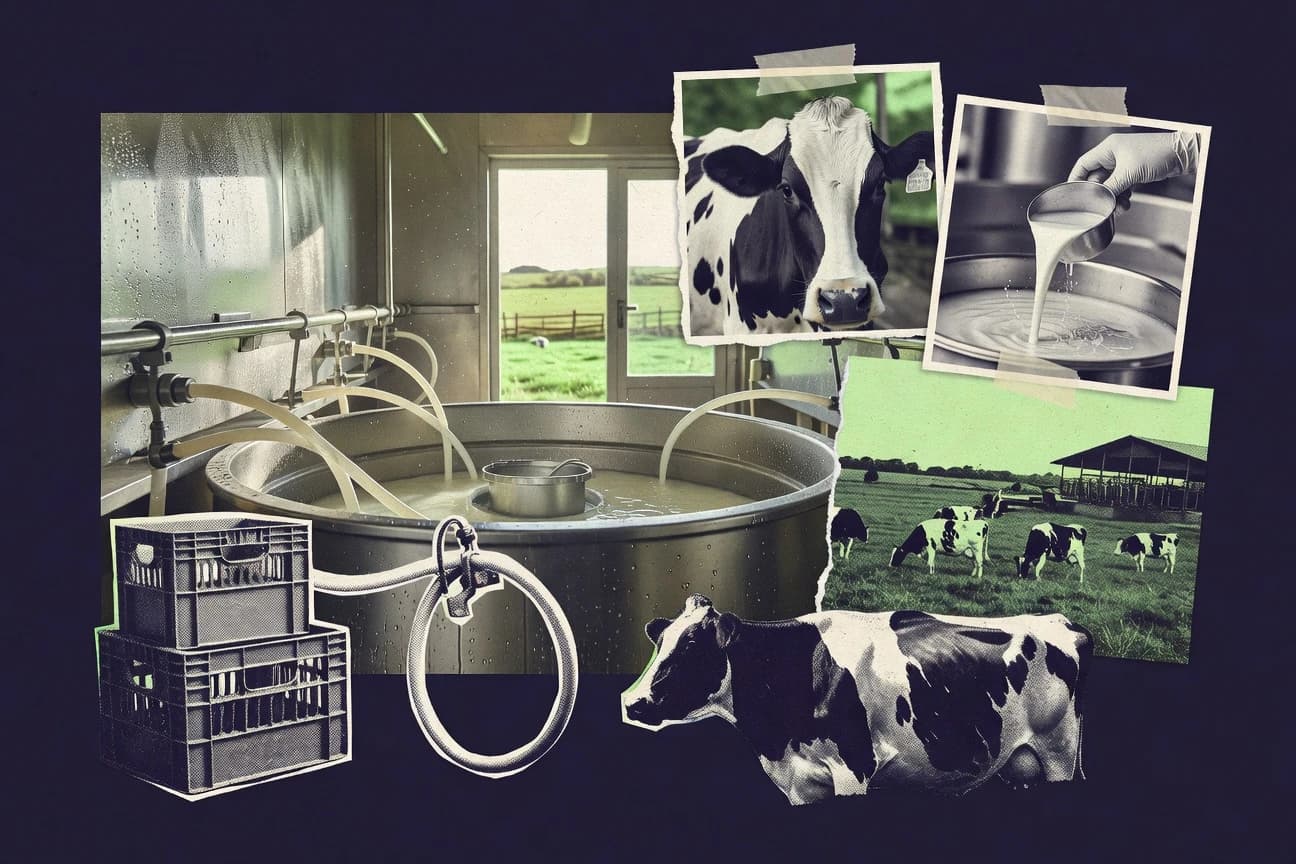
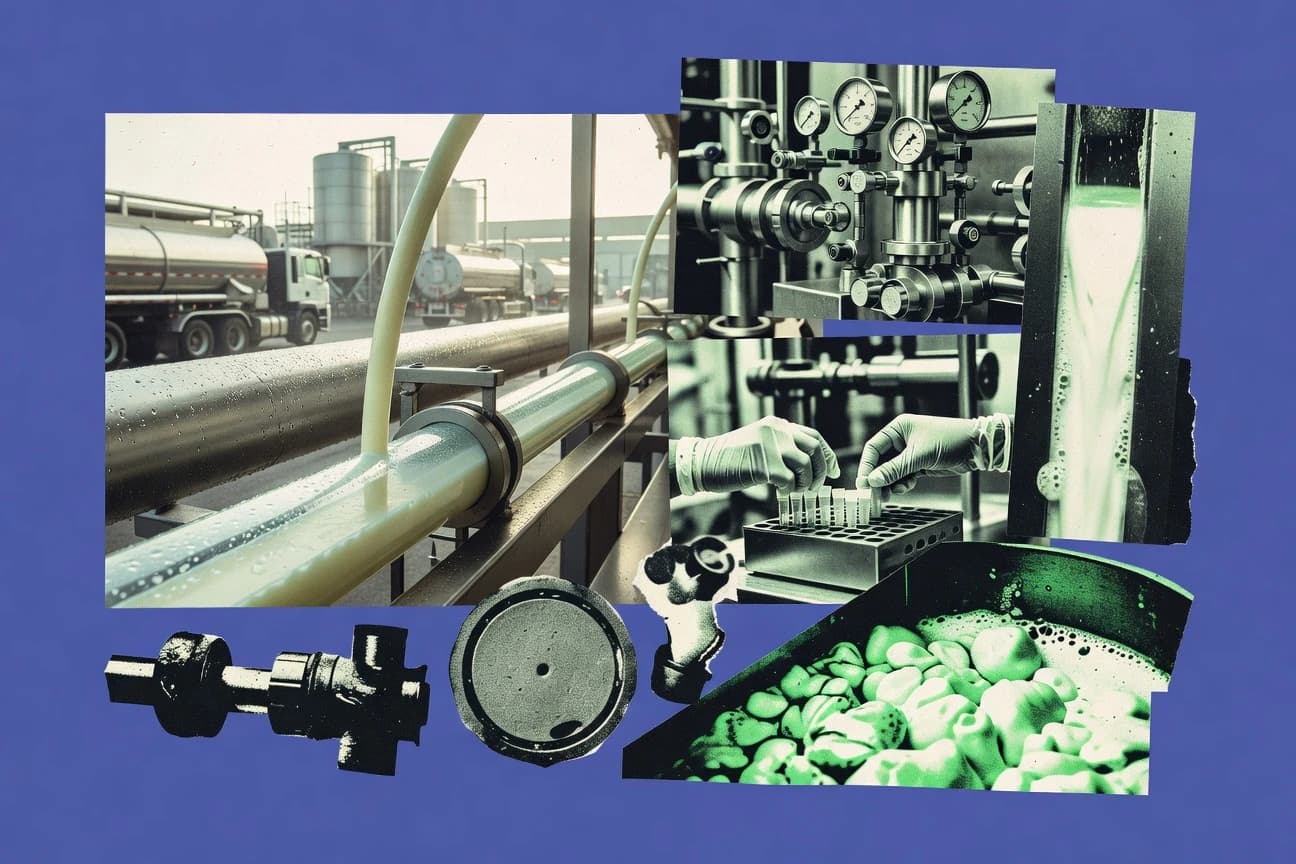
Brazil Dairy Industry Statistics
Brazil’s milk habits are shifting fast, with fluid milk consumption down to 24 billion liters and 85% of urban fluid milk now coming as UHT. From 5.5 kg of cheese per capita and 15 liters of yogurt per capita to a 25% surge in plant based alternatives and a BRL 120 billion dairy value, this page maps how demand, prices, trade flows, and processing power are reshaping the sector.
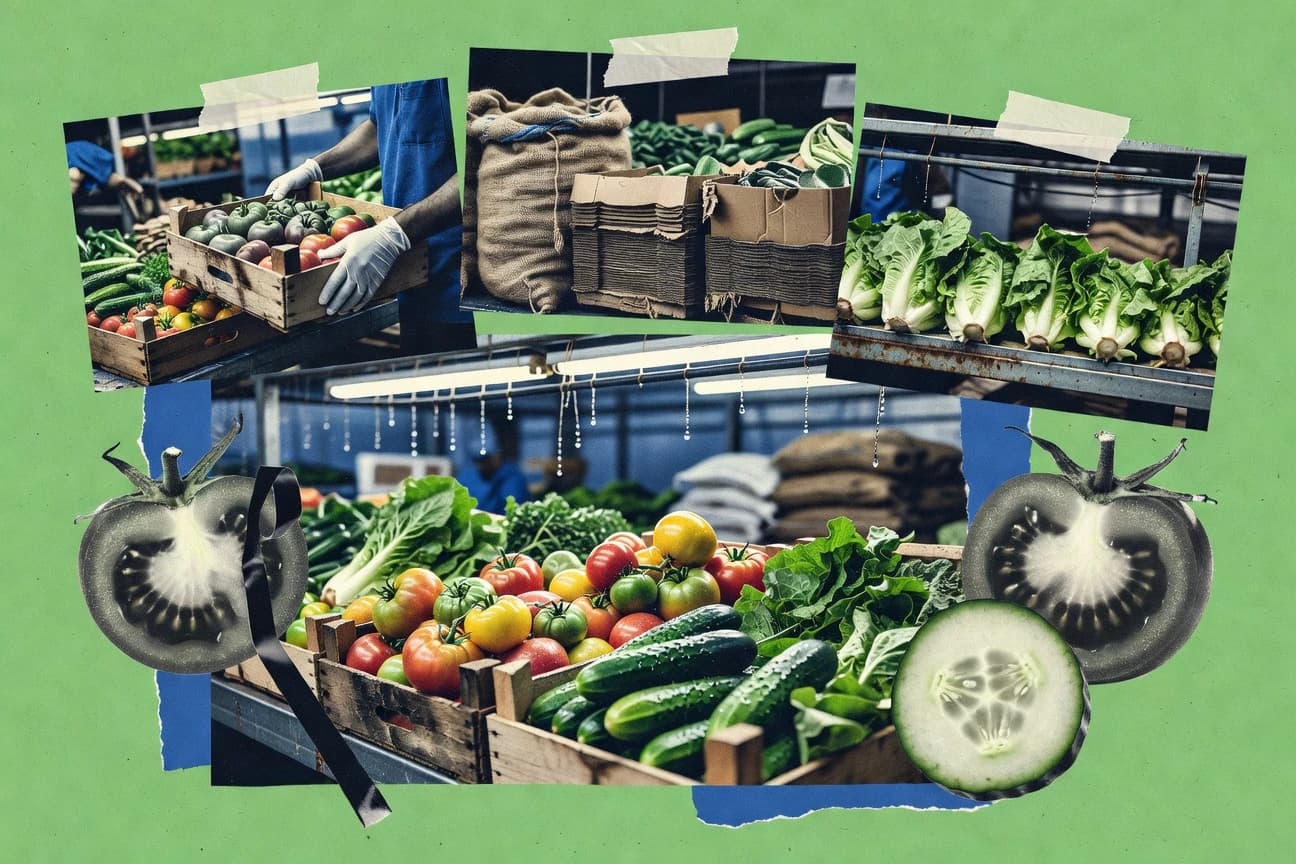
Fresh Produce Industry Statistics
America is buying, eating, and paying more for fresh produce than the calendar might suggest with 2023 survey data showing 72% of U.S. consumers eat fresh produce daily alongside $85 billion in retail sales for fresh fruit and vegetables in 2022. Globally, consumption and supply are shifting fast, from millennial intake running 25% higher than boomers in 2022 to a cold chain logistics market valued at $250 billion in 2022, turning farm to fork into a question of demand, margins, and resilience.
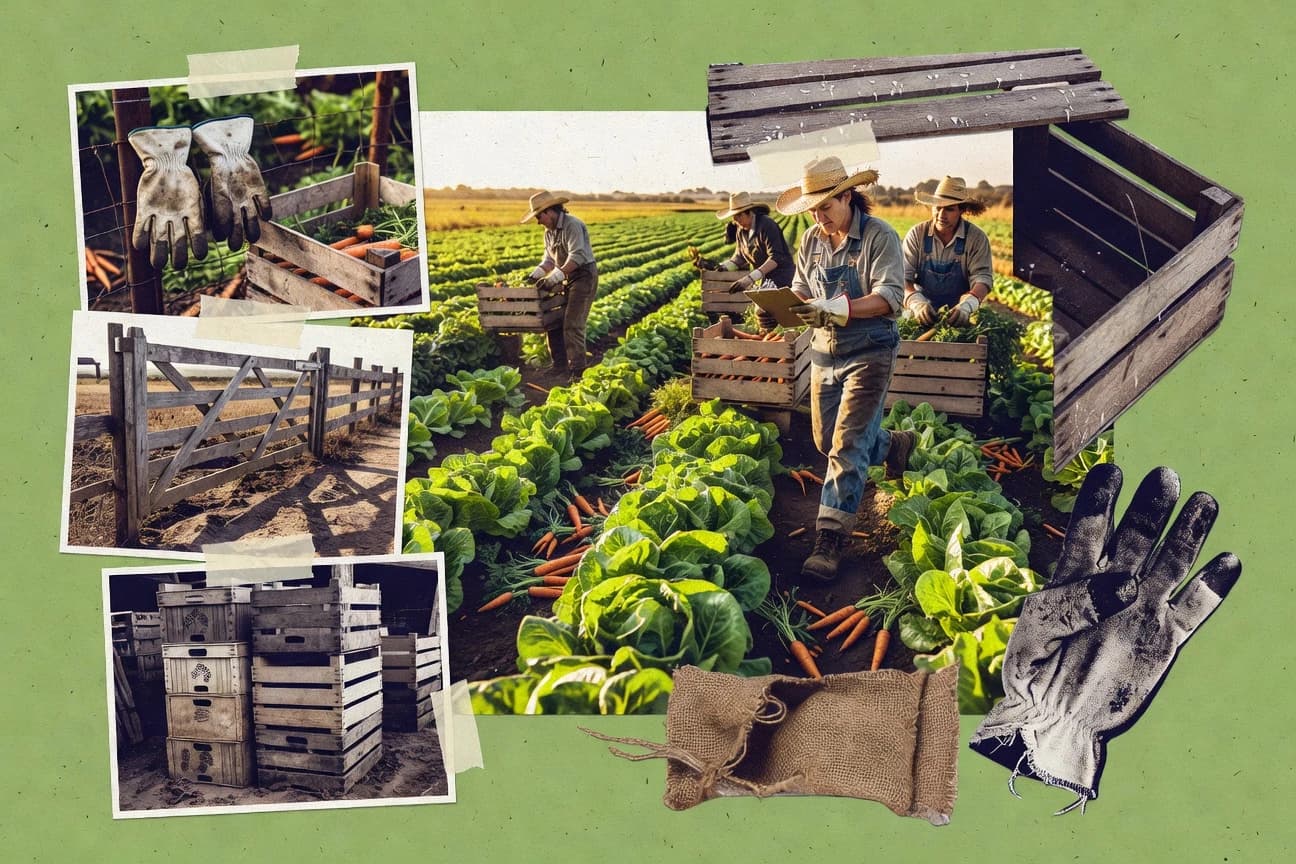
Farm Labor Shortage Statistics
Farm labor shortages are still driving major losses right now, with USDA reporting hired farm labor wages averaging $15.23 per hour in 2023 as growers compete for workers, while 61% of fruit and vegetable farms said they could not find help in peak seasons. See how the gap plays out by crop and region, from California’s $3.1 billion in shortage related losses to fruit and vegetable price hikes and unharvested fields that add up fast.
Fonterra Dairy Industry Statistics
Fonterra’s 2025-ready sustainability snapshot is punchy. By 2023, it cut Scope 1 and 2 emissions intensity by 25% and improved water efficiency to 2.8 litres per kgMS, while renewable energy climbed to 35% and 98% of waste was diverted from landfill. Then there is the bigger picture of value chain impact and performance, with 25 million tCO2e across its value chain and 70% water recycling at plants, alongside farm progress such as 95% of supplier farms reaching sustainable dairy status and soil health improving on 60% of audited farms.

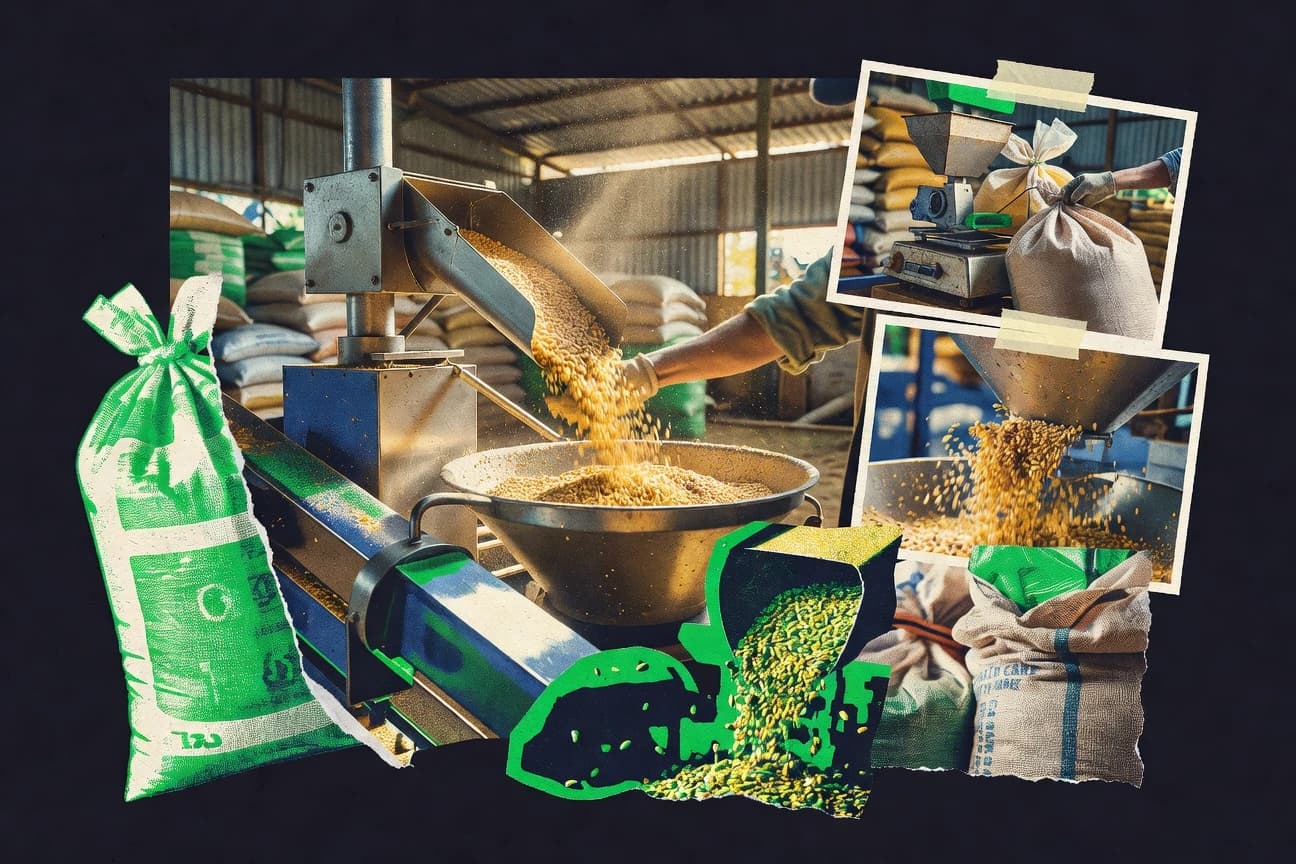
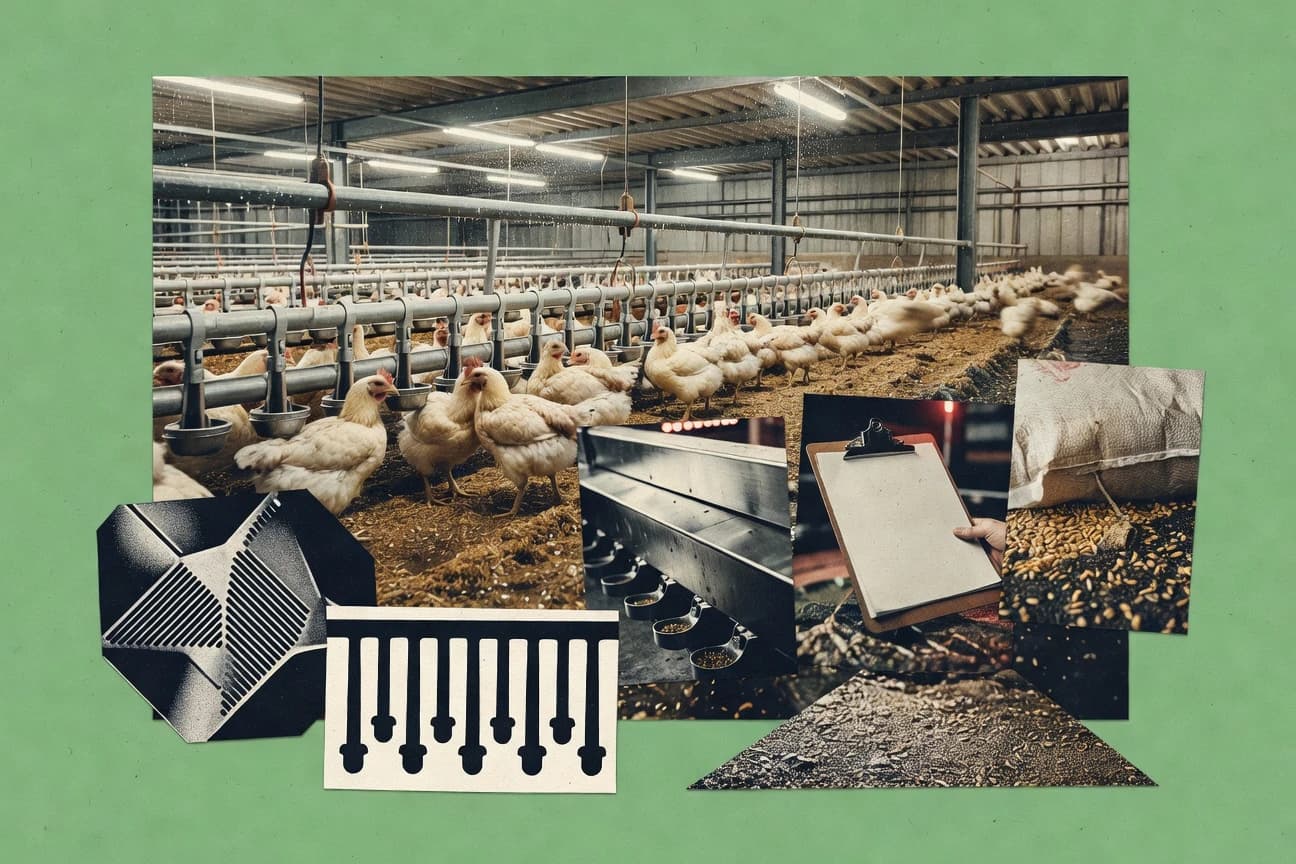
China Feed Industry Statistics
With China’s compound feed market at USD 120 billion in 2022 and feed industry revenue reaching CNY 1.2 trillion in 2023, this page connects what’s driving demand with what mills are producing, from swine and poultry dominance to a 5.2% rise in the cost index and rapid scale-up beyond 400 million tons of annual capacity. It also tracks the trade and input shifts behind the feed bill, including corn usage up to 190 million tons and imported soybean meal inputs totaling 10 million tons in 2023, so you can see exactly where growth is coming from and what it is costing.
Vietnam Feed Industry Statistics
Vietnam’s feed market keeps shifting fast, from aquafeed’s $3.7 billion valuation in 2022 and 55% share in 2023 to a recovery push in swine feed demand that still sits at 5.4 million tons in 2023. This page puts the spotlight on the practical bottlenecks producers watch most, like FCR and feed conversion performance across shrimp, pangasius, and broilers, alongside who is winning capacity and market share as Vietnam feed output climbs toward the $6.8 billion projected 2025 target.
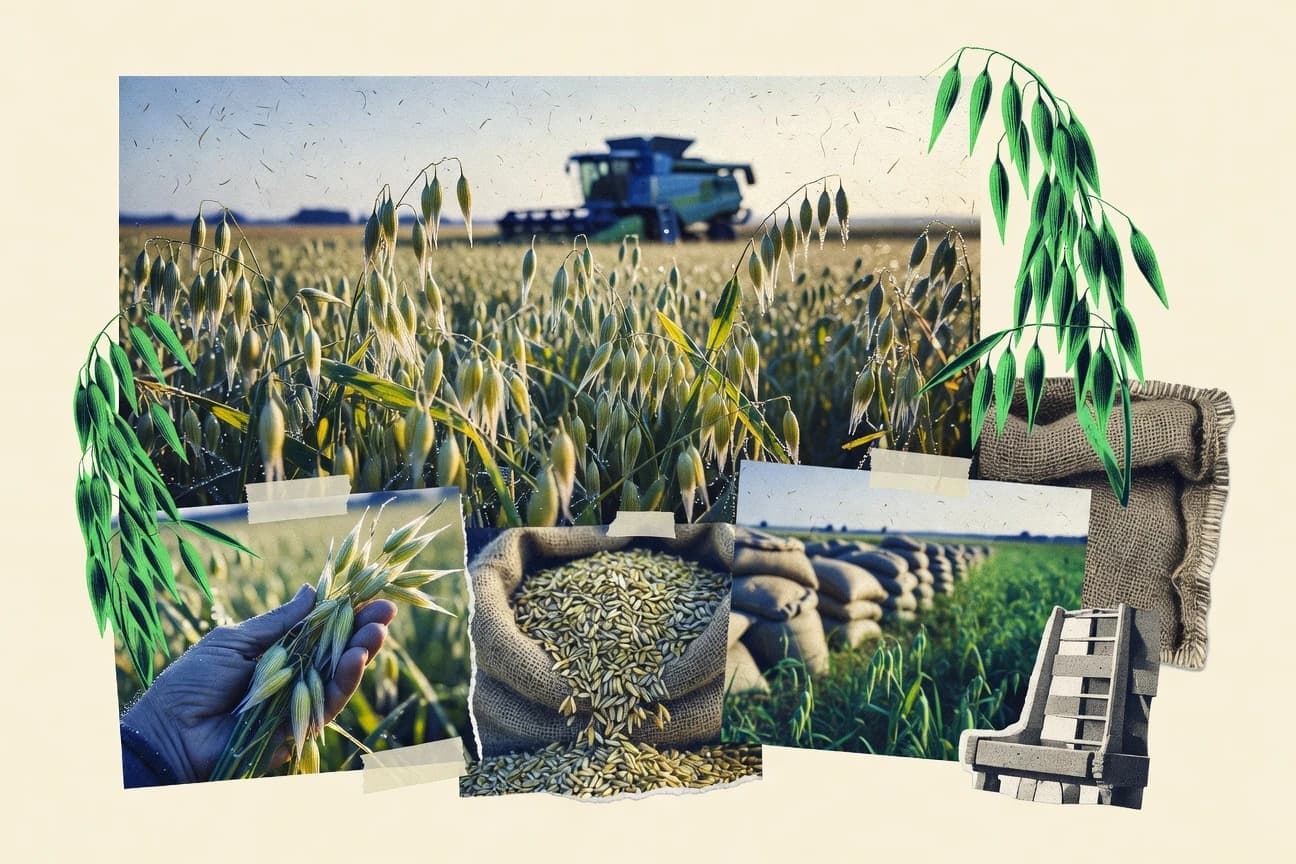
Oat Industry Statistics
Global oat consumption reached 25.8 million metric tons in 2022 while oat milk alone jumped 15% YoY to 1.2 billion liters, showing how fast the crop is shifting from grain to everyday beverages. Per capita figures also sharpen the contrast, with the US at 1.2 kg against Finland’s 12 kg, as this page connects production, processing, trade flows, and sustainability impacts into one clear view of where oats are headed.

Aquaculture Statistics
The global aquaculture market was valued at USD 264.1 billion in 2022 and is still climbing fast, with 5.8% projected CAGR from 2023 to 2030. You will also see how profitability and pressure collide, from salmon at USD 25 billion in 2020 to feed costs eating 50 to 70% of production costs, plus the sustainability tradeoffs like sea lice, nutrient discharge, and methane and CO2e burdens shaping policy and practice.
U.S. Agriculture Statistics
For 2022, the U.S. farm picture spans everything from record crop performance to shifting labor and financial pressure, with corn topping 13.705 billion bushels and hired farm labor averaging 1.2 million workers in peak season. Track how production, exports, and costs move together, including exports hitting $196 billion in FY2022 and farm production expenses rising to $199.2 billion, to see what changed and what stayed stubbornly the same.
Poland Poultry Industry Statistics
Poland’s poultry story looks stronger than ever, with per capita poultry consumption at 28.5 kg in 2023 and a poultry trade surplus of €2.8 billion, alongside 1.1 million tons sold through retail in 2023 and organic demand up 20% to 20,000 tons. At the same time, prices are moving and shifting habits, as chicken breast averaged 25 PLN per kg and out of home poultry consumption rose 5% to 300,000 tons, while the sector supports 180,000 direct jobs and contributes 1.2% to GDP in 2023.
Animal Feed Industry Statistics
The feed numbers keep moving fast with global poultry feed at 450 million tons in 2022, while the industry simultaneously pushes efficiency gains such as a 1.6 kg feed conversion ratio for broilers in 2022 and 70% of feed producers adopting precision feeding tech by 2023. From corn fed to China and swine rations reaching 220 million tons worldwide to aquafeed growth topping 28 million tons in 2023, this page maps where demand concentrates and how sustainability and ingredient innovation are changing the mix.

Chicken Statistics
Global chicken trade hit 13.8 million tons in 2022 and the industry still lands near $285 billion in 2022 revenue, but what’s more revealing is the food chain around it where modern broilers need just 1.6 kg of feed per kg of gain by 2022 and global per capita consumption reaches 15.6 kg. From Brazil exports at $8.5 billion to EU poultry’s €120 billion economic footprint, you will see how production, disease pressure, and nutrition realities shape what ends up on plates, and why “chicken” is never one simple number.
Feed Industry Statistics
Protein and energy recipes are being rewritten fast, from fishmeal falling to 10% of total aquafeed protein in 2022 to feed additives reaching USD 45.8 billion in 2023 as enzymes and amino acids push efficiency. See how today’s global compound feed market of 1.25 billion metric tons and 2023’s precision nutrition growth are reshaping what goes into poultry, swine, ruminants, and aquafeed, one percentage point at a time.

Aquaculture Industry Statistics
Aquaculture industry statistics bring the $281 billion global value for 2020 into sharp focus, where salmon alone adds $25 billion a year and shrimp powers another $40 billion. You will also see the workforce scale and climate tradeoffs side by side, from 218 million jobs worldwide and women making up 50% of labor to 0.01 kg CO2 per kg of product and fast feed efficiency gains that help explain why aquaculture is expected to reach $400 billion by 2030.
Chicken Industry Statistics
Last year, global chicken trade hit 13.5 million tons worth $40 billion and the industry ranged from 98.9 pounds of per capita consumption in the U.S. to 90 million metric tons of chicken meat globally, with per capita use in China at 15.5 kg. Use this page to spot the sharp contrasts behind that surge, from rapid broiler production and export swings to farmgate pricing, processing costs, and even CO2e emissions per kilogram.

Japan Dairy Industry Statistics
Japan’s dairy story tightens around 2022 to 2025 pressures, with total fluid milk at 8.92 million metric tons while fresh consumption slips to 31.2 kg per person and plant based alternatives reach a 5.2% share. Follow how cheese and yogurt keep climbing, logistics and shortage prices reshuffle the retail scene, and rural urban, online, and lactose free habits pull demand in sharply different directions across Japan’s coops, brands, and farms.
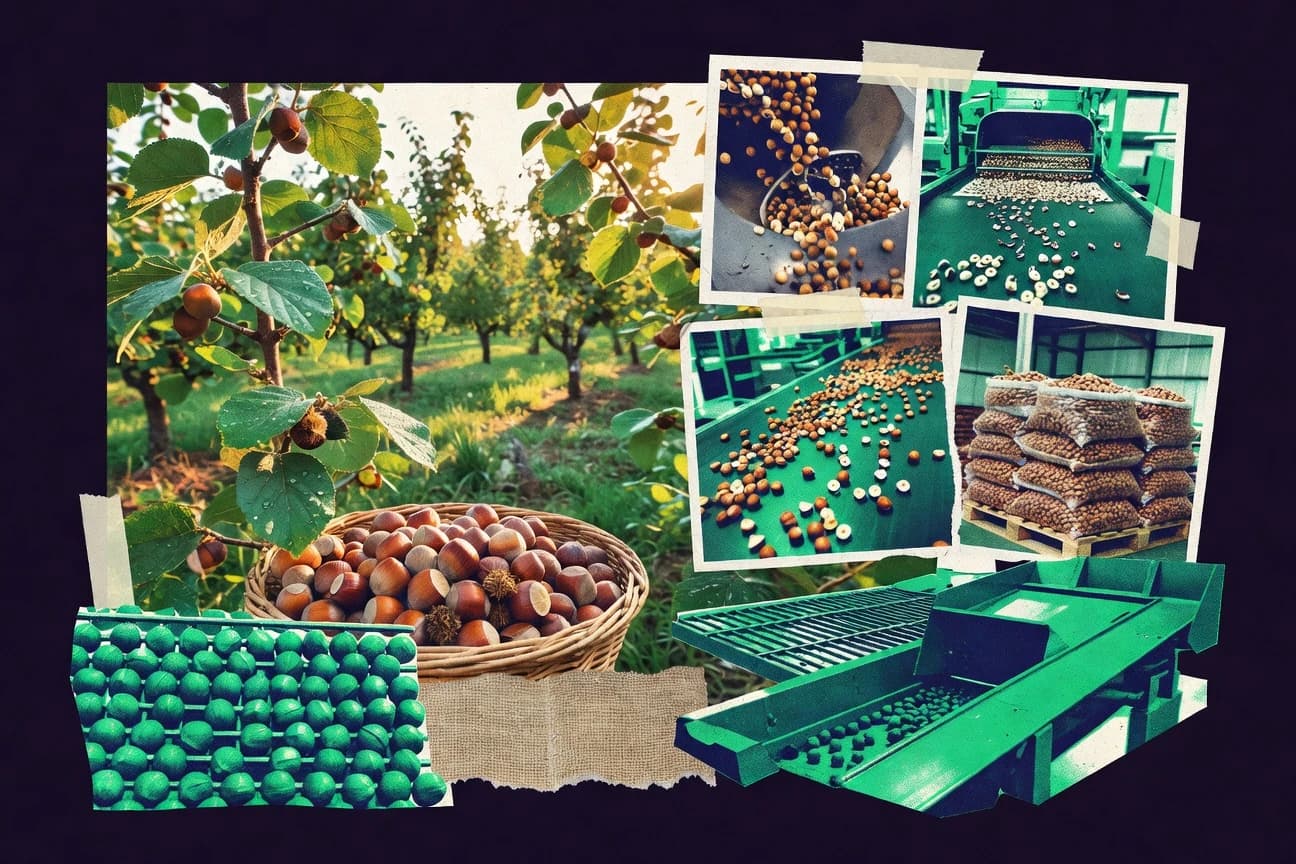
Hazelnut Industry Statistics
Global hazelnut demand hit 1,050,000 metric tons in 2022 and production centered on Turkey, which supplied 67% of the world total. The page connects that supply weight to price and processing pressure, from kernels averaging $4.50 per kg and ICE futures peaking at $6,000 per ton to confectionery using 45% of global output and export trade pushing $4 billion in value.
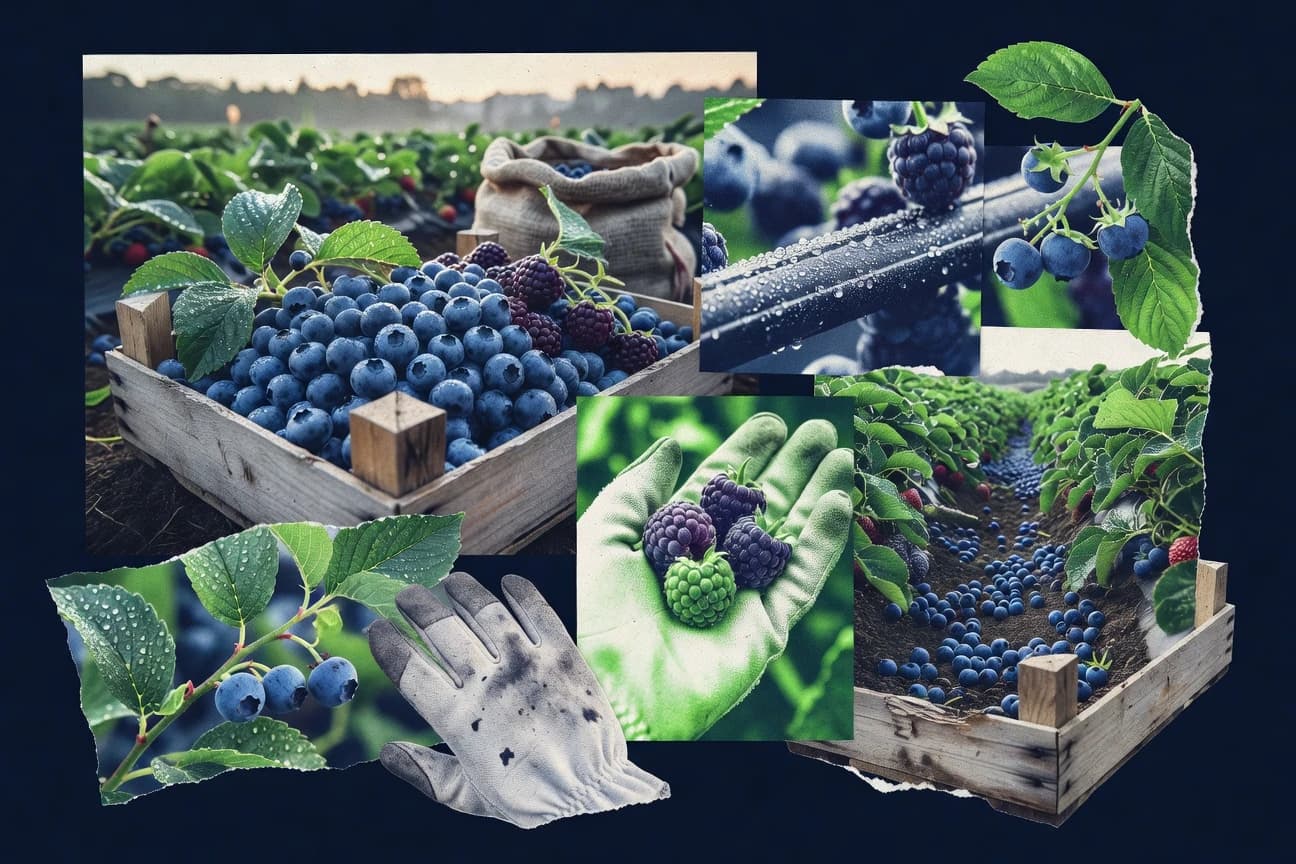
Berries Industry Statistics
US per capita berry spending reached $15.20 in 2022 while global frozen berry consumption is already at 2.1 million tons, turning fresh demand into a year round business. From Netherlands berry consumption at 4.8 kg per capita and Europe’s 45 percent frozen share to trade volumes topping 5.5 million tons, the Berries Industry statistics page maps where growth is accelerating and which varieties carry the next wave.