GITNUX MARKETDATA
Browse Our Category
Agriculture Farming
Latest update:

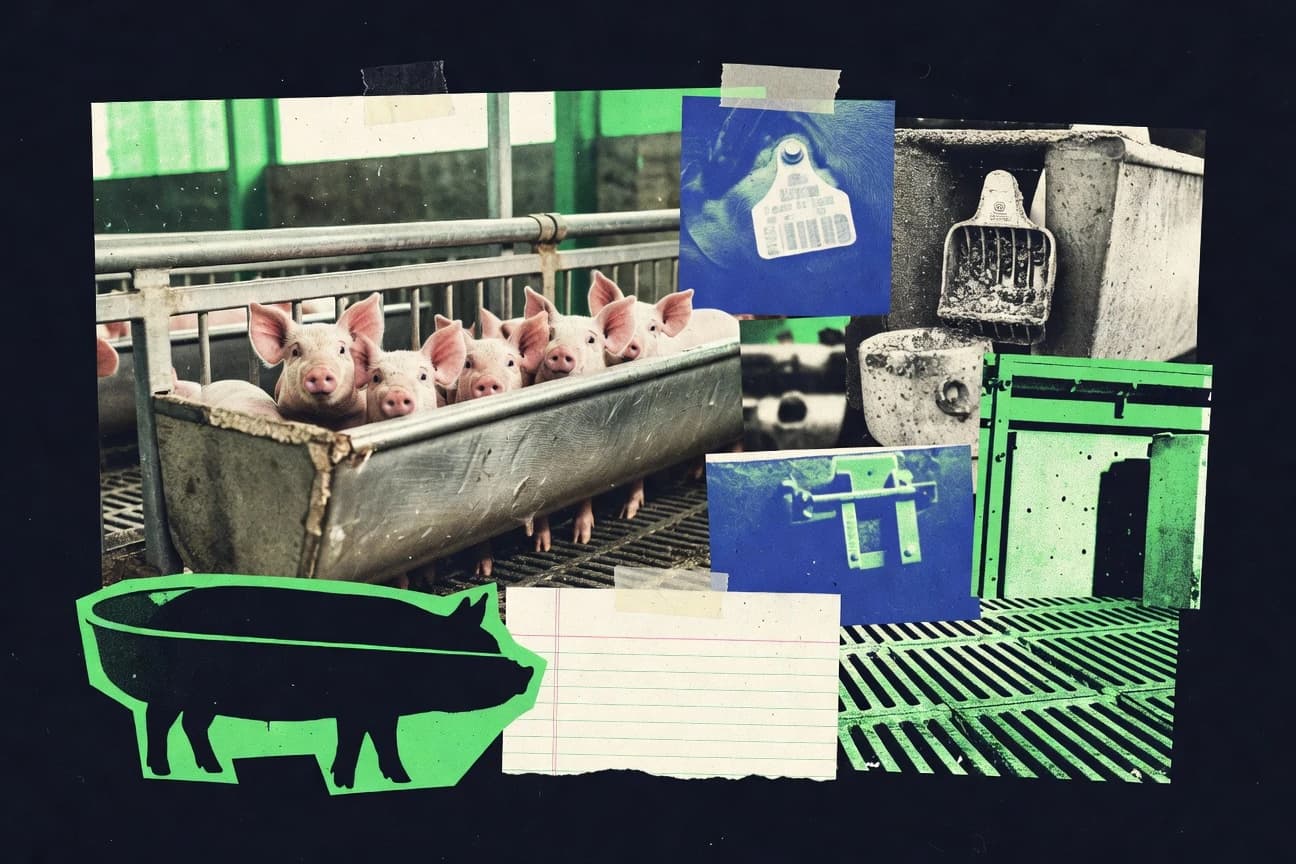
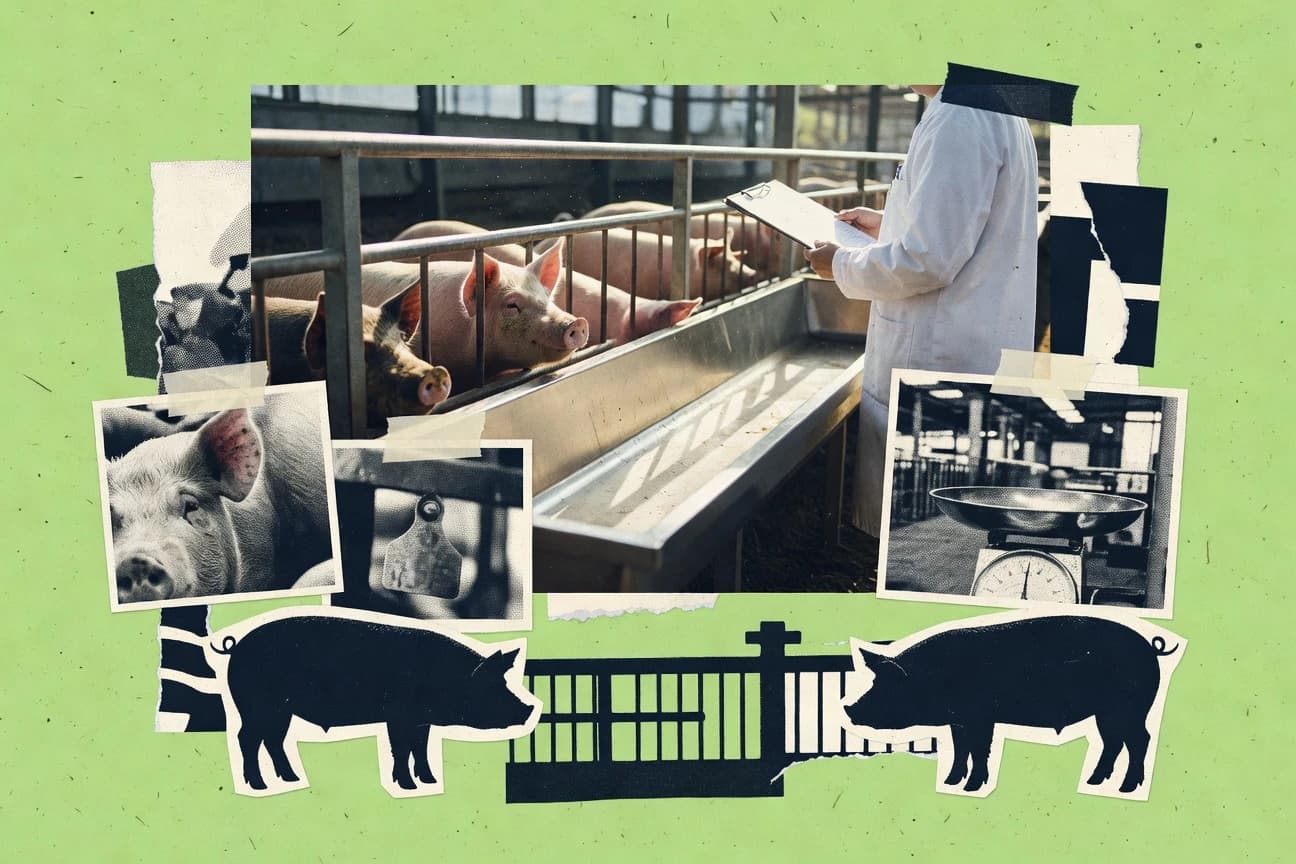
Pig Industry Statistics
Global pork demand is projected to reach 116 million tons in 2023, up 1.5%, while consumers swing sharply from Spain’s 45 kg per person to Australia’s 11 kg, and trade power shifts with record US pork exports of 3.1 million tons. Follow how prices, feed costs, and disease pressure map onto profits, emissions, and production output across the world.

Russia Dairy Industry Statistics
Russia’s dairy picture looks familiar at the top of the table but shifts fast across categories, from per capita consumption realities to production and trade pressures. See how fresh demand, pricing, and output move together, including Russia’s raw milk production at 32.15 million metric tons in 2022, investment of 250 billion rubles in 2023, and cheese and butter production changes that help explain why imports still matter even as self sufficiency reaches 84.3% in 2023.
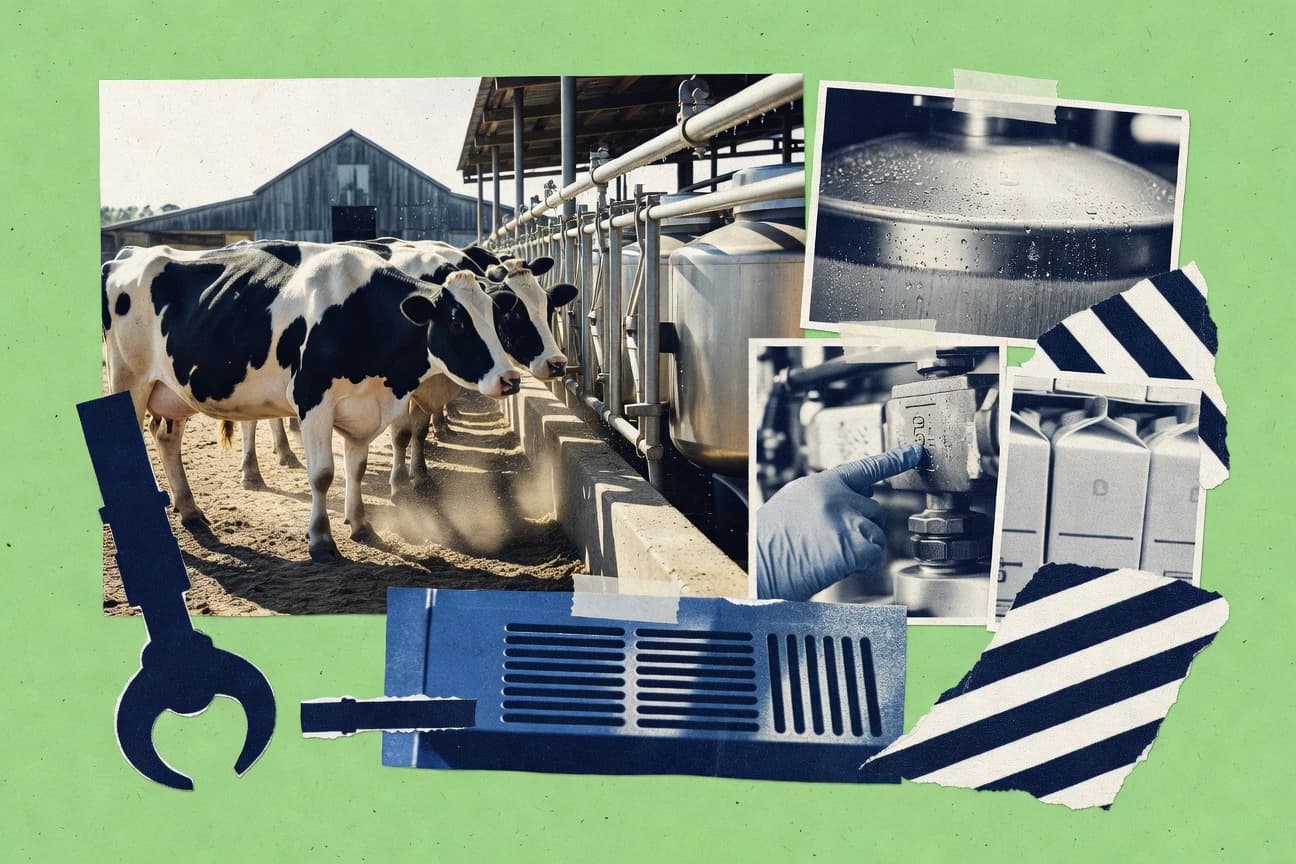
Canada Dairy Industry Statistics
Even with fluid milk down to 78.2 litres per person in 2022, Canadians are leaning into cheese at 18.9 kg and yogurt at 13.4 kg, while plant-based alternatives now hold 10% of the fluid milk market. Track what this shift means across the whole Canadian dairy system, from production and processing to exports and farm economics that supported $8.4 billion in GDP in 2022.
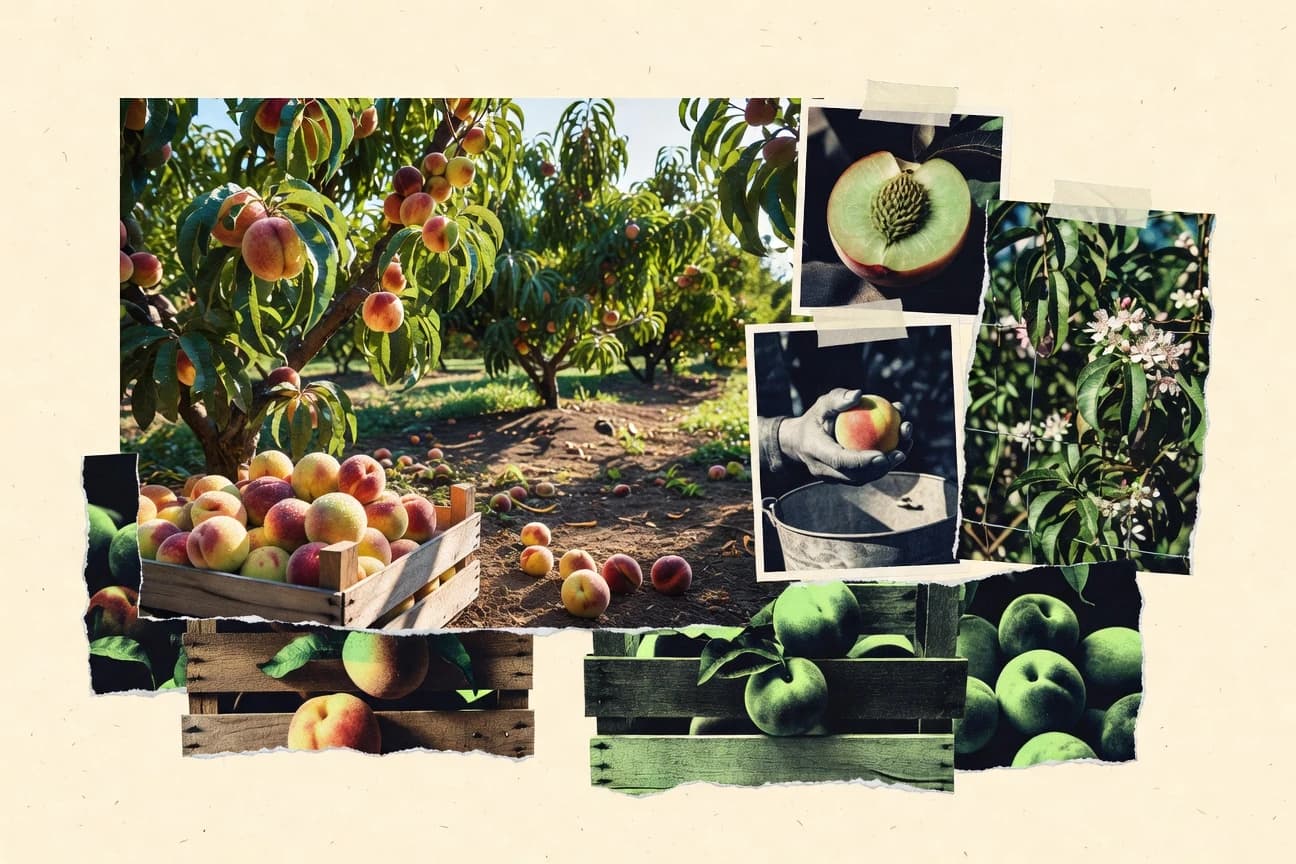
Peach Industry Statistics
US per capita peach consumption fell to 3.2 pounds in 2022 and fresh still leads at 65% yet processed products account for 35%, showing how demand is shifting from fruit to formats. From China’s 10.5 kg per person to global production at 24.5 million metric tons and a greener push like drip irrigation on 85% of California orchards, this page connects what people eat to how peaches are grown, traded, and priced.

Japan Pork Industry Statistics
Tokyo loin at ¥1,200 per kg, online sales up 25% to 120,000 tons, and pork in bento boxes at 1.2 billion units make this Japan Pork Industry snapshot feel strikingly current. It also tracks how Japan’s pork mix has shifted toward processed products and precision-fed production even as imports and feed costs tighten the margin picture.

Animal Nutrition Industry Statistics
Global animal nutrition keeps shifting, with compound feed demand now topped by poultry feed at 485 million metric tons in 2023 and broiler feed conversion improving to 1.6 kg feed per kg gain. From China’s 195 million tons of swine feed to salmon feed protein sourcing changes like insect protein hitting 50,000 tons in 2023, this page connects feed volumes, ingredient bottlenecks, and performance breakthroughs to what producers can expect next.
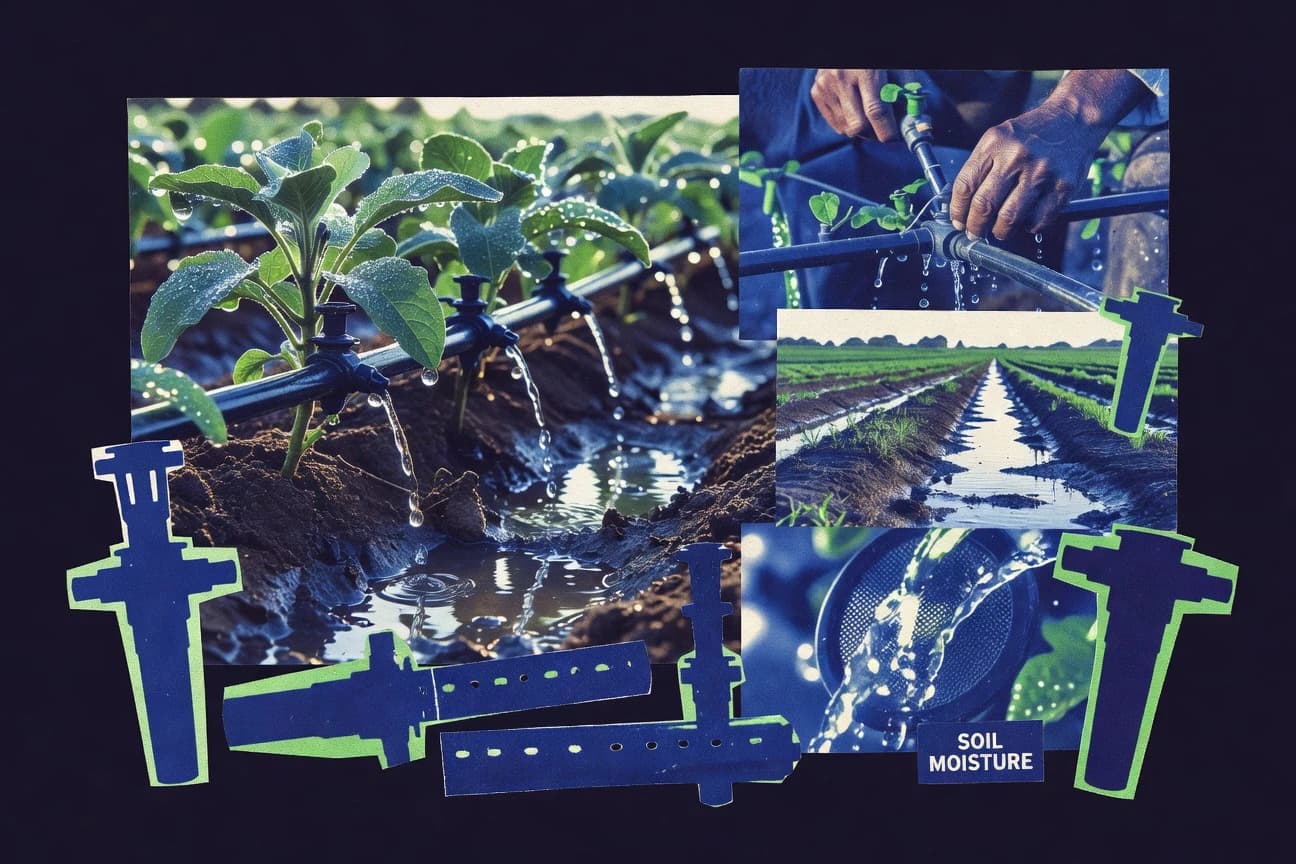
Water Use In Agriculture Statistics
Agriculture pulls about 2,685 billion m³ of water in 2020, using 69% of all water withdrawals, yet crops and livestock vary wildly, from rice needing 3,000 to 5,000 liters per kg in India to milk at 1,020 m³ per ton. This page connects those product specific water footprints with how irrigation efficiency, groundwater reliance, and management choices can either intensify stress or cut water use dramatically.
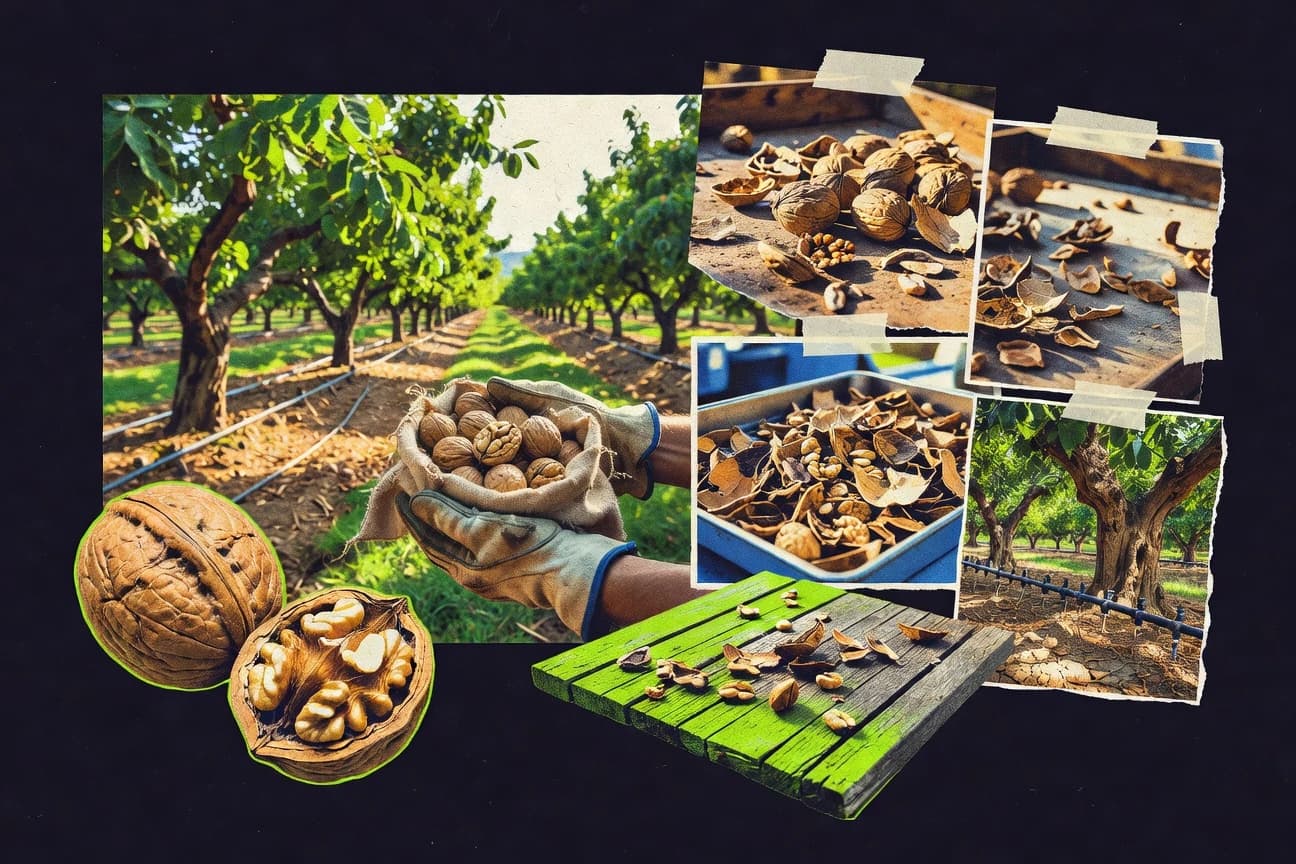
Walnut Industry Statistics
California’s 2022 farm gate value of $1.4 billion and US retail sales topping $1.2 billion in 2022 show how quickly walnut demand is turning into dollars, while global consumption reached 3.4 million tons in 2022/23. Trade and diet diverge sharply across markets, from China’s 70% in shell intake to the EU’s 4% kernel growth, making this the fastest way to see where walnut growth is moving next.
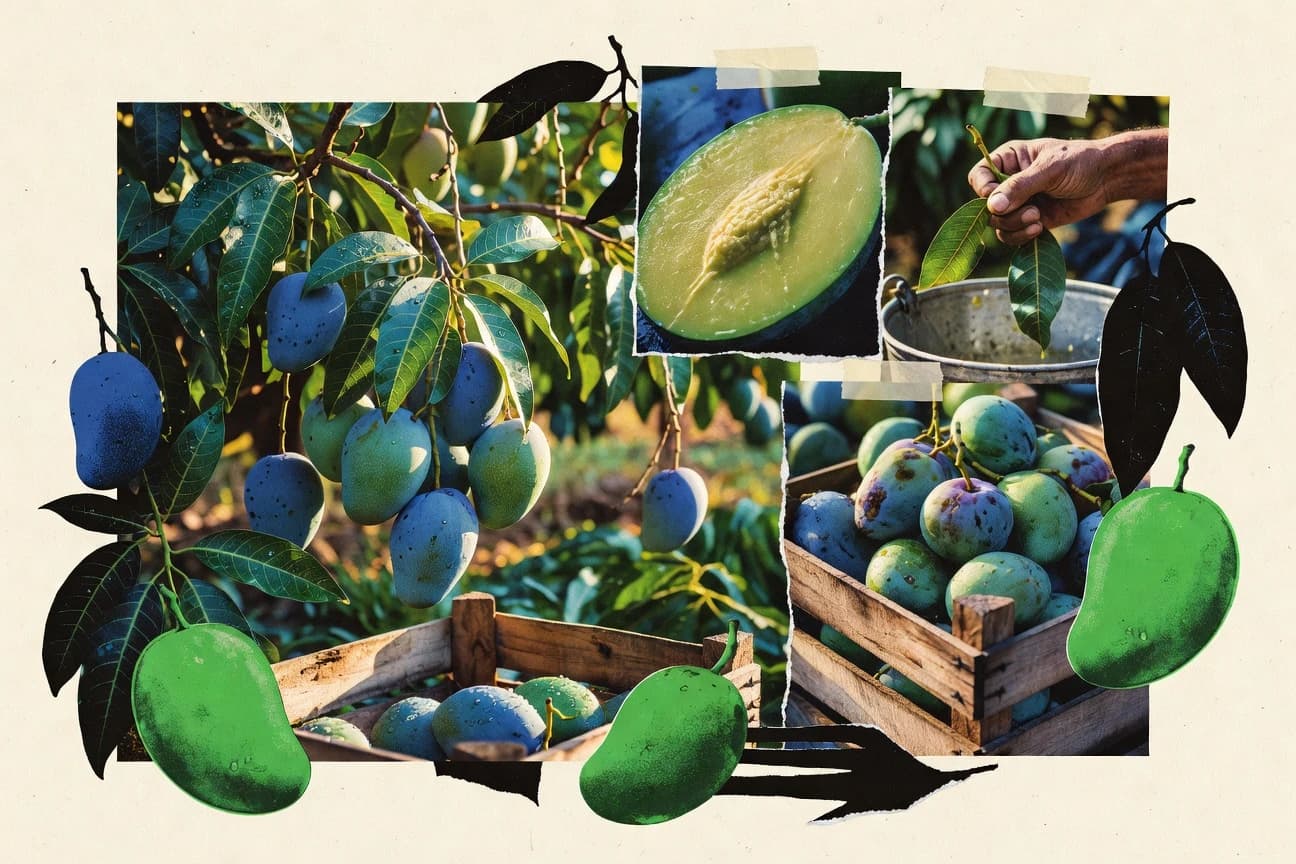
Mango Industry Statistics
Global mango demand and trade keep widening their gap, from processed products rising 7% to 10 million tons to a $15.2 billion global market and $8.5 billion in trade. See how India alone absorbs 96% of its production, while US consumption climbs to 3.2 kg per capita and the EU remains at 1.8 kg, and then track the export swings that made Mexico and Peru key players.

Agave Industry Statistics
Mexico’s agave cultivation has surged to 275,000 ha, with blue agave now the backbone at 4,000 plants per hectare and used in 70% of fresh plantings, while irrigation still reaches just 20% of fields and helps lift yields by 25%. From soil pH and drought tolerance to pests, labor, and export-driven revenue, the page connects agronomy and trade so you can see exactly what drives the next harvest cycle and where the biggest bottlenecks sit.

Horse Statistics
From 205 bones and 360 degree vision to a tongue that stretches 7 to 9 inches, this page turns the horse body into something you can actually picture. Then it hits the mind and the herd, with a 30 million horse global population, brains trained by operant conditioning for 50 commands, and even a sleep habit that lets them rest standing thanks to their stay apparatus.

Global Seafood Industry Statistics
Seafood is still growing, but the balance between supply, consumption, and sustainability is tightening fast, from aquaculture per capita supply rising to 20.7 kg in 2020 to global seafood revenues reaching $401 billion in 2022. This page puts regional detail side by side with pressure points like biologically overfished stocks, shrimp and tuna trade, and massive job totals, so you can see exactly where demand is surging and what may strain the system next.

Forestry Timber Industry Statistics
Global forestry and timber revenue is forecast to keep momentum as the sector sits at $579 billion in 2023 and the timber market is projected to reach $850 billion by 2030 on 3.5% CAGR. Track how trade and jobs stretch from EU imports of €55 billion and China’s 1.5 trillion CNY wood processing output to certification, carbon storage, and supply that is tightening just as demand grows.

Nori Industry Statistics
Global nori still lands at a USD 2.1 billion market in 2023 while key price and trade signals hint at a faster reshaping of demand, from Japan’s JPY 1,200 per kg wholesale price to Asia holding an 85% share of the USD 1.45 billion export wave in 2022. This page also connects the supply chain and farm economics to sustainability and labor realities, so you can see exactly why premium sheets can average USD 25 per 100g pack even as certification, water use, and workforce scales move in very different directions across countries.

Peanut Industry Statistics
U.S. shoppers ate about 7.5 pounds of peanuts per person in 2022 and sent another 650 million pounds overseas for consumption, a reminder that this crop is both comfort food and global trade. From $2.1 billion in retail peanut butter sales to $3.2 billion in shelling output and 25,000 farms still driving $1.6 billion in value, the Peanut Industry statistics page connects what’s on your table to what it takes to grow, process, and move peanuts at scale.
China Pork Industry Statistics
ASF outbreaks collapsed to 3 cases in 2022 from a 10,000 spike in 2019, while classical swine fever vaccination reached 99.5 percent and antibiotic use fell 40 percent since 2018. You get the full picture of China’s post ASF rebound and modernization, from 55.2 million tons of total pork consumption and a 97.5 percent self sufficiency rate to 85 percent manure utilization and energy output reaching 1.2 billion kWh at waste to energy farms.

Oregon Timber Industry Statistics
Oregon’s timber sector is still a billion dollar engine of jobs, wages, and tax revenue, with 2022 GDP contribution of $2.8 billion and 28,500 direct manufacturing jobs, yet you can also see the newer pressure points in the work force shift as sawmill employment averaged 12,300 workers in 2022, down 2 percent from 2021. Get a balanced picture of how forestry and processing turn into $1.4 billion in exports and $5.2 billion in total economic output while funding schools through $85 million in 2023 severance taxes and supporting sustainability on more than 12 million acres of commercially viable timberland.

Mushroom Cultivation Industry Statistics
See how composting can cut microbial risk by 99.7% in cured sawdust substrates while yield drivers like temperature control and humidity targets turn production into a measurable science. Follow the supply chain numbers too, from China’s 87% share of global mushroom output in 2019 to the EU’s big internal trade flow of €3.0 billion in mushroom imports in 2022 and the projected $9.2 billion global market value by 2028.

Seaweed Industry Statistics
Seaweed Industry pulls together the latest production, market, and regulatory reality checks, from output rising to about 19.7 million tonnes in 2022 to a projected global seaweed market of $18.8 billion by 2034 and the strict food and fertiliser rules that shape what can actually be sold. It also spotlights how fast farming returns nutrient gains and how quality is verified, including carrageenan viscosity and gel strength testing, alongside yield and safety findings that can vary dramatically by site and species.

Cranberry Industry Statistics
U.S. cranberry consumption hit 0.34 gallons per person in 2022 while export use reached 65% of the crop, a sharp reminder that the holiday fruit is also a global commodity with China imports surging 30% to 50,000 tons. Household reach is broad with 85% penetration, yet the product trail is surprisingly specialized, from 90 million pounds of fresh sales to dried berries climbing to 150 million pounds annually and cranberry juice drinks owning 60% of the cranberry beverage category.