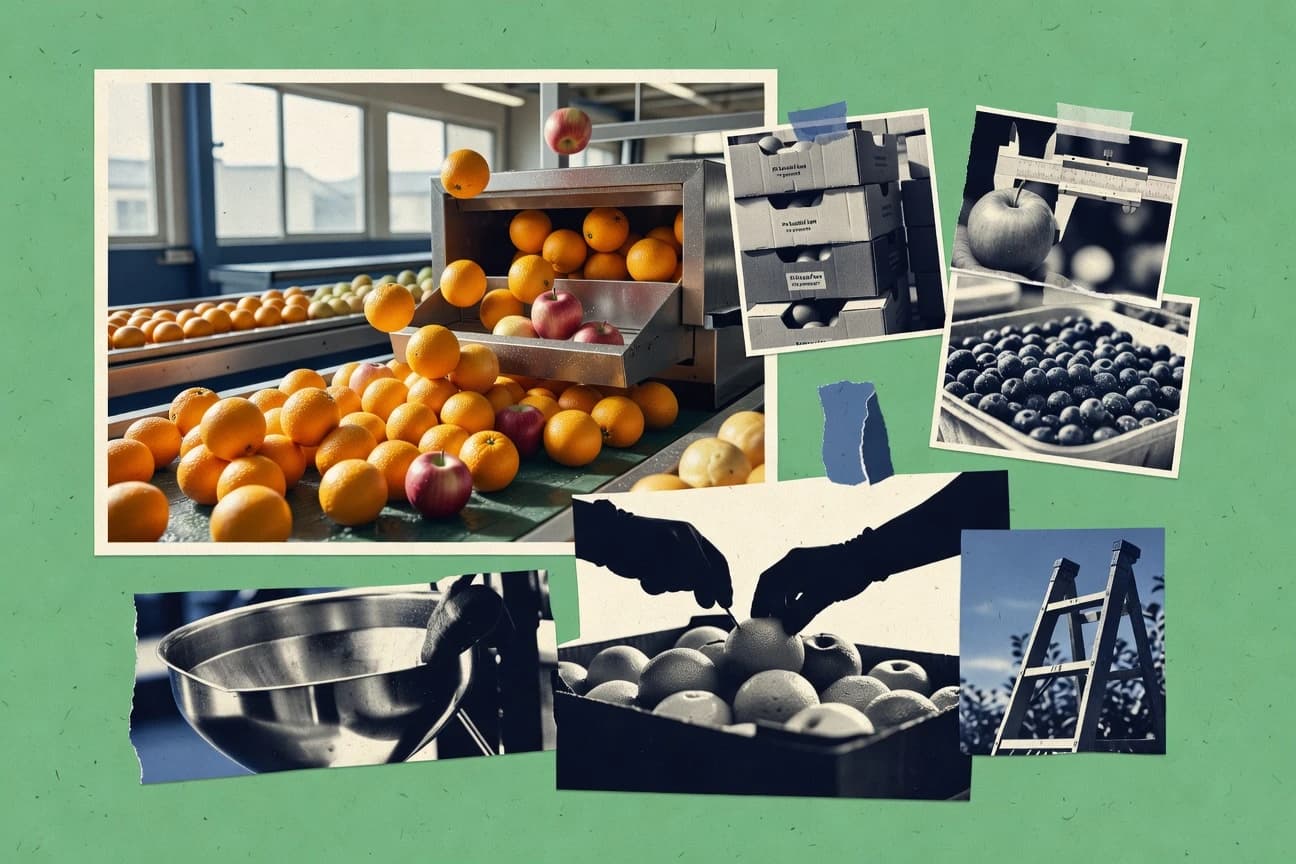

Berries occupy only 1.3% of the world's cultivated land. Global fruit production faces major pressures from retail waste and high energy costs. This data details the industry's scale, risks, and growth.
Key Takeaways
- 1.3% of global cultivated land is planted with strawberries, blueberries, and other berry crops combined (FAOSTAT fruit/berries land-use series), showing berries are a smaller land-use category within fruits
- 58% of the world’s agricultural holdings are smaller than 2 hectares (global farm structure statistic from FAO), indicating that a large share of fruit growers are likely smallholders
- 73% of global fruit and vegetable growers use some form of irrigation in order to stabilize yields (FAO water and irrigation evidence summarized in FAO irrigation/agriculture materials), illustrating irrigation dependence in fruit production
- 20% of fruit and vegetable losses occur at distribution and retail globally (FAO stage breakdown), highlighting retail waste drivers for fruit
- 48% of global food loss happens at the post-harvest level in developing countries for perishable foods (FAO regional-stage loss insights), indicating key risks for fruits
- $8.4 billion global market value for fresh-cut fruits in 2023 (industry sizing reported by major market research publishers), reflecting processed-fresh fruit demand
- 4.2% CAGR projected for the global fresh fruits market from 2024 to 2030 (market outlook from industry research), indicating continuing growth momentum in fruits
- 3.1% share of household food expenditure spent on fruit in the US in 2023 (US food expenditure data by category), demonstrating fruit’s spending importance
- 32% of US shoppers report buying fruit more often as part of healthier eating routines (survey result from Nielsen/industry research on health-driven shopping), indicating health trend influence
- 18% of fruit growers in a global sample adopted biological pest control in 2021 (peer-reviewed/survey evidence summarized in IPM/biocontrol adoption literature), showing increasing biocontrol use
- 27% of global fruit and vegetable processing facilities are located in Asia (regional distribution of processing capacity affecting availability of processed fruit inputs)
- 23% of global fruit exports go to the top 10 destination countries (UN Comtrade/ITC structure for fruit HS export concentration in a global export dataset), indicating export market concentration
- Netherlands re-exported about 2.7 million metric tons of bananas through Rotterdam trade flows in 2022 (industry trade statistics for banana logistics), reflecting the role of re-export hubs
- Germany imported 0.9 million metric tons of fresh bananas in 2023 (Eurostat/Comext trade statistics for HS 080390), indicating major EU banana import scale
- Cold storage energy can account for 20%–40% of total logistics energy costs in cold-chain produce operations (peer-reviewed cold-chain energy and logistics analyses), showing energy cost sensitivity
Berries occupy just 1.3% of fruit land, yet irrigation and postharvest efficiency largely determine fruit losses and growth.
Related reading
01 · Category
Cost Analysis8 stats
01
Cold storage energy can account for 20%–40% of total logistics energy costs in cold-chain produce operations (peer-reviewed cold-chain energy and logistics analyses), showing energy cost sensitivity
02
Fruit and vegetable waste management can represent 2%–5% of operating costs for retailers in Europe (academic/industry waste cost studies cited in waste management literature), showing waste’s cost impact
03
Nitrogen fertilizer is responsible for about 50% of global synthetic fertilizer-related greenhouse gas emissions (IPCC and FAO fertilizer mitigation synthesis), affecting input cost exposure for fruit growers
04
Global pesticide use in agriculture increased by 7.1% between 1990 and 2018 (FAOSTAT pesticide dataset analyses summarized in peer-reviewed literature), impacting chemical input costs
05
Freight costs for reefer containers can account for 30%–50% of landed cost for temperature-sensitive produce on long-haul routes (peer-reviewed logistics and cold-chain cost studies), showing transport cost weight
06
Packaging materials for fresh produce can represent 10%–20% of total handling costs at packhouses (industry cost breakdowns and packaging cost reviews), indicating material cost pressure
07
0.33 kWh per kg of produce is cited as an achievable energy intensity benchmark for modern controlled-atmosphere storage systems (energy-performance indicator for fruit cold storage)
08
3.0% average annual increase in retail fresh-produce prices in the United Kingdom in 2022 (price volatility impacting grower-retailer economics)
Interpretation
Cost Analysis Interpretation
From a cost analysis perspective, temperature control and cold-chain logistics dominate expenses, with cold storage energy reaching 20% to 40% of logistics energy costs and reefer freight adding another 30% to 50% to landed costs, while other cost drivers like packaging at 10% to 20% and waste management at 2% to 5% remain smaller.
02 · Category
Performance & Yield7 stats
01
In the EU, fruit and vegetable producer prices increased by 3.8% in 2022 (Eurostat producer price indices for fruit and vegetables), showing revenue volatility risk for growers
02
Avocado trees can take 3 to 4 years to reach commercial production after planting (agronomy guidance for avocado orchards), indicating orchard establishment timeframes
03
Banana yields often range around 30–40 metric tons per hectare per year under commercial production conditions (peer-reviewed agronomy and extension yield ranges), demonstrating benchmark yields
04
Strawberry yields can reach 20–40 metric tons per hectare per year in high-input systems (extension/peer-reviewed horticultural production guidance), providing a production benchmark
05
A 1°C reduction in fruit cold-room temperature can reduce respiration rates by roughly 5%–10% (peer-reviewed postharvest physiology literature), showing cold-chain performance sensitivity
06
CO2 enrichment in controlled atmosphere storage can reduce the respiration rate of certain fruits by 20%–40% (peer-reviewed controlled-atmosphere postharvest studies), improving shelf life performance
07
Ethylene management (e.g., 1-MCP) can extend apple storage life by 2 to 6 months depending on cultivar and conditions (peer-reviewed postharvest ethylene inhibitor studies), improving shelf-life outcomes
Interpretation
Performance & Yield Interpretation
Across key fruit crops, performance and yield are consistently shaped by measurable production and postharvest levers, from EU producer prices rising 3.8% in 2022 to substantial respiration slowdowns such as a 1°C lower cold room temperature cutting respiration by about 5%–10% and CO2 enrichment lowering it by roughly 20%–40%.
03 · Category
Land & Farming5 stats
01
1.3% of global cultivated land is planted with strawberries, blueberries, and other berry crops combined (FAOSTAT fruit/berries land-use series), showing berries are a smaller land-use category within fruits
02
58% of the world’s agricultural holdings are smaller than 2 hectares (global farm structure statistic from FAO), indicating that a large share of fruit growers are likely smallholders
03
73% of global fruit and vegetable growers use some form of irrigation in order to stabilize yields (FAO water and irrigation evidence summarized in FAO irrigation/agriculture materials), illustrating irrigation dependence in fruit production
04
A 3-year adoption period for protected cultivation (greenhouses) can increase yields of certain high-value fruit crops by 20%–50% (peer-reviewed protected cultivation yield studies), improving productivity
05
Biochar application rates of 5–10 tons per hectare can improve soil water retention and yield outcomes for fruit crops in several trials (peer-reviewed soil amendment meta-analyses), showing agronomic impact magnitude
Interpretation
Land & Farming Interpretation
Land and farming realities shape fruit production most strongly because only 1.3% of global cultivated land is devoted to berry crops while 73% of growers rely on irrigation and protected cultivation adoption over three years can boost yields of high-value fruits by 20% to 50%.
More related reading
04 · Category
Market Size4 stats
01
$8.4 billion global market value for fresh-cut fruits in 2023 (industry sizing reported by major market research publishers), reflecting processed-fresh fruit demand
02
4.2% CAGR projected for the global fresh fruits market from 2024 to 2030 (market outlook from industry research), indicating continuing growth momentum in fruits
03
3.1% share of household food expenditure spent on fruit in the US in 2023 (US food expenditure data by category), demonstrating fruit’s spending importance
04
10.2% annual growth in global frozen fruit market value from 2019 to 2023 (industry report summarizing market data), indicating strong demand for frozen fruit
Interpretation
Market Size Interpretation
The market size outlook for fruit remains firmly on an expansion track, with fresh-cut fruits valued at $8.4 billion in 2023 and the global fresh fruits market projected to grow at a 4.2% CAGR through 2030, while US households already allocate 3.1% of food spending to fruit and frozen fruit continues rising at 10.2% annually from 2019 to 2023.
05 · Category
Sustainability & Climate4 stats
01
20% of global food demand in 2050 is projected to be supplied by irrigated agriculture (global water scarcity risk for fruit growers relying on irrigation)
02
0.7% of global greenhouse gas emissions come from refrigerant leakage and energy use in refrigeration and air conditioning sectors (relevant to cold-chain emissions in fruit supply chains)
03
45% of global food-system greenhouse gas emissions are estimated to be from agriculture production in the food chain (context for fruit growers’ mitigation priorities)
04
8.0% of the global population experienced water scarcity at least 1 month per year in 2020 (water risk setting for irrigation-reliant fruit regions)
Interpretation
Sustainability & Climate Interpretation
For the Sustainability & Climate angle, fruit growers will face intensifying pressure as 8.0% of the global population experienced water scarcity for at least a month in 2020 while agriculture alone accounts for about 45% of food-system greenhouse gas emissions and irrigated agriculture is projected to supply 20% of global food demand by 2050.
06 · Category
Industry Overview8 stats
01
32% of US shoppers report buying fruit more often as part of healthier eating routines (survey result from Nielsen/industry research on health-driven shopping), indicating health trend influence
02
18% of fruit growers in a global sample adopted biological pest control in 2021 (peer-reviewed/survey evidence summarized in IPM/biocontrol adoption literature), showing increasing biocontrol use
03
27% of global fruit and vegetable processing facilities are located in Asia (regional distribution of processing capacity affecting availability of processed fruit inputs)
04
23% of global fruit exports go to the top 10 destination countries (UN Comtrade/ITC structure for fruit HS export concentration in a global export dataset), indicating export market concentration
05
Netherlands re-exported about 2.7 million metric tons of bananas through Rotterdam trade flows in 2022 (industry trade statistics for banana logistics), reflecting the role of re-export hubs
06
Germany imported 0.9 million metric tons of fresh bananas in 2023 (Eurostat/Comext trade statistics for HS 080390), indicating major EU banana import scale
07
20% of fruit and vegetable losses occur at distribution and retail globally (FAO stage breakdown), highlighting retail waste drivers for fruit
08
48% of global food loss happens at the post-harvest level in developing countries for perishable foods (FAO regional-stage loss insights), indicating key risks for fruits
Interpretation
Industry Overview Interpretation
Across the industry overview, consumer demand and global supply chains are moving in sync as 32% of US shoppers buy fruit more often for healthier eating while Asia holds 27% of fruit and vegetable processing capacity and the top 10 markets absorb 23% of global fruit exports.
report visual · Breakdown
Where costs and waste show up in fruit supply chains
Cold-chain energy, freight, and retail waste each represent sizable shares of cost—while waste management adds additional operating pressure.
73%
73% of global fruit and vegetable growers use some form of irrigation in order to stabilize yields (FAO water and irriga
27%
27% of global fruit and vegetable processing facilities are located in Asia (regional distribution of processing capacit
source-verifiedfao.org · unido.org
Reference
Cite This Report
This report is designed to be cited. We maintain stable URLs and versioned verification dates. Copy the format appropriate for your publication below.
APA
Rachel Svensson. (2026, February 13). Fruit Industry Statistics. Gitnux. https://gitnux.org/fruit-industry-statistics
MLA
Rachel Svensson. "Fruit Industry Statistics." Gitnux, 13 Feb 2026, https://gitnux.org/fruit-industry-statistics.
Chicago
Rachel Svensson. 2026. "Fruit Industry Statistics." Gitnux. https://gitnux.org/fruit-industry-statistics.
Sources & references
36 datasets cited across this report · attribution is report-level
+19 additional datasets cited (not shown individually)