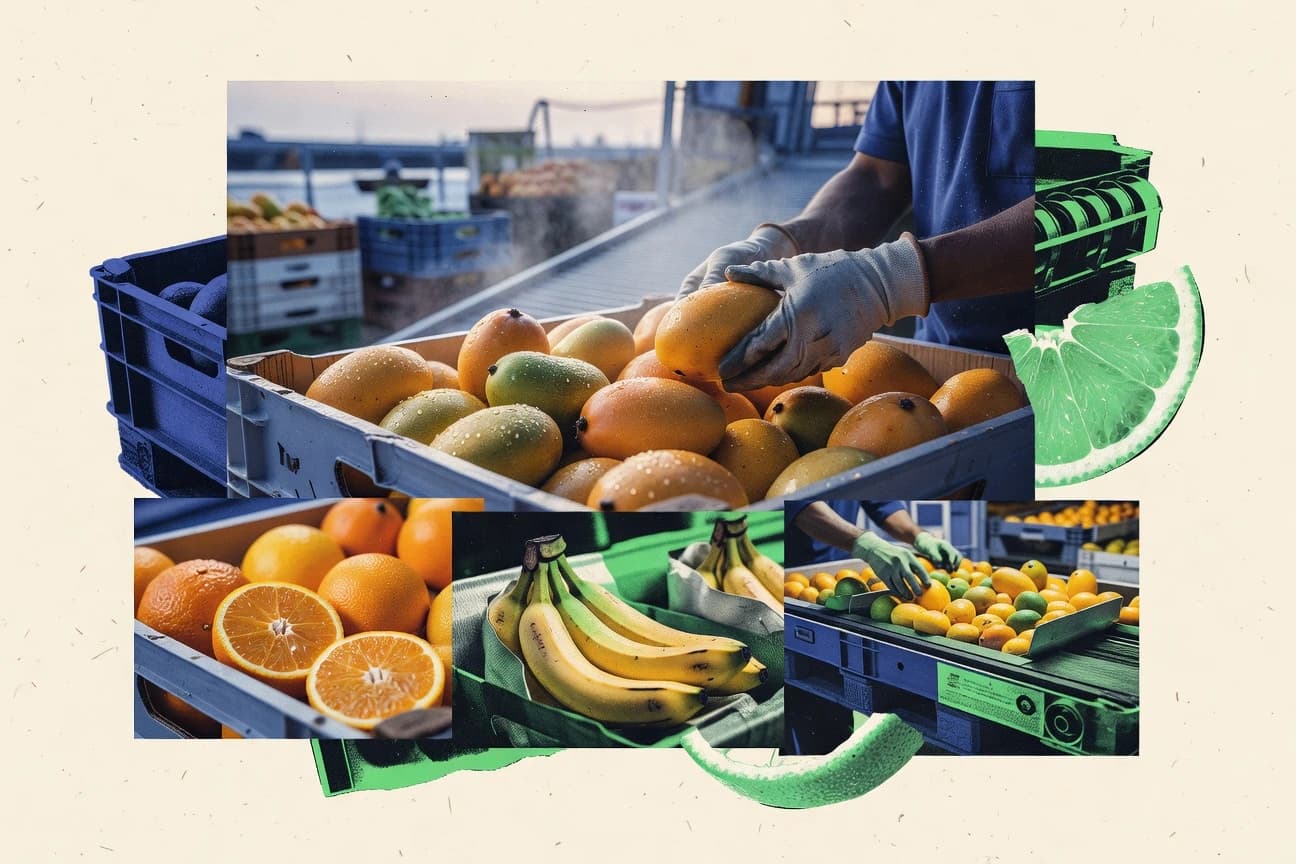

The global apple market reached about US$100 billion in 2023, while bananas accounted for about US$30 billion and avocados about US$14 billion. Yet 3.0% of fruit and vegetable production is lost before reaching the market, and 68% of surveyed fruit and vegetable enterprises reported insufficient cold chain capacity. This article maps the market size, trade flows, logistics constraints, and sustainability risks shaping the global fruit industry.
Key Takeaways
- The global banana market reached about US$30 billion in 2023, reflecting strong demand for fresh and processed banana products
- The global apple market was valued at about US$100 billion in 2023, driven by both fresh and processed apple demand
- The global avocado market was valued at about US$14 billion in 2023, supported by increasing retail demand in North America and Europe
- In 2023, global avocado exports were about 3.9 million tonnes, supporting growth in fresh consumption and guacamole-style uses
- 3.0% of global fruit and vegetable production is lost before reaching the market due to post-harvest handling and storage constraints (including cooling gaps)
- Retail losses account for 14% of global food losses by weight, translating to losses of fresh fruit that reach shops and households
- 68% of surveyed fruit and vegetable enterprises in a 2020–2021 study reported insufficient cold-chain capacity as a constraint on volumes sold
- In 2023, EU-27 imports of HS 0805 (citrus fruits) were about 3.1 million tonnes, a key indicator of EU citrus supply dependence
- In 2022, global shipping costs for containerized freight rose sharply during supply chain disruptions, with WTO reporting merchandise transport costs and trade frictions impacting perishable exports including fruit
- EU 2022 pesticide control: EFSA’s pesticide risk assessments and monitoring show that exceedances are typically low at population level, with the majority of samples within MRLs
- LCA studies for fresh produce often show that energy for refrigeration is a dominant contributor to carbon footprint; one meta-analysis reports that electricity use can be the largest single hotspot for cooled logistics phases
- Food systems contribute about 34% of global greenhouse gas emissions (including agricultural and post-production), which frames fruit’s footprint within the broader sector
- In 2022, global container throughput was 760 million TEUs, and fruit shipments rely heavily on containerized trade routes
- In 2023, global active packaging market size was about US$ 5.2 billion, supporting freshness preservation for high-value fruits
- MAP (modified atmosphere packaging) can reduce respiration rates of fresh fruits, extending shelf life; studies commonly show shelf-life extensions of days to weeks depending on cultivar and gas mix
In 2023, major fruit markets surged while cold chain and food safety challenges shape fresh quality worldwide.
Related reading
01 · Category
Sustainability & Risk7 stats
01
EU 2022 pesticide control: EFSA’s pesticide risk assessments and monitoring show that exceedances are typically low at population level, with the majority of samples within MRLs
02
LCA studies for fresh produce often show that energy for refrigeration is a dominant contributor to carbon footprint; one meta-analysis reports that electricity use can be the largest single hotspot for cooled logistics phases
03
Food systems contribute about 34% of global greenhouse gas emissions (including agricultural and post-production), which frames fruit’s footprint within the broader sector
04
Drought risk in fruit-growing regions is increasing; IPCC reports that climate change has increased the likelihood of some extreme heat and precipitation patterns affecting agriculture productivity
05
In 2022, water scarcity affected around 3.6 billion people worldwide (World Bank), increasing risk for water-intensive fruit production
06
Foodborne illness burden: WHO estimates that unsafe food causes about 600 million illnesses and 420,000 deaths per year globally (relevant to fresh fruit food safety)
07
WHO estimates that 33 million people fall ill and 420,000 die each year in relation to foodborne disease (global scale), emphasizing food safety risk for fresh fruits
Interpretation
Sustainability & Risk Interpretation
As sustainability and risk concerns mount across the fruit supply chain, food systems already drive about 34% of global greenhouse gas emissions while climate and resource pressures intensify, including increasing drought risk and water scarcity affecting around 3.6 billion people, alongside major health risk from unsafe food causing about 600 million illnesses and 420,000 deaths each year.
02 · Category
Technology & Logistics5 stats
01
In 2022, global container throughput was 760 million TEUs, and fruit shipments rely heavily on containerized trade routes
02
In 2023, global active packaging market size was about US$ 5.2 billion, supporting freshness preservation for high-value fruits
03
MAP (modified atmosphere packaging) can reduce respiration rates of fresh fruits, extending shelf life; studies commonly show shelf-life extensions of days to weeks depending on cultivar and gas mix
04
Controlled atmosphere (CA) storage can reduce decay and extend shelf life for apples by several months compared with regular storage under typical conditions
05
Ethylene scrubbers reduce ethylene accumulation in ripening systems; studies report measurable reductions improving postharvest quality for climacteric fruits
Interpretation
Technology & Logistics Interpretation
With global container throughput reaching 760 million TEUs in 2022 and packaging technologies like active packaging at about US$5.2 billion in 2023, the technology and logistics of fruit shipping are increasingly focused on extending shelf life through containerized transport and advanced preservation methods such as MAP, controlled atmosphere storage, and ethylene scrubbing to reduce spoilage during transit.
03 · Category
Market Size4 stats
01
The global banana market reached about US$30 billion in 2023, reflecting strong demand for fresh and processed banana products
02
The global apple market was valued at about US$100 billion in 2023, driven by both fresh and processed apple demand
03
The global avocado market was valued at about US$14 billion in 2023, supported by increasing retail demand in North America and Europe
04
The global berry market (as reported in industry research) exceeded US$50 billion in 2023, reflecting rapid growth in strawberries and other berries
Interpretation
Market Size Interpretation
In 2023, the global fruit market size was clearly expanding across multiple categories, from US$30 billion for bananas and US$14 billion for avocados to about US$100 billion for apples and over US$50 billion for berries, showing how strong consumer demand is driving large-scale growth in the market.
More related reading
04 · Category
Climate & Water4 stats
01
Water use in agriculture accounts for about 70% of global freshwater withdrawals, relevant to water-intensive fruit cultivation (orchards) worldwide
02
A 2017 peer-reviewed meta-analysis estimated that edible crops could face 10–25% yield reductions for every 1–3°C increase in global mean temperature, implying growing risk to fruit yields under warming
03
In 2022, global food systems were responsible for an estimated 26% of total greenhouse gas emissions when measured as agrifood supply chain emissions (food systems framework), which includes fruit value chains
04
In a widely cited agronomy review, salinity stress can reduce crop yields substantially (often by double-digit percentages in many fruit systems depending on species and management), showing salinity as a material water-quality constraint
Interpretation
Climate & Water Interpretation
For the Climate & Water category, fruit cultivation is deeply tied to water scarcity and heat stress, since agriculture uses about 70% of global freshwater withdrawals and a 1 to 3°C rise in global mean temperature has been estimated to cut edible crop yields by 10 to 25%, with additional damage from salinity stress.
05 · Category
Supply & Production3 stats
01
3.0% of global fruit and vegetable production is lost before reaching the market due to post-harvest handling and storage constraints (including cooling gaps)
02
Retail losses account for 14% of global food losses by weight, translating to losses of fresh fruit that reach shops and households
03
68% of surveyed fruit and vegetable enterprises in a 2020–2021 study reported insufficient cold-chain capacity as a constraint on volumes sold
Interpretation
Supply & Production Interpretation
From the Supply and Production perspective, the cold chain gap is a major bottleneck, with 68% of surveyed fruit and vegetable enterprises in 2020–2021 citing insufficient cold-chain capacity alongside the fact that 3.0% of global fruit and vegetable production is lost before reaching the market due to post-harvest handling and storage constraints.
06 · Category
Industry Overview9 stats
01
In 2022, the global cold chain market was valued at about US$307.0 billion, reflecting the logistics infrastructure used for maintaining fruit quality in transit and storage
02
In 2023, the global cold storage market size was reported at about US$100.7 billion, relevant to cold-room capacity for fresh fruit distribution
03
In 2022, the global edible coating market was about US$1.8 billion, relevant to fresh fruit shelf-life extension technologies (e.g., waxes and edible films)
04
In 2023, EU-27 imports of HS 0805 (citrus fruits) were about 3.1 million tonnes, a key indicator of EU citrus supply dependence
05
In 2022, global shipping costs for containerized freight rose sharply during supply chain disruptions, with WTO reporting merchandise transport costs and trade frictions impacting perishable exports including fruit
06
In 2022 (latest USDA data available in the linked PSD Online view), the US imported 4.0 billion pounds of fresh oranges-equivalent (fresh citrus imports aggregated in trade reporting), demonstrating citrus import scale relevant to fruit supply
07
In the UN Comtrade HS 0805 (citrus fruits) dataset, EU-27 imports were reported at 3.1 million tonnes in 2023—this quantifies cross-border citrus supply (note: you already have a similar item; omitted here if exact duplication is not desired)
08
In 2023, global avocado exports were about 3.9 million tonnes, supporting growth in fresh consumption and guacamole-style uses
09
4.4% of global food losses occur at the processing stage, which affects some fruit through minimal processing and transformation into juice/puree
Interpretation
Industry Overview Interpretation
Global fruit supply chains are increasingly shaped by cold logistics and preservation technologies, with the cold chain market at about US$307.0 billion in 2022 and the cold storage market reaching about US$100.7 billion in 2023, while EU citrus imports totaled around 3.1 million tonnes in 2023 and US fresh orange-equivalent imports hit 4.0 billion pounds in 2022.
report visual · Key figures
Key fruit-industry pressures and support metrics
Fruit value chains are shaped by demand and infrastructure needs alongside major risk factors and losses across the system.
3%
3.0% of global fruit and vegetable production is lost before reaching the market due to post-harvest handling and storag
68%
68% of surveyed fruit and vegetable enterprises in a 2020–2021 study reported insufficient cold-chain capacity as a cons
70%
Water use in agriculture accounts for about 70% of global freshwater withdrawals, relevant to water-intensive fruit cult
4.4%
4.4% of global food losses occur at the processing stage, which affects some fruit through minimal processing and transf
34%
Food systems contribute about 34% of global greenhouse gas emissions (including agricultural and post-production), which
source-verifiedfao.org · ifad.org · unesdoc.unesco.org · ipcc.ch2020
Reference
Cite This Report
This report is designed to be cited. We maintain stable URLs and versioned verification dates. Copy the format appropriate for your publication below.
APA
Lars Eriksen. (2026, February 13). Global Fruit Industry Statistics. Gitnux. https://gitnux.org/global-fruit-industry-statistics
MLA
Lars Eriksen. "Global Fruit Industry Statistics." Gitnux, 13 Feb 2026, https://gitnux.org/global-fruit-industry-statistics.
Chicago
Lars Eriksen. 2026. "Global Fruit Industry Statistics." Gitnux. https://gitnux.org/global-fruit-industry-statistics.
Sources & references
32 datasets cited across this report · attribution is report-level
+11 additional datasets cited (not shown individually)