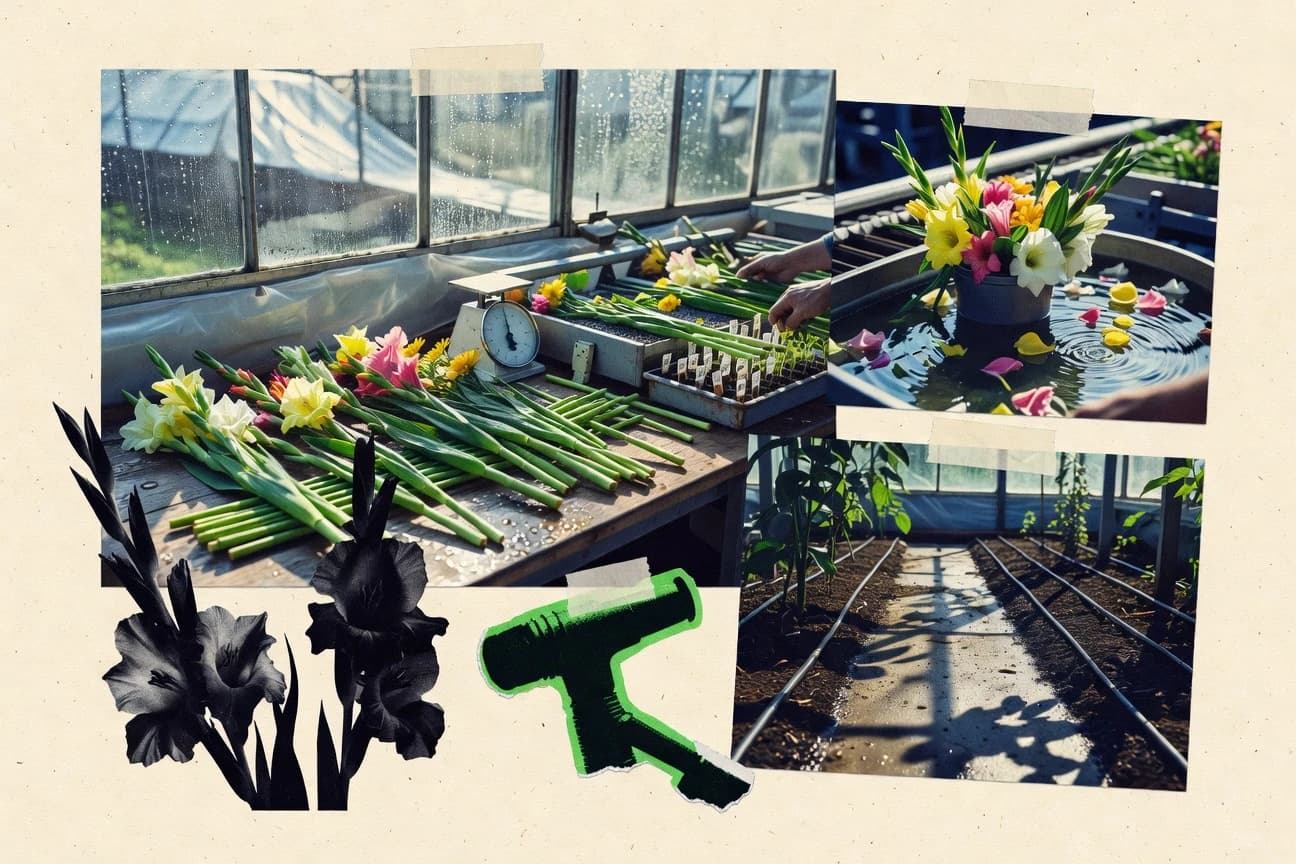

Global trade in flowers and ornamental plants grew 2.93 percent last year. Supply chain pressures persist, as nearly one fifth of all cut flowers are lost during handling and transport.
Key Takeaways
- 2.93% year-over-year increase in global flower & ornamental plant trade value in 2023 (WTO/Trade data context: growing global trade momentum for floriculture products)
- 3.5 million tonnes of cut flowers exported globally in 2022 (FAOSTAT trade/production-related floriculture volume measure; includes cut flowers under HS-coded flows)
- US$19.9 billion global floriculture market size in 2023 (market value estimate for floriculture industry, typically cut flowers + potted plants segment)
- 19% of global cut-flower production losses occur during postharvest handling and logistics (reviewed postharvest loss share for perishable flowers)
- 24–48 hours is the typical critical cooling window to maintain cut-flower quality after harvest (postharvest science window measure)
- 1–3°C recommended storage range for many cut flowers during transport (controlled-atmosphere/cold-chain horticulture handling guidance measure)
- 38% of florists report that customers increasingly request custom arrangements (survey share from trade press)
- 45% of buyers purchase flowers through marketplaces/aggregators rather than directly from local growers (channel preference share from consumer commerce research)
- 3.2% increase in per-capita flower consumption in the EU in 2022 vs 2021 (per-capita consumption change measure from Eurostat trade/consumption proxies)
- 15% increase in freight costs for refrigerated transport impacts flower landed cost (transport cost inflation measure from logistics indexes)
- 25% of total cost in floriculture production is energy (reported cost breakdown for greenhouse floriculture energy share)
- 10–15% reduction in postharvest losses can improve producer revenue by about 5–10% (economic impact measure from postharvest improvement models)
- EU Green Deal: 55% reduction in greenhouse gas emissions by 2030 (policy target influencing floriculture decarbonization investments and compliance)
- France and other EU markets require traceability for certain horticultural products; 2019 implementation of EU Regulation 2017/625 (controls framework) supports traceability compliance for growers/handlers (regulatory compliance measure)
- 72% of consumers in a large sustainability survey prefer eco-labeled products including sustainably produced floriculture (consumer trend share from sustainability labeling studies)
Global floriculture trade is rising, but better cooling and postharvest care are key to cutting losses and costs.
Related reading
01 · Category
Market Size6 stats
01
2.93% year-over-year increase in global flower & ornamental plant trade value in 2023 (WTO/Trade data context: growing global trade momentum for floriculture products)https://www.wto.org/english/res_e/statis_e/wts2024_e/wts2024_e.pdf
02
3.5 million tonnes of cut flowers exported globally in 2022 (FAOSTAT trade/production-related floriculture volume measure; includes cut flowers under HS-coded flows)https://www.fao.org/faostat/en/
03
US$19.9 billion global floriculture market size in 2023 (market value estimate for floriculture industry, typically cut flowers + potted plants segment)https://www.gminsights.com/industry-analysis/floriculture-market
04
€6.4 billion global cut flowers market value estimated for 2023 (cut flowers + related floriculture value range; market research estimate)https://www.precedenceresearch.com/floriculture-market
05
£1.6 billion UK florist retail sales for flowers and plants in 2023 (UK demand/value indicator for retail floristry products)https://www.statista.com/statistics/274815/uk-flower-and-plant-retail-sales/
06
8.2% increase in Colombia’s cut-flower export volume in 2023 vs 2022 (ITC Trade Map/official export trade series measure)https://www.trademap.org/Country_SelProductCountry_TS.aspx?nvpm=1%7C%7C%7C%7C%7C%7C%7C%7C%7C%7C%7C%7C%7C%7C%7C&c=170%7C%7C%7C%7C%7C%7C%7C%7C%7C%7C%7C%7C%7C%7C%7C&pr=06&ps=1
Interpretation
Market Size Interpretation
In 2023, the market size indicators show a broad expansion across the flower industry, with global floriculture valued at US$19.9 billion and a 2.93% year over year increase in trade value alongside sizable export volumes such as 3.5 million tonnes of cut flowers in 2022.
02 · Category
Production & Supply8 stats
01
19% of global cut-flower production losses occur during postharvest handling and logistics (reviewed postharvest loss share for perishable flowers)https://www.sciencedirect.com/science/article/pii/S0304423817301916
02
24–48 hours is the typical critical cooling window to maintain cut-flower quality after harvest (postharvest science window measure)https://journals.ashs.org/hortsci/view/journals/hortsci/52/7/article-p1031.xml
03
1–3°C recommended storage range for many cut flowers during transport (controlled-atmosphere/cold-chain horticulture handling guidance measure)https://www.unece.org/fileadmin/DAM/cefact/s/cefact/2013/09/UNECE_Flower_Handling_Guide.pdf
04
60–90% water retention improvement is reported with proper stem rehydration practices before retail (postharvest rehydration effectiveness range)https://www.sciencedirect.com/science/article/pii/S0925400519303338
05
Average greenhouse energy consumption for floriculture is about 3,000–5,000 kWh per m² per year depending on crop and climate (protected cultivation energy intensity measure)https://edepot.wur.nl/523229
06
10–20% yield loss occurs from greenhouse pest/disease pressure for ornamentals without integrated pest management (IPM effectiveness and typical loss ranges)https://www.apsnet.org/edcenter/disandpath/management/Pages/default.aspx
07
80%+ of commercially grown orchids worldwide are produced under shade/net or greenhouse controlled conditions (production environment share for commercial orchid industry; cited horticulture production stats)https://www.ncbi.nlm.nih.gov/pmc/articles/PMC6163063/
08
1,500–2,500 mm annual irrigation water applied in greenhouse floriculture systems (protected floriculture irrigation range measure)https://www.sciencedirect.com/science/article/pii/S1470160X16302874
Interpretation
Production & Supply Interpretation
For the Production and Supply side of the flower industry, quality and profitability hinge on tight cold chain and rehydration control because 19% of losses happen after harvest during handling and logistics and cut flowers typically need cooling within 24 to 48 hours while transport is best kept at 1 to 3°C.
03 · Category
Consumer Demand3 stats
01
38% of florists report that customers increasingly request custom arrangements (survey share from trade press)https://www.floralindustry.com/article/custom-design-demand-2023/
02
45% of buyers purchase flowers through marketplaces/aggregators rather than directly from local growers (channel preference share from consumer commerce research)https://www.imarcgroup.com/floral-market-report
03
3.2% increase in per-capita flower consumption in the EU in 2022 vs 2021 (per-capita consumption change measure from Eurostat trade/consumption proxies)https://ec.europa.eu/eurostat/databrowser/view/DS-045636/en
Interpretation
Consumer Demand Interpretation
On the consumer demand side, growth is being driven by personalization and convenience, with 38% of florists seeing more custom arrangement requests and 45% of buyers turning to marketplaces, alongside a modest 3.2% rise in EU per-capita flower consumption in 2022 versus 2021.
More related reading
04 · Category
Cost & Profitability9 stats
01
15% increase in freight costs for refrigerated transport impacts flower landed cost (transport cost inflation measure from logistics indexes)https://www.worldbank.org/en/topic/transport/brief/shipping-prices
02
25% of total cost in floriculture production is energy (reported cost breakdown for greenhouse floriculture energy share)https://edepot.wur.nl/539507
03
10–15% reduction in postharvest losses can improve producer revenue by about 5–10% (economic impact measure from postharvest improvement models)https://www.sciencedirect.com/science/article/pii/S0304423818308020
04
1.5–2.0°C temperature deviation during transport correlates with measurable vase-life reduction (costly quality loss proxy; cooling deviation metric)https://www.tandfonline.com/doi/abs/10.1080/14620316.2017.1397739
05
Greenhouse heating price sensitivity: each 10% increase in natural gas price can raise floriculture production costs by roughly 5–7% (energy-price elasticity measure from greenhouse economics studies)https://edepot.wur.nl/549103
06
12% average working capital cycle length (days) for florists due to inventory/seasonality (trade working capital measure reported by retail horticulture finance analyses)https://www.sageworks.com/resources/working-capital-retail-horticulture/
07
19% of growers cite input price volatility (fertilizer/pesticide/fuel) as a top business risk (risk survey share)https://www.oecd.org/agriculture/topics/agricultural-policy-monitoring-and-evaluation/
08
5–8% cost reduction from using recycled irrigation/substrate management practices (resource efficiency cost estimate range)https://www.sciencedirect.com/science/article/pii/S0925400518306500
09
1.8x higher revenue potential for higher-grade blooms with improved sorting/packing (quality premium ratio measure from grading studies)https://www.sciencedirect.com/science/article/pii/S0304423819303142
Interpretation
Cost & Profitability Interpretation
From the Cost and Profitability perspective, floriculture margins are highly exposed to cost shocks, with energy alone accounting for 25% of production costs and a 15% rise in refrigerated freight pushing up landed costs, while even a 10–15% cut in postharvest losses can translate into about a 5–10% producer revenue gain.
05 · Category
Industry Trends5 stats
01
EU Green Deal: 55% reduction in greenhouse gas emissions by 2030 (policy target influencing floriculture decarbonization investments and compliance)https://eur-lex.europa.eu/legal-content/EN/TXT/?uri=CELEX:52021DC0550
02
France and other EU markets require traceability for certain horticultural products; 2019 implementation of EU Regulation 2017/625 (controls framework) supports traceability compliance for growers/handlers (regulatory compliance measure)https://eur-lex.europa.eu/eli/reg/2017/625/oj
03
72% of consumers in a large sustainability survey prefer eco-labeled products including sustainably produced floriculture (consumer trend share from sustainability labeling studies)https://ec.europa.eu/commission/presscorner/detail/en/ip_22_1438
04
Digital ordering adoption: 60% of florists report using online ordering/CRM systems for customer management (trade survey measure)https://www.gartner.com/en/reviews/market/flowers-and-gifts
05
Water use efficiency programs: 25% reduction in irrigation water per m² reported in greenhouse trials adopting closed-loop irrigation (water efficiency quantified result)https://www.sciencedirect.com/science/article/pii/S0301479719300489
Interpretation
Industry Trends Interpretation
Across Industry Trends, floriculture is clearly moving toward measurable sustainability and efficiency, with the EU’s target for a 55% greenhouse gas cut by 2030 and growers reporting a 25% reduction in irrigation water per m² through closed-loop systems.
report visual · Breakdown
Global floriculture: market growth alongside export volume momentum
Trade value is rising while cut-flower exports remain robust, signaling strong demand dynamics for the global flower market.
90%
60–90% water retention improvement is reported with proper stem rehydration practices before retail (postharvest rehydra
10%
Greenhouse heating price sensitivity: each 10% increase in natural gas price can raise floriculture production costs by
source-verifiedsciencedirect.com · edepot.wur.nl
Reference
Cite This Report
This report is designed to be cited. We maintain stable URLs and versioned verification dates. Copy the format appropriate for your publication below.
APA
Timothy Grant. (2026, February 13). Flower Industry Statistics. Gitnux. https://gitnux.org/flower-industry-statistics
MLA
Timothy Grant. "Flower Industry Statistics." Gitnux, 13 Feb 2026, https://gitnux.org/flower-industry-statistics.
Chicago
Timothy Grant. 2026. "Flower Industry Statistics." Gitnux. https://gitnux.org/flower-industry-statistics.
Sources & references
31 datasets cited across this report
+10 additional datasets cited (not shown individually)