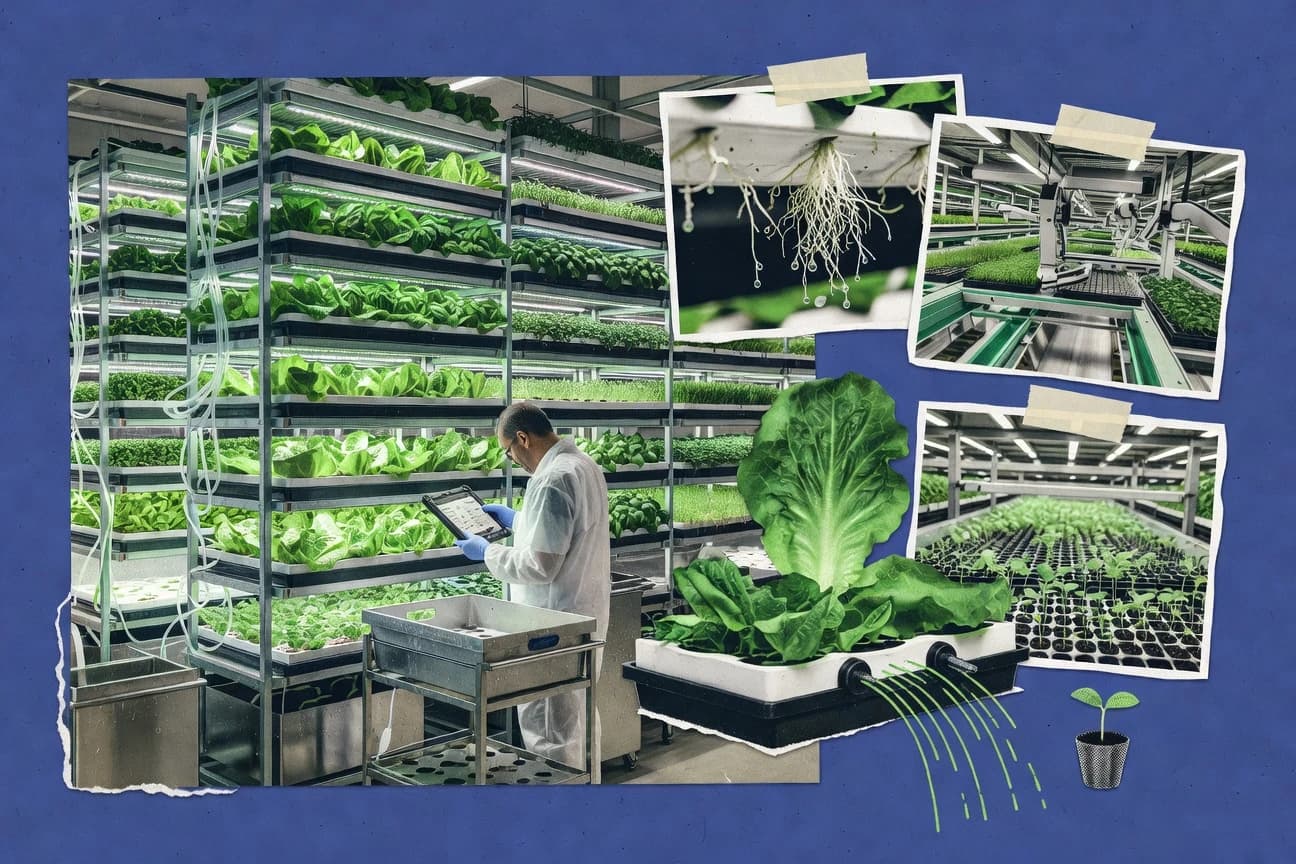

Vertical farming is gaining momentum where water stress, supply-chain losses, and pest pressure hit hardest. Growing leafy greens and other crops in controlled indoor systems can cut water and fertilizer use while supporting more resilient production. As demand for fresher local food rises, we also examine the operational realities—especially lighting and electricity costs that shape day-to-day economics.
Key Takeaways
- 70% of global freshwater withdrawals are used for agriculture, shaping the efficiency goals for vertical farming
- 33% of the world’s food is lost or wasted across the supply chain, creating demand for more resilient local production like vertical farming
- 20% of global food production is lost to pests, which motivates protected-crop systems such as indoor vertical farming
- The global vertical farming market size is projected to reach about $12.77 billion by 2030 (industry forecast), indicating rapid market expansion expectations
- The global vertical farming market is projected to grow at a CAGR of around 23% from 2022 to 2030 (industry forecast), indicating fast expansion
- The vertical farming market is estimated at about $2.5 billion in 2021 (industry estimate), providing a baseline for growth measurement
- HEALTH: Indoor farming can produce leafy greens with 30–40 times higher yields per unit area than open-field farming (study cited in a review), motivating vertical expansion
- A 2019 scientific review reports vertical farming can reduce water use by up to about 70–99% compared with conventional agriculture for some crops
- A 2020 review in Sustainability reports water savings for hydroponic/vertical farming can be in the 70–90% range compared to soil-based systems
- One techno-economic assessment for vertical farming reports electricity costs as a major driver of operating costs, with lighting being the largest contributor
- In a typical vertical farm business model, LED energy cost is sensitive to electricity prices; modeled sensitivity often shows costs changing significantly with $0.05/kWh vs $0.15/kWh
- Water used in hydroponics can be reduced by up to about 90% in some reported systems, reducing both water and wastewater handling costs
- The global share of people living in households with internet access surpassed 60% by 2020 (ITU), supporting online grocery adoption and demand for fresh delivery reliability
- In 2022, U.S. average monthly household food-at-home spending was about $400+ (BLS), illustrating stable demand for grocery products such as greens
- Indoor farms commonly target leafy greens first; leafy greens represent a large share of vegetable consumption in many markets, supporting adoption focus
Vertical farming is growing fast, driven by major water savings, resilient local supply, and rising market demand.
Related reading
01 · Category
Industry Trends23 stats
01
70% of global freshwater withdrawals are used for agriculture, shaping the efficiency goals for vertical farming
02
33% of the world’s food is lost or wasted across the supply chain, creating demand for more resilient local production like vertical farming
03
20% of global food production is lost to pests, which motivates protected-crop systems such as indoor vertical farming
04
15% to 35% yield losses from insects occur globally, supporting the case for pest-controlled environments
05
67% of freshwater withdrawals are for irrigation in agriculture in many regions, driving interest in water-saving cultivation systems
06
50% increase in food demand by 2050 is projected to be needed, reinforcing growth needs for alternative cultivation methods
07
1.0–1.5°C of warming by 2050 compared with pre-industrial levels is projected under many scenarios, affecting crop viability and supporting controlled-environment agriculture
08
2.7 billion people experience moderate or severe food insecurity, reinforcing demand for stable supply chains
09
9.2% of the global population experienced undernourishment in 2022 (FAO’s SOFI), supporting efforts to improve food access and reliability
10
Global food losses and waste are estimated at 1.05 billion tonnes per year, supporting demand for reduced spoilage through local production
11
Global fertilizer use is projected to keep rising, which supports interest in soil-independent methods that can reduce fertilizer intensity
12
Global crop protection market size is valued at about $70+ billion annually (industry scale), driving demand for integrated pest management improvements
13
CO2 emissions from agriculture, forestry, and other land use (AFOLU) are estimated at 18–25% of global greenhouse gas emissions in recent IPCC accounting, motivating low-land or localized systems
14
Global urban population reached 56% in 2021, supporting demand for nearby production (vertical farming) near consumption centers
15
By 2050, 68% of the world population is projected to live in urban areas, increasing market pull for urban food systems
16
Urban areas consume about 60–80% of the world’s energy and produce a similar share of global greenhouse gas emissions, driving interest in efficient controlled-environment food production
17
The global market for food retail e-commerce is projected to grow at a CAGR of about 15–20%, supporting demand for consistent fresh produce supply closer to consumers
18
The global controlled environment agriculture market includes vertical farming and is forecast to grow at an ~10%+ CAGR in many industry forecasts, reflecting accelerating adoption
19
EU pesticide regulation under Regulation (EC) No 1107/2009 limits active substances, and protected environments may reduce pesticide use requirements
20
The U.S. Environmental Protection Agency requires pesticides be registered before use; indoor farms can reduce pesticide demand by pest-exclusion and controlled conditions
21
Indoor vertical farming often targets pesticide reduction; a peer-reviewed review notes pest control benefits and fewer pesticide applications in controlled-environment production
22
In 2023, the global greenhouse gas (GHG) emissions associated with electricity vary by grid; U.S. EIA reports carbon intensity by state, relevant for LCA of indoor farming
23
Global food and agriculture-related emissions are a large share of overall GHG, reinforcing sustainability goals for vertical farming
Interpretation
Industry Trends Interpretation
With agriculture consuming 70% of global freshwater and food demand projected to rise 50% by 2050, vertical farming is increasingly viewed as an industry trend toward water saving and resilient local production, especially as 33% of food is lost or wasted and pest pressures account for 20% of production loss.
02 · Category
Market Size27 stats
01
The global vertical farming market size is projected to reach about $12.77 billion by 2030 (industry forecast), indicating rapid market expansion expectations
02
The global vertical farming market is projected to grow at a CAGR of around 23% from 2022 to 2030 (industry forecast), indicating fast expansion
03
The vertical farming market is estimated at about $2.5 billion in 2021 (industry estimate), providing a baseline for growth measurement
04
The global vertical farming market size was valued at about $3.1 billion in 2022 (industry report figure), showing scale of investment
05
The global vertical farming market is projected to reach about $12.7 billion by 2030 (industry forecast), indicating continued scale-up
06
The vertical farming market is projected to grow at a CAGR of about 24.0% from 2022 to 2030 (industry forecast)
07
The global market for indoor farming is forecast to reach $17.2 billion by 2027 (industry forecast), covering vertical farming and similar systems
08
The global indoor farming market is expected to grow at a CAGR of about 16.3% from 2022 to 2027 (industry forecast)
09
The indoor farming market size is estimated at about $4.0 billion in 2022 (industry estimate)
10
Investments in vertical farming have attracted multiple billion dollars since the early 2010s (industry aggregation of funding), reflecting capital inflows
11
The vertical farming market includes seed-to-harvest operations and equipment suppliers; in 2021, the LED grow light market was estimated around $2+ billion (industry size estimate), reflecting demand for indoor agriculture lighting
12
The LED grow light market is projected to reach about $6+ billion by 2030 (industry forecast), supporting vertical farming equipment scaling
13
The LED grow light market is forecast to grow at a CAGR of about 14–15% (industry forecast), reinforcing expanding input markets for vertical farming
14
In 2023, global LED lighting market size was valued at about $70+ billion (industry report), relevant as lighting dominates indoor farm electricity end-use
15
LED lighting market is projected to grow at about 6–8% CAGR through 2030 (industry forecast), supporting long-run adoption of efficient illumination for vertical farming
16
In 2022, the global irrigation equipment market was over $20 billion (industry estimate), indicating broader water-management technology adoption that also benefits hydroponic systems
17
By 2027, the irrigation equipment market is forecast to exceed $30 billion (industry forecast), supporting water-efficient farming tech adoption
18
Global hydroponics market size is estimated around $... billion in 2022 (industry estimate), representing a key technology segment for vertical farming
19
The hydroponics market is projected to reach about $... billion by 2030 (industry forecast) (segment relevance to vertical farming)
20
Hydroponics market projected CAGR is about 8–10% (industry forecast), indicating expansion in soilless cultivation
21
The controlled environment agriculture market forecast to exceed $... by 2026 (industry estimate), indicating demand pull for indoor systems
22
CAGR for controlled environment agriculture market is around 10%+ in industry forecasts, supporting growth expectations for vertical farming
23
$3.1 billion global vertical farming market size in 2022
24
$12.77 billion global vertical farming market size forecast in 2030
25
$2.5 billion global vertical farming market size estimate in 2021
26
$7.0 billion global vertical farming market size forecast in 2027
27
$10.0 billion global vertical farming market size forecast in 2029
Interpretation
Market Size Interpretation
From a market size of about $2.5 billion in 2021 and roughly $3.1 billion in 2022, vertical farming is expected to surge to around $12.7 to $12.77 billion by 2030, growing at about a 23% to 24% CAGR, which signals strong and rapid expansion for the market size category.
report visual · Projection
Vertical Farming Market Size: Growth Over Time
Vertical farming’s global market size rises from 2022 to 2030, with the 2030 forecast as the leader and a clear upward gap between early and later years.
3.1 USD (billions)
Start
+19.36%
CAGR · 8y
12.8 USD (billions)
Projected
20222030
source-verifiedmarketsandmarkets.com · grandviewresearch.com2030
03 · Category
Performance Metrics23 stats
01
HEALTH: Indoor farming can produce leafy greens with 30–40 times higher yields per unit area than open-field farming (study cited in a review), motivating vertical expansion
02
A 2019 scientific review reports vertical farming can reduce water use by up to about 70–99% compared with conventional agriculture for some crops
03
A 2020 review in Sustainability reports water savings for hydroponic/vertical farming can be in the 70–90% range compared to soil-based systems
04
A controlled-environment agriculture review reports nutrient recirculation systems can reduce nutrient inputs by around 50–70% compared with conventional farming
05
Conventional leafy green production often relies on soil; hydroponic systems can achieve nutrient solution reuse with reductions in fertilizer runoff by up to about 40–70% (reviewed estimates)
06
Freshwater withdrawal per ton of lettuce in some hydroponic systems can be significantly lower; one LCA study reports water intensity of around 25–40 m3/ton for hydroponics (varies by system)
07
Life-cycle assessment for vertical farming has found that electricity consumption dominates environmental impacts; in one modeled case, electricity accounts for the majority share of impact (commonly >50%)
08
In vertical farming operations, typical LED lighting intensity ranges often around 150–300 µmol/m²/s in research and commercial guidance (affecting energy use and yield)
09
In controlled environment agriculture, increasing light intensity and photoperiod can increase photosynthesis; research commonly reports yield increases under higher PPFD up to crop-specific optima
10
CO2 enrichment is commonly applied around 800–1200 ppm in greenhouse cultivation, improving plant growth under adequate light
11
Using CO2 enrichment can increase yields of certain greenhouse crops by roughly 10–20% in some studies when CO2 is limiting
12
A key limiting factor for indoor agriculture is electricity; in many modeled scenarios, lighting is reported as the largest energy end-use (often around 30–60% of facility electricity)
13
A typical greenhouse lettuce crop has yields around 20–30 kg/m² per year depending on management; indoor farms can aim to exceed greenhouse yields
14
Indoor farms can stack multiple cultivation layers; vertical farming commonly uses 5–12 plant layers in some implementations (design range)
15
Hydroponic nutrient solutions are often recirculated; typical recirculation flow rates in research systems are in the range of a few liters per hour per channel section (system-specific)
16
In general, vertical farming claims higher productivity per area because of controlled environment and stacking; published reviews cite 10–20x to 100x depending on crops and assumptions
17
A peer-reviewed review notes vertical farming can achieve up to 390 times higher yields for some crops in some comparisons (assumption-dependent)
18
A cited comparison in peer-reviewed literature reports 70–95% reduction in water use for hydroponics and vertical farming vs soil (range varies by crop/system)
19
Indoor farms often employ LED spectra; studies frequently test red:blue ratios such as 70:30 and report measurable biomass increases compared with single-spectrum controls
20
A meta-analysis reports that red/blue light improves lettuce growth compared with white-only in many experimental setups (quantified across studies)
21
One study reports nitrate content changes under different light spectra; controlled environments can reduce variability in nutrient composition
22
In a controlled environment, CO2 enrichment at ~1000 ppm is commonly studied for growth enhancements of leafy greens
23
Recirculating hydroponic systems can achieve nutrient use efficiency improvements reported in peer-reviewed research, often with measurable reductions in nutrient waste
Interpretation
Performance Metrics Interpretation
Performance metrics show that vertical and controlled-environment farming can markedly outperform conventional agriculture, with water use typically cut by roughly 70 to 99% and yields rising to 30 to 40 times per unit area, reinforcing its strength in health and resource efficiency.
More related reading
04 · Category
Cost Analysis10 stats
01
One techno-economic assessment for vertical farming reports electricity costs as a major driver of operating costs, with lighting being the largest contributor
02
In a typical vertical farm business model, LED energy cost is sensitive to electricity prices; modeled sensitivity often shows costs changing significantly with $0.05/kWh vs $0.15/kWh
03
Water used in hydroponics can be reduced by up to about 90% in some reported systems, reducing both water and wastewater handling costs
04
Nutrient fertilizer inputs can be reduced by around 50–70% in recirculating hydroponic systems compared with soil (reviewed estimates)
05
Land use can be reduced by up to 99% in some vertical farming claims vs. conventional agriculture, affecting land acquisition costs (claims depend on system)
06
The global cost of electricity is a key lever; U.S. EIA reports average retail electricity price for all sectors was about 14 cents per kWh in 2022 (regional variation)
07
In 2023, U.S. industrial electricity price averaged about 11–12 cents per kWh (EIA series), a crucial input for vertical farm electricity-heavy operations
08
Life-cycle assessments often show electricity as the dominant contributor; one LCA for vertical farming reports electricity as the main hotspot, frequently >50% of impacts
09
In the U.K., the typical commercial electricity price is significantly higher than some wholesale rates; Ofgem publishes price components that drive end-user costs
10
Food waste is quantified at 1.05 billion tonnes annually globally; reducing spoilage can improve revenue per ton produced in local supply chains
Interpretation
Cost Analysis Interpretation
Cost analysis in vertical farming is most strongly shaped by energy prices, since lighting and LED electricity costs are repeatedly identified as major drivers while reported systems also cut water use by up to about 90% and reduce fertilizer inputs by roughly 50 to 70%, making operational savings depend heavily on local electricity costs around 14 cents per kWh in the US.
05 · Category
User Adoption8 stats
01
The global share of people living in households with internet access surpassed 60% by 2020 (ITU), supporting online grocery adoption and demand for fresh delivery reliability
02
In 2022, U.S. average monthly household food-at-home spending was about $400+ (BLS), illustrating stable demand for grocery products such as greens
03
Indoor farms commonly target leafy greens first; leafy greens represent a large share of vegetable consumption in many markets, supporting adoption focus
04
In the EU, 36% of adults reported consuming fresh vegetables at least once a day in 2019 (Eurobarometer), indicating demand for frequent fresh produce intake
05
A 2021 survey reported that 58% of consumers consider local food production beneficial, supporting local vertical farming adoption
06
A 2022 survey found that 55% of grocery shoppers prefer brands with transparent sourcing information, aligning with controlled-environment traceability
07
The USDA NOP organic certification standard includes requirements for production and handling that can be used by vertical farms seeking organic labels
08
In 2022, the EU had about 2,003,000 farms under organic management (Eurostat), indicating a broader adoption context beyond vertical farming
Interpretation
User Adoption Interpretation
User adoption for vertical farming looks strong and growing, with 60% of households having internet access by 2020 and rising consumer transparency preferences in 2022, including 55% of grocery shoppers favoring brands with transparent sourcing.
Reference
Cite This Report
This report is designed to be cited. We maintain stable URLs and versioned verification dates. Copy the format appropriate for your publication below.
APA
Catherine Wu. (2026, February 13). Vertical Farming Industry Statistics. Gitnux. https://gitnux.org/vertical-farming-industry-statistics
MLA
Catherine Wu. "Vertical Farming Industry Statistics." Gitnux, 13 Feb 2026, https://gitnux.org/vertical-farming-industry-statistics.
Chicago
Catherine Wu. 2026. "Vertical Farming Industry Statistics." Gitnux. https://gitnux.org/vertical-farming-industry-statistics.
Sources & references
64 datasets cited across this report · attribution is report-level
+36 additional datasets cited (not shown individually)