
Bottled water sits at the intersection of daily habits and industry impact, influencing what people choose across the U.S., Europe, China, and beyond. Demand is shaped by convenience, with 72% of U.S. consumers buying weekly and 55% of bottled water volumes purchased by women. As the market grows—from a 2022 value of USD 283.62 billion—so do pressures on water use, plastic waste, and emissions.
Key Takeaways
- 65% of Millennials prefer bottled water daily.
- 72% of U.S. consumers buy bottled water weekly.
- Women purchase 55% of bottled water volumes.
- Americans consumed 15.94 billion gallons of bottled water in 2022.
- Per capita bottled water consumption in U.S. reached 47.1 gallons in 2022.
- China bottled water sales volume 40 billion liters in 2022.
- Bottled water generates 600 billion plastic bottles yearly, polluting oceans.
- Plastic production for water emits 1.5 million tons CO2 annually.
- Only 9% of water bottles recycled globally.
- The global bottled water market was valued at USD 283.62 billion in 2022 and is projected to reach USD 500.37 billion by 2030, growing at a CAGR of 7.7%.
- U.S. bottled water sales reached $40.5 billion in 2022, marking a 5.7% increase from the previous year.
- The Asia-Pacific bottled water market is expected to grow at a CAGR of 9.2% from 2023 to 2030, driven by urbanization.
- Global PET bottle production for water 580 billion units in 2022.
- Nestlé Waters produces 100 billion liters annually worldwide.
- U.S. bottled water production capacity 20 billion gallons per year.
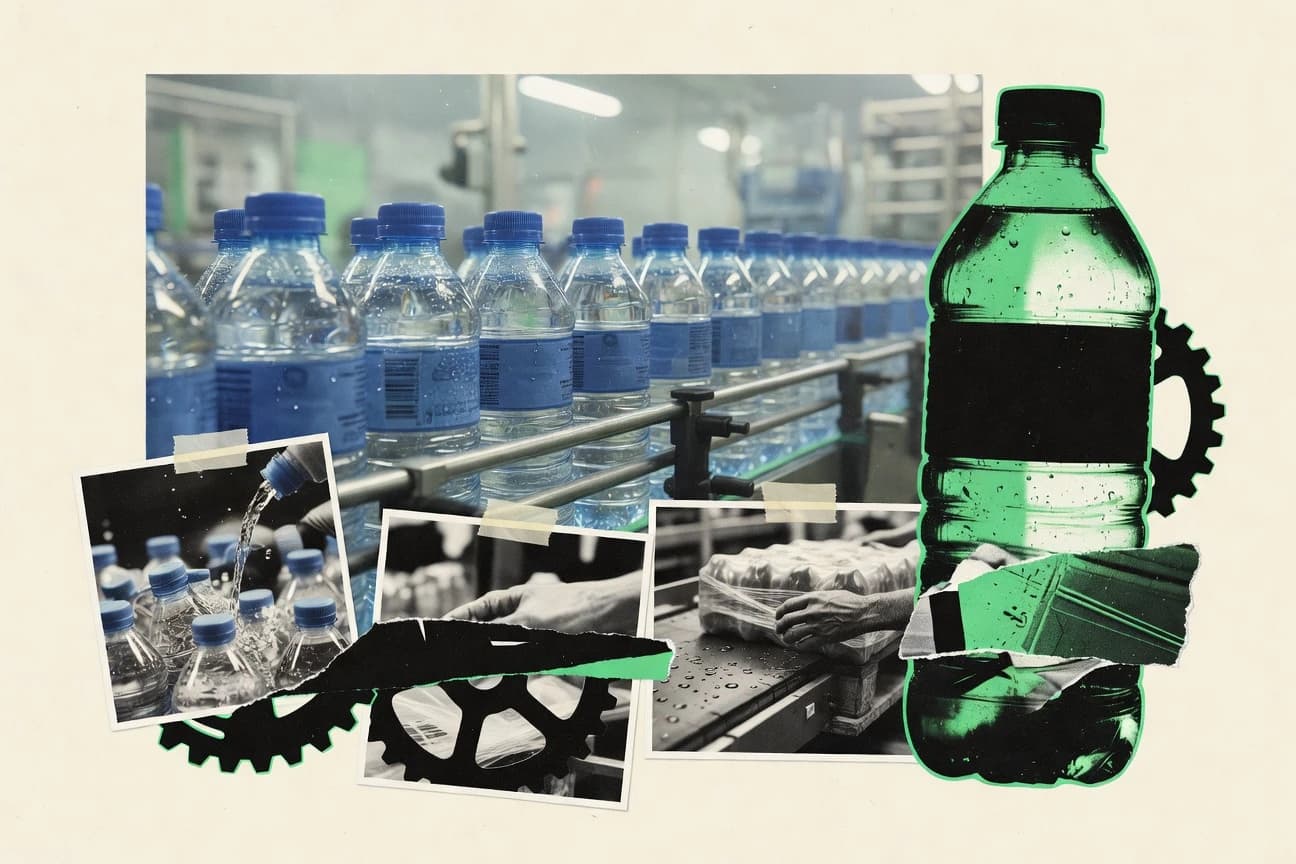
Bottled water use is soaring worldwide, hitting billions of gallons and billions of plastic bottles yearly.
Related reading
01 · Category
Consumer Demographics And Preferences29 stats
01
65% of Millennials prefer bottled water daily.
02
72% of U.S. consumers buy bottled water weekly.
03
Women purchase 55% of bottled water volumes.
04
40% cite convenience as top reason for buying.
05
Gen Z 80% loyal to sustainable brands.
06
Urban consumers 2x more likely to buy premium water.
07
25-34 age group highest per capita spenders.
08
60% prefer plastic over glass for portability.
09
Health-conscious buy 45% more alkaline water.
10
Hispanics in U.S. consume 30% above average.
11
50% of parents buy for kids' safety perception.
12
Online sales channel grew 15% among 18-24s.
13
35% switch for flavored varieties post-pandemic.
14
Affluent households spend 3x on premium.
15
70% gym-goers carry bottled water daily.
16
Boomers prefer mineral over purified 60-40.
17
Asia urban youth 85% daily consumers.
18
55% cite taste as key purchase factor.
19
Eco-labels influence 40% of purchases.
20
Office workers buy 25% more multipacks.
21
Diabetics prefer zero-calorie options 80%.
22
Travelers account for 20% impulse buys.
23
65% women choose brands with female marketing.
24
Low-income prefer bulk, high-income single-serve.
25
75% post-2000 borns avoid tap water.
26
Athletes consume 2x average volume.
27
Vegans 50% more likely functional waters.
28
45% seniors buy for digestion claims.
29
Social media influencers drive 30% youth sales.
Interpretation
Consumer Demographics And Preferences Interpretation
Consumer demographics and preferences show that younger shoppers are driving demand for bottled water, with 80% of Gen Z staying loyal to sustainable brands and 72% of U.S. consumers buying weekly, while convenience motivates 40% of purchases.
02 · Category
Consumption And Sales Volume29 stats
01
Americans consumed 15.94 billion gallons of bottled water in 2022.
02
Per capita bottled water consumption in U.S. reached 47.1 gallons in 2022.
03
China bottled water sales volume 40 billion liters in 2022.
04
Mexico leads world with 74.3 gallons per capita annual consumption.
05
Italy per capita consumption 190 liters of bottled water yearly.
06
Global bottled water consumption exceeded 600 billion liters in 2022.
07
U.S. single-serve PET bottle sales 12.5 billion units in 2022.
08
India bottled water volume 7.2 billion liters in 2023.
09
France consumes 140 liters per capita bottled water annually.
10
Brazil sales volume 8.5 billion liters in 2022.
11
U.S. gallon-size sales increased 4.2% to 2.1 billion gallons.
12
Thailand per capita 50 liters, total 3.5 billion liters yearly.
13
Germany 145 liters per capita bottled water consumption.
14
UK sales volume 3.2 billion liters in 2022.
15
Australia 40 liters per capita, total 1 billion liters.
16
Saudi Arabia 200 liters per capita due to scarcity.
17
Canada 60 liters per capita bottled water yearly.
18
Spain 130 liters per capita consumption.
19
Japan 60 billion PET bottles consumed annually.
20
South Africa 40 liters per capita, growing 5% yearly.
21
Indonesia 5 billion liters total sales in 2022.
22
U.S. premium sales volume up 9% to 3.8 billion gallons.
23
Poland 100 liters per capita bottled water.
24
UAE 250 liters per capita highest in region.
25
Vietnam sales 4 billion liters in 2023.
26
Switzerland 170 liters per capita consumption.
27
Argentina 100 liters per capita yearly.
28
Turkey 60 liters per capita, 5 billion liters total.
29
Egypt 45 liters per capita bottled water.
Interpretation
Consumption And Sales Volume Interpretation
In the Consumption And Sales Volume category, global bottled water demand topped 600 billion liters in 2022, with the United States reaching 15.94 billion gallons and per capita consumption hitting 47.1 gallons, while China sold about 40 billion liters, highlighting how consumption is both massive in total volume and still growing across major markets.
03 · Category
Environmental Impact And Sustainability30 stats
01
Bottled water generates 600 billion plastic bottles yearly, polluting oceans.
02
Plastic production for water emits 1.5 million tons CO2 annually.
03
Only 9% of water bottles recycled globally.
04
Bottling uses 3 liters water per 1 liter product.
05
U.S. discards 60 million bottles daily.
06
Microplastics found in 93% of bottled water samples.
07
PET bottles take 450 years to decompose.
08
Transport emissions 1,500x higher than tap water.
09
80% of single-use bottles land in landfills.
10
Refillable bottles reduce impact by 85%.
11
Bottled water carbon footprint 300g CO2 per liter.
12
Asia contributes 50% global plastic waste from bottles.
13
PFAS chemicals detected in 20% U.S. brands.
14
Sustainable sourcing certified 30% of global production.
15
Glass bottles 3x heavier, higher fuel use.
16
Ocean-bound plastic recycled in 5% bottles.
17
Water extraction depletes aquifers in 40% regions.
18
rPET usage cut virgin plastic by 1 million tons 2022.
19
Bans on single-use in 100+ countries affect sales.
20
Energy for production 84x tap water delivery.
21
Wildlife ingestion: 90% seabirds plastic by 2050.
22
Corporate pledges: 25% plastic-neutral by 2025.
23
Groundwater overuse in Pakistan 20% for bottling.
24
Biodegradable alternatives 2% market share.
25
EU recycling rate 50% for PET bottles.
26
Health risk: BPA in 10% polycarbonate bottles.
27
Returnable systems save 70% emissions in Germany.
28
Global cleanup costs $13 billion yearly for plastics.
29
Plant-based bottles 1% adoption, reduce 60% GHG.
30
Nestlé pledged 100% rPET by 2025.
Interpretation
Environmental Impact And Sustainability Interpretation
With bottled water producing about 600 billion plastic bottles a year and only 9% being recycled globally, the industry is driving major environmental harm through massive plastic pollution, high carbon emissions, and widespread microplastics that show up in 93% of samples.
More related reading
04 · Category
Market Size And Growth30 stats
01
The global bottled water market was valued at USD 283.62 billion in 2022 and is projected to reach USD 500.37 billion by 2030, growing at a CAGR of 7.7%.
02
U.S. bottled water sales reached $40.5 billion in 2022, marking a 5.7% increase from the previous year.
03
The Asia-Pacific bottled water market is expected to grow at a CAGR of 9.2% from 2023 to 2030, driven by urbanization.
04
European bottled water market size stood at EUR 25.6 billion in 2022.
05
Premium bottled water segment grew by 12% globally in 2023.
06
Global bottled water revenue projected to hit $346 billion by 2027.
07
China's bottled water market valued at $30 billion in 2022, with 8% CAGR forecast.
08
U.S. market share of bottled water in beverages rose to 27% in 2022.
09
Indian bottled water market expected to reach INR 1.2 trillion by 2025.
10
Functional bottled water market to grow at 10.5% CAGR through 2028.
11
Brazil's bottled water industry valued at BRL 15 billion in 2023.
12
Middle East & Africa bottled water market CAGR of 8.1% from 2023-2030.
13
Sparkling water segment global value $42 billion in 2022.
14
Mexico bottled water market size $4.5 billion USD in 2022.
15
Australia’s bottled water sales grew 6% to AUD 1.2 billion in 2022.
16
Global still water market projected CAGR 6.8% to 2030.
17
UK bottled water market £2.3 billion in 2023.
18
Flavored bottled water global market $28.5 billion by 2027.
19
Canada bottled water industry $2.1 billion CAD in 2022.
20
Southeast Asia bottled water market CAGR 7.9% 2023-2030.
21
Germany bottled water revenue €6.8 billion in 2022.
22
Alkaline water market size $4.2 billion in 2023, CAGR 15%.
23
South Korea bottled water market $3.5 billion USD 2022.
24
Latin America bottled water CAGR 6.5% to 2028.
25
Japan bottled water sales ¥600 billion in 2022.
26
Mineral water segment global $110 billion by 2030.
27
Russia bottled water market RUB 200 billion in 2023.
28
North America premium water market CAGR 8.4%.
29
Turkey bottled water industry TL 10 billion in 2022.
30
Global smart bottled water market $1.2 billion by 2027.
Interpretation
Market Size And Growth Interpretation
The bottled water industry is expanding rapidly, with the global market rising from USD 283.62 billion in 2022 to a projected USD 500.37 billion by 2030 while U.S. sales climbed to $40.5 billion in 2022, underscoring strong market size and growth momentum.
05 · Category
Production And Manufacturing28 stats
01
Global PET bottle production for water 580 billion units in 2022.
02
Nestlé Waters produces 100 billion liters annually worldwide.
03
U.S. bottled water production capacity 20 billion gallons per year.
04
China has over 500 bottled water plants operating daily.
05
70% of global bottled water uses PET plastic bottles.
06
Danone (Evian/Volvic) production 20 billion liters yearly.
07
India 1,200 bottling plants, mostly small-scale.
08
Recycled PET usage in bottles reached 30% in Europe 2022.
09
Coca-Cola (Dasani) produces 15 billion liters bottled water annually.
10
Mexico 300 major plants, producing 12 billion liters.
11
Average production cost per liter $0.15-$0.25 globally.
12
PepsiCo (Aquafina) 12 billion liters production capacity.
13
Brazil 400 factories, 90% PET packaging.
14
U.S. 700 bottling facilities nationwide.
15
Italy 250 mineral water sources protected.
16
Global aseptic packaging for water 5% of production.
17
Fiji Water sourced from single aquifer, 300 million bottles/year.
18
France 1,200 springs used for bottling.
19
Aluminum can production for sparkling water up 20%.
20
Poland 150 plants, exporting 1 billion liters.
21
Energy use in bottling: 1.5 kWh per 1000 liters.
22
Primo Water Corp operates 50 plants in North America.
23
Glass bottle production 10% of total water packaging.
24
Indonesia 200 factories, 80% local sourcing.
25
Sanitization uses UV light in 90% of U.S. plants.
26
Thailand 100 plants, PET recycling integrated.
27
Voss Water hand-filled 1 million bottles/month.
28
Water withdrawal for bottling 0.01% of global total.
Interpretation
Production And Manufacturing Interpretation
With 580 billion PET bottles produced for water in 2022 and 70% of global bottled water still relying on PET, the production and manufacturing side is scaling at massive volume worldwide, from 20 billion liters at Danone to 20 billion gallons per year in the US and over 500 daily plants in China.
Reference
Cite This Report
This report is designed to be cited. We maintain stable URLs and versioned verification dates. Copy the format appropriate for your publication below.
APA
Lukas Bauer. (2026, February 13). Bottled Water Industry Statistics. Gitnux. https://gitnux.org/bottled-water-industry-statistics
MLA
Lukas Bauer. "Bottled Water Industry Statistics." Gitnux, 13 Feb 2026, https://gitnux.org/bottled-water-industry-statistics.
Chicago
Lukas Bauer. 2026. "Bottled Water Industry Statistics." Gitnux. https://gitnux.org/bottled-water-industry-statistics.
Sources & references
91 datasets cited across this report · attribution is report-level