GITNUX MARKETDATA
Browse Our Category
Arts Creative Expression
Latest update:


Riyadh Creative Industry Statistics
Riyadh’s creative pulse hits hard with SAR 127 billion in 2023 output and 15,000 events packed into 100 days during Riyadh Season, drawing 20 million visitors. From Fashion Week’s 500,000 attendees to film and digital commerce, the page connects audiences, jobs, exports, and venture funding so you can see exactly how Riyadh turns ideas into economic momentum.

Detroit Creative Industry Statistics
Detroit’s creative industries delivered $4.2 billion in economic output in 2022 and lifted their GDP share to 7.8% in 2021, a jump from 6.2% just five years earlier, while supporting 28,500 workers and $1.1 billion in wages and salaries. The page maps how Detroit’s music, film, design, advertising, and digital creators translate art into business revenue, tax gains, and even poverty reduction, with ripple effects pushing total output to $1.8 billion in 2022.

Hong Kong Creative Industry Statistics
Hong Kong’s creative industries are projected to contribute 5.1% to GDP in 2025, with gross output reaching HK$285 billion in 2023 prelim, even as advertising alone generated HK$28.4 billion in value added in 2022 and the design sector delivered HK$18.7 billion. The page connects output, jobs, exports and policy support into one view so you can spot where growth is accelerating and where it is quietly cooling.

Nigeria Creative Industry Statistics
Nigeria’s creative economy is accelerating fast, from social media ad spend hitting NGN 300 billion and programmatic buying jumping 50% to NGN 150 billion, to ad fraud dropping to 10% or NGN 80 billion thanks to AI verification. If you want the most practical signal of where Nigerian money and talent are heading, this page connects the whole chain from advertising and fashion to Nollywood, music, and publishing, so you can spot demand where it is monetizing.

Live Theatre Attendance Statistics
Broadway audiences still skew female, but the bigger signal for 2023 is how much income, location, and identity reshape who shows up, from households earning over $100k making up 45% of US theatregoers to LGBTQ+ patrons at 10% of Broadway crowds. Scroll through the latest occupancy and recovery contrasts, including the US rebound after 2020 and the global attendance scale, to see how social media, touring, and programming changes are pushing theatre attendance in unexpected directions.

Istanbul Creative Industry Statistics
With 45.1% of Turkey’s patent applications and a 38% jump in office rents from 2020 to 2024, Istanbul looks like a city where innovation keeps accelerating even as studio costs rise. Add 75.45% year on year CPI pressures and a $8.0 billion creative industries economy in 2022 to the mix and you get a sharper question worth reading for yourself: how Istanbul’s tech enabled media, design, and IP engines stay competitive while demand and expenses move in different directions.

Art Education Statistics
Arts integrated schools are showing a 17% bump in attendance in the latest 2023 studies, and the benefits keep multiplying from test scores to empathy, with participation tied to 15% higher verbal SAT results. Read how funding pressures, shrinking access in key grades, and teacher training realities shape who gets these gains and who misses out.

Dance Studio Industry Statistics
Even with discretionary household recreation spending reaching $29.2 billion in 2022, dance studios feel the squeeze from rising costs and tighter labor dynamics alongside fierce local visibility and review-driven demand that can make or break enrollment, from Google’s nearby search behavior to the trust consumers place in online reviews. This page pulls together the studio-adjacent benchmarks that matter most, including profit margin patterns for dance companies, retail sales signals that support lesson ecosystems, and the real cybersecurity and booking expectations that customers now treat as standard.

Merchandise Printing Industry Statistics
See why fast turnaround matters as 70% of promo shoppers want delivery under 7 days and e-commerce orders keep rising, with 80% of buyers swayed by social media designs and the U.S. merchandise printing industry employing 450,000 workers in 2023. From DTG and embroidery preferences to eco inks and personalization growth, the page connects what customers crave to what printers must build next, including a projected global market reaching $25 billion by 2030.

Tokyo Creative Industry Statistics
Tokyo’s ad and creative economy hit ¥1.5 trillion in digital revenue in 2023, while Minato remains the headquarters hub for 95% of Japan’s national ad agencies, making the city the control tower for what gets seen and bought. From 15,000 outdoor billboards to 70% national TV airtime and Tokyo’s anime, gaming, and influencer engines, the page maps how branding moves from screens to streets and back again.
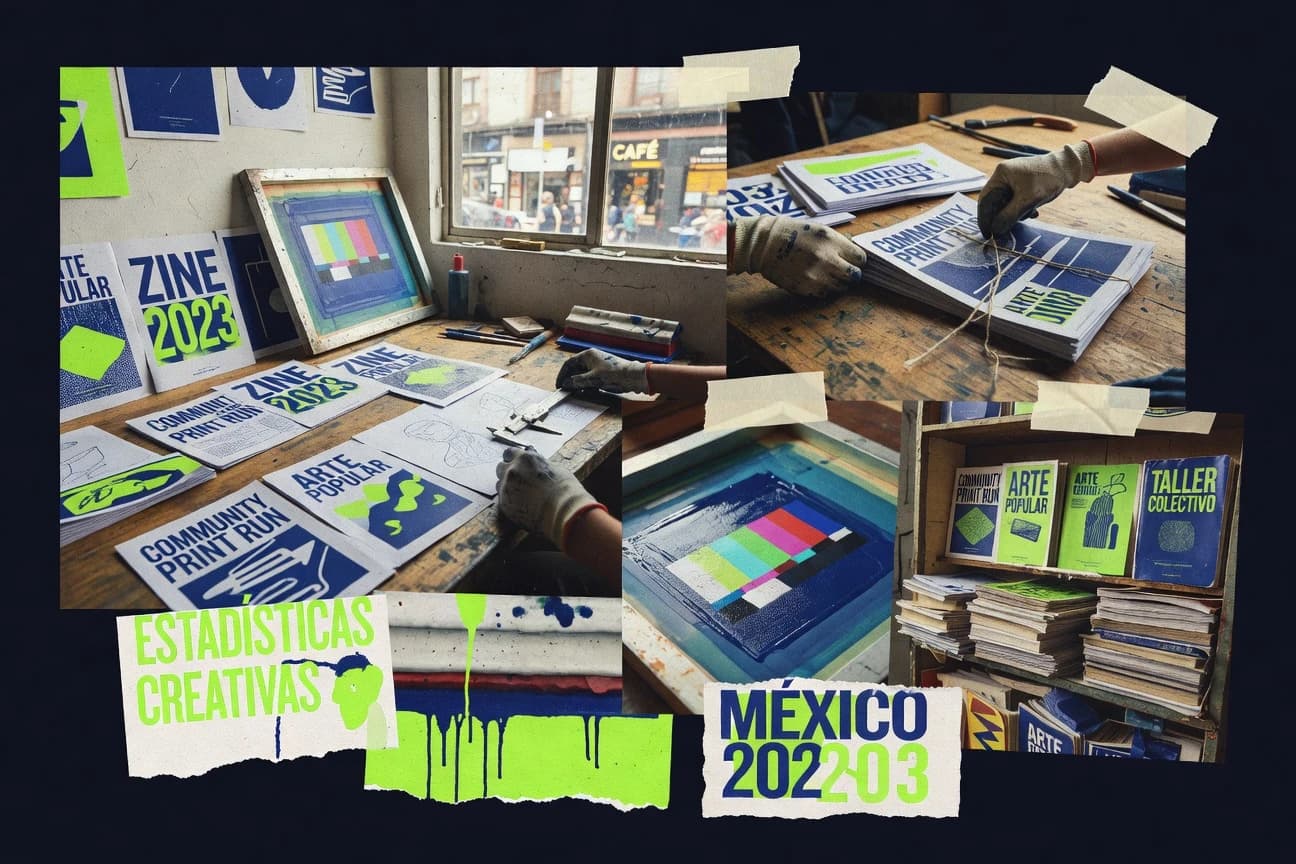
Mexico Creative Industry Statistics
Mexico’s creative economy is pushing ahead even as growth cools, with film and video revenue up 5.1% year over year in 2022 and 3.4% of GDP still tied to the creative economy, while real GDP growth slips from 3.2% in 2023 to 0.6% in 2024. You will see how strong public leverage and mobile first distribution meet practical constraints like rising advertising production costs and financing pressure, alongside clear signals from creative exports, IP filings, and production capacity.

Kenya Creative Industry Statistics
Kenya’s screen and stage industries are moving fast, with TV and streaming ecosystems putting 1,200 Kenyan short films online in 2023 and post-production studios numbering 45 handling VFX for 80% of local films. Expect a sharp contrast between box office pull and digital reach, plus how awards, training, and co-productions are turning creative risk into measurable growth across film, music, theatre, publishing, and the visual arts.

Voice Acting Industry Statistics
Home studios and remote work pushed voice careers into a 2025 reality check, where 28% of new Voices.com signups were Gen Z and 35% of talent now works full time while diverse groups gain clearer footing across auditions and gigs. You will see how representation and earnings are shifting alongside AI disruption, including AI-generated voices taking 15% of the commercial market and multilingual voice actors (3+ languages) making up 25% of the global pool.

Toronto Creative Industry Statistics
Toronto’s creative economy is sprinting ahead, with digital ads alone reaching $2.8 billion and 65% of the total market, while agencies produced 12,000 campaigns worth $3.9 billion. From 5,200 street level billboards and 12,000 TTC placements to 180 VR AR teams launched campaigns and 293,000 people employed across the sector, this page shows how Toronto monetizes imagination at city scale.

Uk Creative Industry Statistics
UK creative industries generated £126.6 billion GVA in 2022 and grew 21.6% from 2019 to 2022, outpacing the wider economy, while London alone delivered 43% of the sector’s value. From £28.6 billion exports and a £16.2 billion trade surplus to 2.38 million jobs and rising female representation, the page lays out how creativity is powering both consumption and innovation.

Taiwan Creative Industry Statistics
With 2025 facing new cultural and tech pressures, Taiwan’s creative industries already signal momentum from the ground up, supported by NT$15 billion in government funding in 2023, a 28% jump in remote creative jobs during 2022, and digital creative spending rising 25% to NT$320 billion in 2023. The page connects what citizens consume with what creators earn, from NT$650 million in IP protection funding and growing AI animation efficiency to how NT$2.1 trillion of multiplier effects spills into related sectors.

Arts In Education Statistics
Arts education is not just “nice to have.” Across recent studies, it links to sharper academics like a 31% SAT verbal boost for arts participants and safer schools with 12% fewer suspensions in arts integrated settings, plus payoffs in how students think, communicate, and belong.

Chicago Creative Industry Statistics
Chicago’s creative economy delivered $11.2 billion in total output and supported 128,500 jobs in 2022, but the real surprise is how specialized it gets. From $18 billion in ad media spend to 450 UX/UI design studios for tech firms and 650 documentary features winning 15 Emmys in 2022, this page maps the city’s craft, commerce, and culture into one unusually detailed snapshot.

Musical Statistics
See how 2024 and 2023 snapshots of streaming, discovery, and rights are reshaping music earnings and audiences at once, from YouTube’s $7.0 billion global music payments to the fact that 73% of discovery on European streaming platforms is algorithm driven. It also pulls the live side of the business into view with $10.2 billion in U.S. concert ticket sales plus the surprisingly high 26% of consumers who still use illegal sources at least once.
Germany Creative Industry Statistics
Germany’s creative industries reached €145.7 billion in turnover in 2023, a 3.5% rise that coexists with a productivity advantage of €78,500 per employee and women holding 48.5% of the workforce. From design and film to software, gaming, and advertising, the sector created spillovers worth 1.3 million indirect jobs and pushed exports to €27.5 billion, making culture and creativity a measurable economic engine rather than a side story.