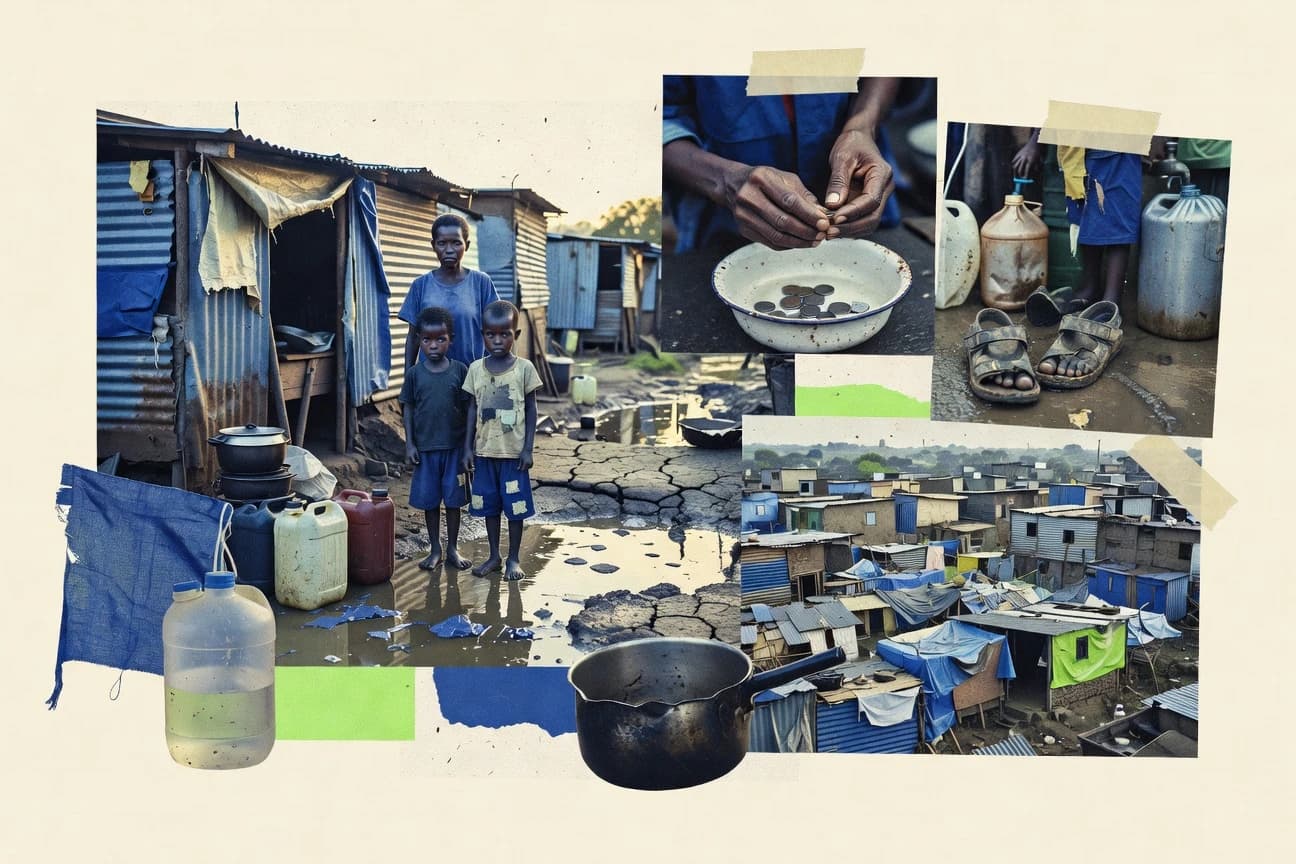
GITNUXREPORT 2026

Global Poverty Statistics

Global poverty has sharply declined but progress has slowed, leaving hundreds of millions in hardship.

Global Poverty Statistics

How We Build This Report

01
Primary Source Collection

Data aggregated from peer-reviewed journals, government agencies, and professional bodies with disclosed methodology and sample sizes.

02
Editorial Curation

Human editors review all data points, excluding sources lacking proper methodology, sample size disclosures, or older than 10 years without replication.

03
AI-Powered Verification

Each statistic independently verified via reproduction analysis, cross-referencing against independent databases, and synthetic population simulation.

04
Human Cross-Check

Final human editorial review of all AI-verified statistics. Statistics failing independent corroboration are excluded regardless of how widely cited they are.

Statistics that could not be independently verified are excluded regardless of how widely cited they are elsewhere.

Our process →

Key Statistics

Statistic 1

The world poverty target under the UN is to reduce the proportion of men, women, and children living in poverty in all its dimensions (Sustainable Development Goal 1)

Statistic 2

In 2019, an estimated 648 million people lived under the international poverty line of $1.90 a day (2011 PPP) (World Bank estimates)

Statistic 3

In 2020, an estimated 689 million people lived under the international poverty line of $1.90 a day (2011 PPP) (World Bank estimates)

Statistic 4

In 2022, the World Bank estimated that 2.4 billion people were living in poverty at $3.65 a day (2017 PPP)

Statistic 5

By 2030, under a range of scenarios, the World Bank projections indicate the number of people in extreme poverty could reach around 500 million (model estimate range)

Statistic 6

In 2021, about 189 million people (age 0–17) were living in extreme poverty (UNICEF analysis using World Bank poverty lines)

Statistic 7

In 2021, around 400 million children were living in poverty at $3.65/day (2017 PPP), per UNICEF analysis

Statistic 8

In 2021, approximately 1 in 10 people were living on less than $2.15 a day worldwide

Statistic 9

In 2021, the UNDP/OPHI Multidimensional Poverty Index covers 111 countries and accounts for deprivations in 5 dimensions and 10 indicators

Statistic 10

In 2019, 1.1 billion people were multidimensionally poor, using the MPI intensity measure (UNDP/OPHI)

Statistic 11

In 2022, the World Bank projected extreme poverty reduction under baseline would mean 8.0% globally in 2021 and decreasing gradually afterwards (projection framework)

Statistic 12

1 in 10 people were in extreme poverty in 2019 (World Bank global poverty profile using $1.90/day then updated)

Statistic 13

In 2021, about 10.1% of the population in low-income countries lived in extreme poverty

Statistic 14

In 2021, about 28.5% of the population in Sub-Saharan Africa lived in extreme poverty (World Bank regional estimate)

Statistic 15

In 2020, extreme poverty in low-income countries rose to 9.7% of their populations (World Bank)

Statistic 16

In 2021, extreme poverty in fragile and conflict-affected settings remained about 15–20% of the population (World Bank fragility poverty context)

Statistic 17

In 2021, about 54% of the world’s extreme poor people lived in fragile and conflict-affected settings (World Bank)

Statistic 18

In 2021, 74% of extreme poor people were in rural areas (World Bank rural poverty context)

Statistic 19

In 2021, 26% of extreme poor people were in urban areas (World Bank rural-urban context)

Statistic 20

In 2021, about 2.2 billion people were food insecure (FAO/IFAD/UNICEF/WFP/WHO report) with at least moderate food insecurity

Statistic 21

In 2023, 333 million people were facing severe food insecurity (FAO/WFP/partners report)

Statistic 22

In 2022, 45.4 million people were internally displaced due to conflict and violence globally (IDMC figure)

Statistic 23

In 2023, 117.3 million people were forcibly displaced worldwide (UNHCR)

Statistic 24

In 2022, 33% of the population in developing countries lacked basic sanitation services (WHO/UNICEF JMP)

Statistic 25

In 2022, 673 million people practiced open defecation globally (WHO/UNICEF JMP)

Statistic 26

In 2022, 2.2 billion people lacked safely managed drinking water services (WHO/UNICEF JMP)

Statistic 27

In 2022, 1.8 billion people lacked safely managed sanitation services (WHO/UNICEF JMP)

Statistic 28

In 2022, 1.6 billion people lacked electricity access globally (IEA/WHO joint reporting referenced in tracking reports)

Statistic 29

In 2022, 675 million people lacked access to electricity (IEA/World Bank/SDG7 tracking)

Statistic 30

Extreme poverty fell by 10 percentage points globally between 1990 and 2015 (from about 36% to about 10%)

Statistic 31

A 2020 study estimated that COVID-19 could push up to 150 million people into poverty globally (World Bank/UN/others modeling results widely reported)

Statistic 32

The IMF reported in 2020 that global GDP could fall by about 4.4% in 2020, a macro shock associated with higher poverty risks

Statistic 33

In 2022, global inflation averaged about 8.8% (World Bank commodity and macro context affecting cost-of-living poverty)

Statistic 34

Food prices rose sharply in 2022; the FAO Food Price Index averaged 158.6 in 2022 (annual average)

Statistic 35

The FAO Food Price Index reached 159.7 points in March 2022 (monthly value) amid the food crisis

Statistic 36

In 2021, conflict displaced about 33.3 million people internally and 5.0 million across borders (UNHCR/IDMC displaced figures) increasing poverty exposure

Statistic 37

In 2022, the world saw 228 million people in need of humanitarian assistance (UN OCHA Global Humanitarian Overview figure)

Statistic 38

In 2023, 339 million people were in need of humanitarian assistance and protection (OCHA Global Humanitarian Overview 2024/2023 framing)

Statistic 39

In 2022, 2.4 billion people lacked access to legally protected social services (World Bank/ILO social protection coverage constraints)

Statistic 40

In 2021, 222 million people were living in countries with high debt distress risk (IMF/World Bank macro conditions context)

Statistic 41

In 2021, about 55% of global biodiversity loss risk is driven by land-use change that also affects rural livelihoods and poverty (IPBES linkage)

Statistic 42

In 2022, 90% of countries reported that at least one-third of their population lacked access to basic sanitation, tied to health poverty risk (WHO)

Statistic 43

In 2021, 1 in 3 people globally did not have access to adequate food (FAO, SOFI report context)

Statistic 44

In 2022, global estimates show that 2.4 billion people were moderately or severely food insecure (FAO SOFI)

Statistic 45

In 2022, 879 million adults were food insecure (FAO SOFI 2023 provides adult food insecurity breakdown)

Statistic 46

In 2022, 150.8 million children under 5 years were stunted globally (UNICEF/WHO/World Bank joint estimates)

Statistic 47

In 2022, 45.0 million children under 5 years were wasted globally (UNICEF/WHO/World Bank joint estimates)

Statistic 48

In 2022, 148.1 million children under 5 years were overweight globally (UNICEF/WHO/World Bank joint estimates)

Statistic 49

In 2022, 22.3% of children under 5 years were stunted globally (UNICEF/WHO/World Bank estimates)

Statistic 50

The UNDP/OPHI Multidimensional Poverty Index (MPI) is calculated for people living in 111 developing countries

Statistic 51

The global MPI uses 10 indicators across 5 dimensions: health, education, and living standards (with sub-dimensions)

Statistic 52

A person is considered multidimensionally poor if they are deprived in at least 33% of weighted indicators

Statistic 53

The MPI intensity is reported as the average proportion of deprivation among multidimensionally poor people

Statistic 54

The MPI value is computed as H (incidence) × A (intensity) × 100

Statistic 55

The World Bank’s poverty estimates use household survey microdata (with survey-weighted distribution of consumption or income)

Statistic 56

The Gini index for many countries is computed from household income or consumption distributions (World Bank method) used to analyze inequality-driven poverty

Statistic 57

The World Bank’s poverty headcount ratio (P0) is the share of people below a poverty line

Statistic 58

The poverty gap index (P1) measures the mean shortfall from the poverty line as a percentage of the line

Statistic 59

The squared poverty gap index (P2) reflects inequality among the poor (severity and distribution of shortfalls)

Statistic 60

The UNICEF Child Poverty report uses a child poverty measurement approach aligned with the $2.15/day and other lines (2017 PPP)

Statistic 61

Child poverty data commonly defines children in poor households using poverty lines applied to household resources

Statistic 62

The World Bank’s poverty estimates and PIP also produce uncertainty bands for poverty incidence using survey-to-survey and estimation errors

Statistic 63

In 2023, UNICEF estimated that 333 million people were facing severe food insecurity and this is associated with elevated poverty risk

Statistic 64

The World Bank reports that social assistance programs can reduce poverty; cash transfers are among the most cost-effective interventions

Statistic 65

The ILO and UNICEF report that cash transfers are typically designed to cover a significant share of basic needs; program designs often target poverty reduction by providing regular income support

Statistic 66

A 2019 World Bank paper estimated that female education completion can increase earnings by about 10–20% (education returns context tied to poverty reduction)

Statistic 67

The WHO recommends exclusive breastfeeding for the first 6 months to reduce child malnutrition and poverty-related outcomes

Statistic 68

In 2022, Global Partnership for Education reported that countries increased education financing; donor commitments were €1.7 billion for GPE 2021 replenishment (policy finance)

Statistic 69

The GAVI Alliance reported that in 2022, 90% of eligible children under 1 were receiving immunizations in supported countries (coverage outcomes)

Statistic 70

The Gavi results site reports that in 2022, 70 million children were vaccinated (Gavi annual outcomes)

Statistic 71

The Global Fund reported that it supported 28 million people with antiretroviral therapy (ART) in 2022 (outcome indicator)

Statistic 72

The World Bank’s Human Capital Project estimated that investing in health and education can raise productivity; countries typically target HCI improvements measured against 14-year-olds’ future earnings potential

Statistic 73

The HCI framework measures what a child born today can expect to achieve by age 18; it is expressed as a fraction of maximum productivity

Statistic 74

In 2017, WHO estimated that reducing poverty-linked risk factors could save millions; however, a measurable indicator is that 829 million people still lacked basic health services in 2019 (WHO/World Bank Universal Health Coverage monitoring)

Statistic 75

In 2020, the World Bank estimated that poverty reduction is supported by improvements in governance and economic growth, with specific cash transfer programs reducing poverty headcount ratios in evaluated pilots by 20–30% (impact evaluation meta)

Statistic 76

The Lancet reported that education interventions can improve learning outcomes by 0.10 to 0.20 standard deviations per year, affecting future earnings and poverty risk (meta-analysis range)

Statistic 77

UNICEF and partners reported that school feeding can increase enrollment and attendance; typical measured impacts include attendance gains of several percentage points in evaluated programs

Statistic 78

In 2023, the World Bank estimated IDA supported 19 countries with safety nets and jobs programs under COVID-19 response scale-up (programmatic outcomes)

Statistic 79

The World Bank’s Results Framework reports 1.2 billion people reached by health or social protection services through projects (global aggregation)

Statistic 80

The SDG 1.2.1 indicator tracks poverty reduction across countries; progress is monitored using national poverty lines and international lines (UN metadata)

Statistic 81

The WHO estimates that universal health coverage could reduce catastrophic health expenditure incidence by measurable fractions; however specific global metric: 1 billion people spend at least 10% of household budget on health costs (WHO/World Bank)

Statistic 82

The Global Partnership for Education reports it has financed education in 84 countries (policy implementation scale metric)

Statistic 83

The World Bank reports that IDA commitments target human development outcomes including education and health with measurable indicators such as number of students supported (project results)

Statistic 84

GPE’s 2021 replenishment included $2.8 billion in grant commitments (measurable donor finance) supporting education access to reduce poverty

Statistic 85

UNICEF estimates that school closures during COVID-19 affected 1.6 billion learners worldwide (education loss increases poverty risk)

Statistic 86

The World Bank reports that social protection can reduce the poverty headcount ratio by several percentage points depending on program coverage and transfer size (modeling evidence summary)

Statistic 87

The SDG 1.4.1 metric monitors access to basic services; it is measured by national definitions of basic services (UN metadata)

Statistic 88

SDG 1.5.1 tracks resilience to shocks for the poor using poverty and vulnerability metrics (UN metadata)

Trusted by 500+ publications
Harvard Business ReviewThe GuardianFortune+497
In 2019, an estimated 648 million people lived under the international poverty line of $1.90 a day, and this post breaks down the latest global poverty trends to show how those numbers vary by age, region, and multidimensional deprivation.

Key Takeaways

  • The world poverty target under the UN is to reduce the proportion of men, women, and children living in poverty in all its dimensions (Sustainable Development Goal 1)
  • In 2019, an estimated 648 million people lived under the international poverty line of $1.90 a day (2011 PPP) (World Bank estimates)
  • In 2020, an estimated 689 million people lived under the international poverty line of $1.90 a day (2011 PPP) (World Bank estimates)
  • Extreme poverty fell by 10 percentage points globally between 1990 and 2015 (from about 36% to about 10%)
  • A 2020 study estimated that COVID-19 could push up to 150 million people into poverty globally (World Bank/UN/others modeling results widely reported)
  • The IMF reported in 2020 that global GDP could fall by about 4.4% in 2020, a macro shock associated with higher poverty risks
  • The UNDP/OPHI Multidimensional Poverty Index (MPI) is calculated for people living in 111 developing countries
  • The global MPI uses 10 indicators across 5 dimensions: health, education, and living standards (with sub-dimensions)
  • A person is considered multidimensionally poor if they are deprived in at least 33% of weighted indicators
  • In 2023, UNICEF estimated that 333 million people were facing severe food insecurity and this is associated with elevated poverty risk
  • The World Bank reports that social assistance programs can reduce poverty; cash transfers are among the most cost-effective interventions
  • The ILO and UNICEF report that cash transfers are typically designed to cover a significant share of basic needs; program designs often target poverty reduction by providing regular income support

In 2022, 2.4 billion people lived in poverty, and even deeper reductions by 2030 remain uncertain.

Poverty Levels

1The world poverty target under the UN is to reduce the proportion of men, women, and children living in poverty in all its dimensions (Sustainable Development Goal 1)[1]
Verified
2In 2019, an estimated 648 million people lived under the international poverty line of $1.90 a day (2011 PPP) (World Bank estimates)[2]
Verified
3In 2020, an estimated 689 million people lived under the international poverty line of $1.90 a day (2011 PPP) (World Bank estimates)[2]
Verified
4In 2022, the World Bank estimated that 2.4 billion people were living in poverty at $3.65 a day (2017 PPP)[2]
Directional
5By 2030, under a range of scenarios, the World Bank projections indicate the number of people in extreme poverty could reach around 500 million (model estimate range)[2]
Single source
6In 2021, about 189 million people (age 0–17) were living in extreme poverty (UNICEF analysis using World Bank poverty lines)[3]
Verified
7In 2021, around 400 million children were living in poverty at $3.65/day (2017 PPP), per UNICEF analysis[3]
Verified
8In 2021, approximately 1 in 10 people were living on less than $2.15 a day worldwide[2]
Verified
9In 2021, the UNDP/OPHI Multidimensional Poverty Index covers 111 countries and accounts for deprivations in 5 dimensions and 10 indicators[4]
Directional
10In 2019, 1.1 billion people were multidimensionally poor, using the MPI intensity measure (UNDP/OPHI)[4]
Single source
11In 2022, the World Bank projected extreme poverty reduction under baseline would mean 8.0% globally in 2021 and decreasing gradually afterwards (projection framework)[2]
Verified
121 in 10 people were in extreme poverty in 2019 (World Bank global poverty profile using $1.90/day then updated)[2]
Verified
13In 2021, about 10.1% of the population in low-income countries lived in extreme poverty[2]
Verified
14In 2021, about 28.5% of the population in Sub-Saharan Africa lived in extreme poverty (World Bank regional estimate)[2]
Directional
15In 2020, extreme poverty in low-income countries rose to 9.7% of their populations (World Bank)[2]
Single source
16In 2021, extreme poverty in fragile and conflict-affected settings remained about 15–20% of the population (World Bank fragility poverty context)[5]
Verified
17In 2021, about 54% of the world’s extreme poor people lived in fragile and conflict-affected settings (World Bank)[5]
Verified
18In 2021, 74% of extreme poor people were in rural areas (World Bank rural poverty context)[2]
Verified
19In 2021, 26% of extreme poor people were in urban areas (World Bank rural-urban context)[2]
Directional
20In 2021, about 2.2 billion people were food insecure (FAO/IFAD/UNICEF/WFP/WHO report) with at least moderate food insecurity[6]
Single source
21In 2023, 333 million people were facing severe food insecurity (FAO/WFP/partners report)[6]
Verified
22In 2022, 45.4 million people were internally displaced due to conflict and violence globally (IDMC figure)[7]
Verified
23In 2023, 117.3 million people were forcibly displaced worldwide (UNHCR)[8]
Verified
24In 2022, 33% of the population in developing countries lacked basic sanitation services (WHO/UNICEF JMP)[9]
Directional
25In 2022, 673 million people practiced open defecation globally (WHO/UNICEF JMP)[10]
Single source
26In 2022, 2.2 billion people lacked safely managed drinking water services (WHO/UNICEF JMP)[11]
Verified
27In 2022, 1.8 billion people lacked safely managed sanitation services (WHO/UNICEF JMP)[12]
Verified
28In 2022, 1.6 billion people lacked electricity access globally (IEA/WHO joint reporting referenced in tracking reports)[13]
Verified
29In 2022, 675 million people lacked access to electricity (IEA/World Bank/SDG7 tracking)[13]
Directional

Poverty Levels Interpretation

Despite efforts, extreme poverty and its overlapping deprivations remain widespread, with 689 million people living under $1.90 a day in 2020 and about 2.2 billion people lacking safely managed drinking water and 1.8 billion lacking safely managed sanitation in 2022.

Poverty Drivers

1Extreme poverty fell by 10 percentage points globally between 1990 and 2015 (from about 36% to about 10%)[2]
Verified
2A 2020 study estimated that COVID-19 could push up to 150 million people into poverty globally (World Bank/UN/others modeling results widely reported)[14]
Verified
3The IMF reported in 2020 that global GDP could fall by about 4.4% in 2020, a macro shock associated with higher poverty risks[15]
Verified
4In 2022, global inflation averaged about 8.8% (World Bank commodity and macro context affecting cost-of-living poverty)[16]
Directional
5Food prices rose sharply in 2022; the FAO Food Price Index averaged 158.6 in 2022 (annual average)[17]
Single source
6The FAO Food Price Index reached 159.7 points in March 2022 (monthly value) amid the food crisis[17]
Verified
7In 2021, conflict displaced about 33.3 million people internally and 5.0 million across borders (UNHCR/IDMC displaced figures) increasing poverty exposure[18]
Verified
8In 2022, the world saw 228 million people in need of humanitarian assistance (UN OCHA Global Humanitarian Overview figure)[19]
Verified
9In 2023, 339 million people were in need of humanitarian assistance and protection (OCHA Global Humanitarian Overview 2024/2023 framing)[20]
Directional
10In 2022, 2.4 billion people lacked access to legally protected social services (World Bank/ILO social protection coverage constraints)[21]
Single source
11In 2021, 222 million people were living in countries with high debt distress risk (IMF/World Bank macro conditions context)[22]
Verified
12In 2021, about 55% of global biodiversity loss risk is driven by land-use change that also affects rural livelihoods and poverty (IPBES linkage)[23]
Verified
13In 2022, 90% of countries reported that at least one-third of their population lacked access to basic sanitation, tied to health poverty risk (WHO)[24]
Verified
14In 2021, 1 in 3 people globally did not have access to adequate food (FAO, SOFI report context)[25]
Directional
15In 2022, global estimates show that 2.4 billion people were moderately or severely food insecure (FAO SOFI)[26]
Single source
16In 2022, 879 million adults were food insecure (FAO SOFI 2023 provides adult food insecurity breakdown)[26]
Verified
17In 2022, 150.8 million children under 5 years were stunted globally (UNICEF/WHO/World Bank joint estimates)[27]
Verified
18In 2022, 45.0 million children under 5 years were wasted globally (UNICEF/WHO/World Bank joint estimates)[27]
Verified
19In 2022, 148.1 million children under 5 years were overweight globally (UNICEF/WHO/World Bank joint estimates)[27]
Directional
20In 2022, 22.3% of children under 5 years were stunted globally (UNICEF/WHO/World Bank estimates)[27]
Single source

Poverty Drivers Interpretation

Despite extreme poverty dropping from about 36% to about 10% between 1990 and 2015, repeated crises are still pushing hundreds of millions into harder conditions, with 339 million people needing humanitarian help in 2023 and 2.4 billion people moderately or severely food insecure in 2022.

Poverty Measurement

1The UNDP/OPHI Multidimensional Poverty Index (MPI) is calculated for people living in 111 developing countries[4]
Verified
2The global MPI uses 10 indicators across 5 dimensions: health, education, and living standards (with sub-dimensions)[4]
Verified
3A person is considered multidimensionally poor if they are deprived in at least 33% of weighted indicators[4]
Verified
4The MPI intensity is reported as the average proportion of deprivation among multidimensionally poor people[4]
Directional
5The MPI value is computed as H (incidence) × A (intensity) × 100[4]
Single source
6The World Bank’s poverty estimates use household survey microdata (with survey-weighted distribution of consumption or income)[28]
Verified
7The Gini index for many countries is computed from household income or consumption distributions (World Bank method) used to analyze inequality-driven poverty[29]
Verified
8The World Bank’s poverty headcount ratio (P0) is the share of people below a poverty line[30]
Verified
9The poverty gap index (P1) measures the mean shortfall from the poverty line as a percentage of the line[31]
Directional
10The squared poverty gap index (P2) reflects inequality among the poor (severity and distribution of shortfalls)[32]
Single source
11The UNICEF Child Poverty report uses a child poverty measurement approach aligned with the $2.15/day and other lines (2017 PPP)[3]
Verified
12Child poverty data commonly defines children in poor households using poverty lines applied to household resources[3]
Verified
13The World Bank’s poverty estimates and PIP also produce uncertainty bands for poverty incidence using survey-to-survey and estimation errors[28]
Verified

Poverty Measurement Interpretation

Across 111 developing countries, the MPI counts people as multidimensionally poor when they are deprived in at least 33 percent of 10 weighted indicators, and the average deprivation among them is then combined with this incidence to produce the overall MPI value, while World Bank poverty measures based on household survey data also emphasize how depth and severity of shortfalls below the poverty line vary through P1 and P2.

Policy & Outcomes

1In 2023, UNICEF estimated that 333 million people were facing severe food insecurity and this is associated with elevated poverty risk[6]
Verified
2The World Bank reports that social assistance programs can reduce poverty; cash transfers are among the most cost-effective interventions[33]
Verified
3The ILO and UNICEF report that cash transfers are typically designed to cover a significant share of basic needs; program designs often target poverty reduction by providing regular income support[34]
Verified
4A 2019 World Bank paper estimated that female education completion can increase earnings by about 10–20% (education returns context tied to poverty reduction)[35]
Directional
5The WHO recommends exclusive breastfeeding for the first 6 months to reduce child malnutrition and poverty-related outcomes[36]
Single source
6In 2022, Global Partnership for Education reported that countries increased education financing; donor commitments were €1.7 billion for GPE 2021 replenishment (policy finance)[37]
Verified
7The GAVI Alliance reported that in 2022, 90% of eligible children under 1 were receiving immunizations in supported countries (coverage outcomes)[38]
Verified
8The Gavi results site reports that in 2022, 70 million children were vaccinated (Gavi annual outcomes)[38]
Verified
9The Global Fund reported that it supported 28 million people with antiretroviral therapy (ART) in 2022 (outcome indicator)[39]
Directional
10The World Bank’s Human Capital Project estimated that investing in health and education can raise productivity; countries typically target HCI improvements measured against 14-year-olds’ future earnings potential[40]
Single source
11The HCI framework measures what a child born today can expect to achieve by age 18; it is expressed as a fraction of maximum productivity[40]
Verified
12In 2017, WHO estimated that reducing poverty-linked risk factors could save millions; however, a measurable indicator is that 829 million people still lacked basic health services in 2019 (WHO/World Bank Universal Health Coverage monitoring)[41]
Verified
13In 2020, the World Bank estimated that poverty reduction is supported by improvements in governance and economic growth, with specific cash transfer programs reducing poverty headcount ratios in evaluated pilots by 20–30% (impact evaluation meta)[42]
Verified
14The Lancet reported that education interventions can improve learning outcomes by 0.10 to 0.20 standard deviations per year, affecting future earnings and poverty risk (meta-analysis range)[43]
Directional
15UNICEF and partners reported that school feeding can increase enrollment and attendance; typical measured impacts include attendance gains of several percentage points in evaluated programs[44]
Single source
16In 2023, the World Bank estimated IDA supported 19 countries with safety nets and jobs programs under COVID-19 response scale-up (programmatic outcomes)[45]
Verified
17The World Bank’s Results Framework reports 1.2 billion people reached by health or social protection services through projects (global aggregation)[46]
Verified
18The SDG 1.2.1 indicator tracks poverty reduction across countries; progress is monitored using national poverty lines and international lines (UN metadata)[47]
Verified
19The WHO estimates that universal health coverage could reduce catastrophic health expenditure incidence by measurable fractions; however specific global metric: 1 billion people spend at least 10% of household budget on health costs (WHO/World Bank)[48]
Directional
20The Global Partnership for Education reports it has financed education in 84 countries (policy implementation scale metric)[49]
Single source
21The World Bank reports that IDA commitments target human development outcomes including education and health with measurable indicators such as number of students supported (project results)[45]
Verified
22GPE’s 2021 replenishment included $2.8 billion in grant commitments (measurable donor finance) supporting education access to reduce poverty[37]
Verified
23UNICEF estimates that school closures during COVID-19 affected 1.6 billion learners worldwide (education loss increases poverty risk)[50]
Verified
24The World Bank reports that social protection can reduce the poverty headcount ratio by several percentage points depending on program coverage and transfer size (modeling evidence summary)[51]
Directional
25The SDG 1.4.1 metric monitors access to basic services; it is measured by national definitions of basic services (UN metadata)[52]
Single source
26SDG 1.5.1 tracks resilience to shocks for the poor using poverty and vulnerability metrics (UN metadata)[53]
Verified

Policy & Outcomes Interpretation

Across recent years, major poverty and human development efforts have reached enormous numbers, such as about 333 million people facing severe food insecurity in 2023 and 1.2 billion people reached through health or social protection services, while cash transfers and expanded education and health financing are repeatedly shown as practical routes to cut poverty.

References

  • 1unstats.un.org/sdgs/report/2023/goal-01/
  • 47unstats.un.org/sdgs/metadata/files/Metadata-01-02-01.pdf
  • 52unstats.un.org/sdgs/metadata/files/Metadata-01-04-01.pdf
  • 53unstats.un.org/sdgs/metadata/files/Metadata-01-05-01.pdf
  • 2worldbank.org/en/topic/poverty/brief/global-poverty-update
  • 5worldbank.org/en/topic/fragilityconflictviolence/brief/poverty-in-fragile-and-conflict-affected-situations
  • 40worldbank.org/en/publication/human-capital
  • 45worldbank.org/en/results
  • 46worldbank.org/en/about/annual-report
  • 3unicef.org/media/112351/file/Child%20poverty%20data%20and%20trends%20report%202022.pdf
  • 34unicef.org/documents/economic-impacts-social-protection-and-covid-19
  • 44unicef.org/documents/school-feeding-programmes-what-do-they-do
  • 50unicef.org/education/school-closures-continued-impact
  • 4hdr.undp.org/content/multidimensional-poverty-index-mpi
  • 6fao.org/documents/card/en/c/cc3017en
  • 17fao.org/worldfoodsituation/foodpricesindex/en/
  • 25fao.org/publications/sofi/2021/en/
  • 26fao.org/publications/sofi/2023/en/
  • 7internal-displacement.org/global-report/grid2024/
  • 8unhcr.org/refugee-statistics/insights
  • 18unhcr.org/refugee-statistics/
  • 9who.int/data/gho/indicator-metadata-registry/imr-details/3243
  • 11who.int/data/gho/indicator-metadata-registry/imr-details/3922
  • 12who.int/data/gho/indicator-metadata-registry/imr-details/3244
  • 24who.int/news-room/fact-sheets/detail/sanitation
  • 36who.int/news-room/fact-sheets/detail/infant-and-young-child-feeding
  • 41who.int/data/gho/indicator-metadata-registry/imr-details/3409
  • 48who.int/news-room/fact-sheets/detail/health-financing
  • 10washdata.org/data/household
  • 13iea.org/reports/sdg7-data-and-projections-access-to-electricity
  • 14documents.worldbank.org/en/publication/documents-reports/documentdetail/802591587469708912/the-covid-19-pandemic-shocks-to-education-and-poverty
  • 33documents.worldbank.org/en/publication/documents-reports/documentdetail/099112804032317343/poverty-and-social-protection-in-latin-america-and-the-caribbean
  • 35documents.worldbank.org/en/publication/documents-reports/documentdetail/665441468180224759/girls-education-and-better-work-for-women
  • 42documents.worldbank.org/en/publication/documents-reports/documentdetail/594881468259540673/poverty-and-social-impact-analysis
  • 51documents.worldbank.org/en/publication/documents-reports/documentdetail/104721468171652303/social-protection-and-poverty-reduction-in-the-latin-america-and-caribbean-region
  • 15imf.org/en/Publications/WEO/Issues/2020/06/24/WEOUpdateJune2020
  • 22imf.org/en/Publications/Policy-Papers/Issues/2022/05/19/IMF-Global-Financial-Stability-Report-May-2022
  • 16data.worldbank.org/indicator/FP.CPI.TOTL.ZG
  • 29data.worldbank.org/indicator/SI.POV.GINI
  • 19reliefweb.int/report/world/global-humanitarian-overview-2023
  • 20reliefweb.int/report/world/2024-global-humanitarian-overview
  • 21socialprotection.org/gimi/ShowRessource.action?id=5714
  • 23ipbes.net/global-assessment-report-biodiversity-ecosystem-services
  • 27data.unicef.org/resources/state-of-the-worlds-children-2023/
  • 28microdata.worldbank.org/index.php/catalog/poverty-forecasting-datasets
  • 30databank.worldbank.org/metadataglossary/world-development-indicators/series/si.pov.head.html
  • 31databank.worldbank.org/metadataglossary/world-development-indicators/series/si.pov.gaps.html
  • 32databank.worldbank.org/metadataglossary/world-development-indicators/series/si.pov.gaps2.html
  • 37globalpartnership.org/content/gpe-pledges-and-contributions
  • 49globalpartnership.org/who-we-are
  • 38gavi.org/results
  • 39theglobalfund.org/en/results/
  • 43thelancet.com/journals/lancet/article/PIIS0140-6736(19)32079-0/fulltext