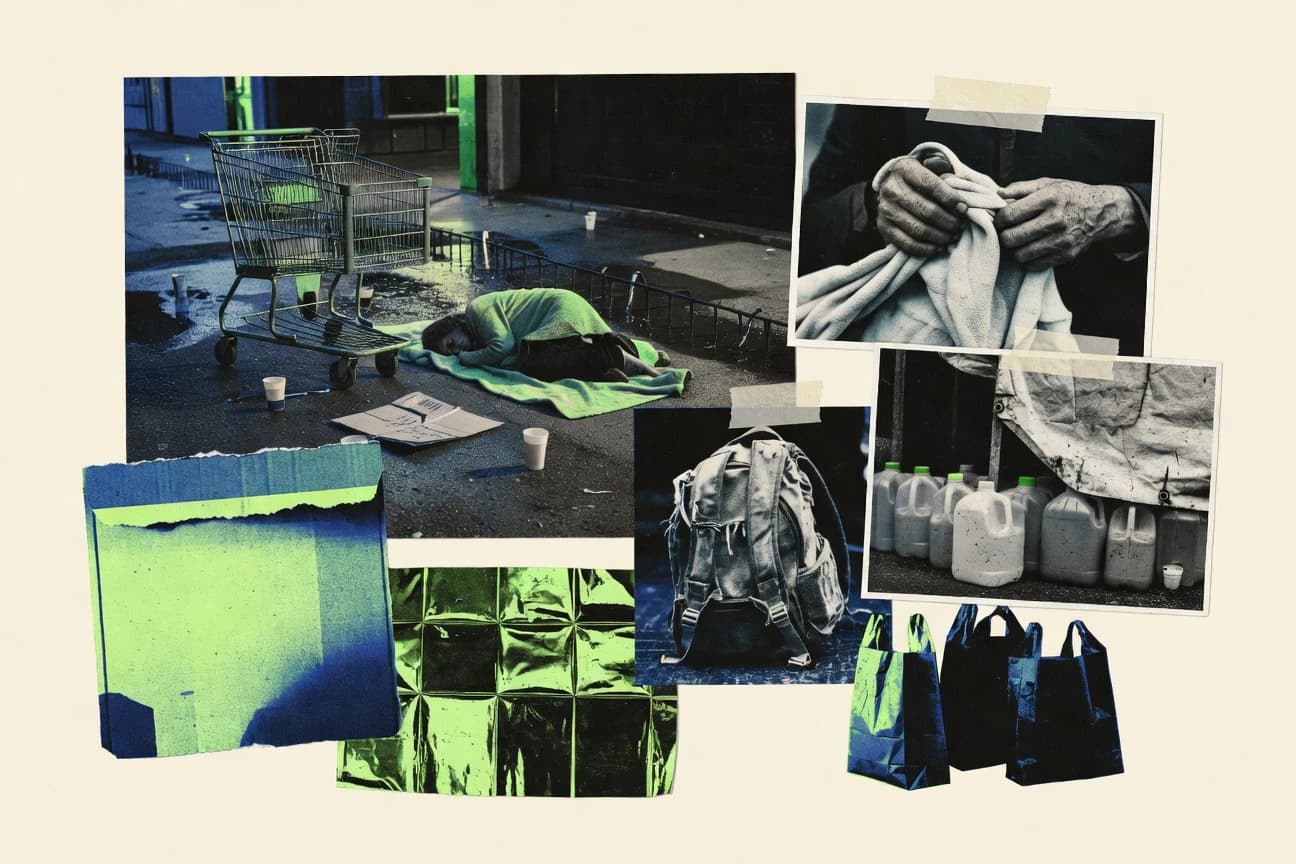
GitNux Logo
  • Editorial Process
Contact Us
Gitnux Logo
Contact Us
  • Home
  • Editorial Process
  • Contact Us
Gitnux Logo
  • Home
  • Blog
  • All Statistics
  • Services
  • Company
  • Privacy Policy
  • Contact
  • Partner
  • Careers
  • As Seen In

Our Services

Custom Market Research

Tailored research solutions designed around your specific business questions and strategic objectives.

Learn more →

Buy Industry Reports

Access comprehensive pre-made industry reports with instant download. Professional market intelligence at your fingertips.

Browse reports →

Software Advisory

Stop wasting months evaluating software vendors. Our analysts leverage 1,000+ AI-verified Best Lists to recommend the right tool for your business in 2–4 weeks.

Learn more →

Popular Categories

Ai In IndustryTechnology Digital MediaSafety AccidentsEntertainment EventsMedical Conditions DisordersMental Health PsychologyMarketing AdvertisingEducation LearningFinance Financial ServicesManufacturing EngineeringSocial Issues Societal TrendsPublic Safety CrimeHealthcare MedicineFood NutritionConsumer RetailHealth MedicineConstruction InfrastructureSports RecreationHr In IndustryDiversity Equity And Inclusion In IndustryGlobal Regional IndustriesBusiness FinanceCustomer Experience In IndustrySustainability In Industry

Find us on

Clutch · Sortlist · DesignRush · G2

GoodFirms · Crunchbase · Tracxn

How we make money

Gitnux.org is an independent market research platform. Primarily, we generate revenue on Gitnux through research projects we conduct for clients & external banner advertising. If we receive a commission for products or services, this is indicated with *.

© 2026 Gitnux. Independent market research platform.

Logos provided by Logo.dev

  1. Home
  2. Social Issues Societal Trends
  3. Poverty And Homelessness Statistics

GITNUXREPORT 2026

Poverty And Homelessness Statistics

Poverty persists globally despite some progress, with millions still living in extreme hardship.

130 statistics5 sections8 min readUpdated 2 days ago

Key Statistics

Statistic 1

In 2022, 9.1% of US children under 18 lived in poverty

Statistic 2

2021 child poverty rate fell to 5.2% under SPM due to child tax credit

Statistic 3

US child poverty affects 1 in 6 children, or 11 million

Statistic 4

Black children face 24.6% poverty rate in US 2022

Statistic 5

Hispanic children poverty at 20.6% in 2022 US

Statistic 6

40% of US homeless youth identify as LGBTQ+

Statistic 7

Foster care youth experience 20-25% homelessness post-exit

Statistic 8

Child poverty costs US $1 trillion annually in lost productivity

Statistic 9

1 in 7 US children lived in poverty in 2023 estimates

Statistic 10

Deep child poverty tripled in US 2022 after CTC expiration

Statistic 11

50% of US children in poverty spend at least half year poor

Statistic 12

Rural child poverty rate 20% higher than urban in US

Statistic 13

Single-mother families have 41% child poverty rate US 2022

Statistic 14

Food-insecure children in US numbered 8.8 million in 2022

Statistic 15

2.5 million US children homeless in 2022-23 school year

Statistic 16

Native American children have 32% poverty rate US

Statistic 17

Youth aging out of foster care have 20% poverty rate immediately

Statistic 18

Child poverty linked to 13% lower high school graduation

Statistic 19

28% of US children in low-income families below 200% FPL

Statistic 20

Immigrant children poverty rate 18% vs. 10% native-born US

Statistic 21

Head Start serves 800,000 poor children annually US

Statistic 22

1 million US children in extreme poverty (<$2/day)

Statistic 23

Child poverty in South highest at 18% regionally US 2022

Statistic 24

15% of US infants/toddlers in poverty 2022

Statistic 25

Homeless students up 16% to 1.4 million pre-K-12 US 2023

Statistic 26

In 2023, approximately 712 million people worldwide lived in extreme poverty (less than $2.15 per day)

Statistic 27

Sub-Saharan Africa accounted for 60% of the world's extreme poor in 2023

Statistic 28

The global extreme poverty rate fell from 10% in 2015 to 8.5% in 2023

Statistic 29

In 2022, 1.1 billion people lived in multidimensional poverty across 112 countries

Statistic 30

South Asia had 370 million people in extreme poverty in 2023

Statistic 31

Global poverty headcount ratio at $6.85 a day was 47% in low-income countries in 2023

Statistic 32

COVID-19 pushed 97 million more people into extreme poverty globally in 2020

Statistic 33

By 2030, 575 million people could still be in extreme poverty, mostly in sub-Saharan Africa

Statistic 34

In 2022, 3.3 billion people (40% of global population) lacked social protection, exacerbating poverty

Statistic 35

Extreme poverty rate in fragile states was 40% in 2023

Statistic 36

In 2023, 45% of people in least developed countries lived below $2.15/day

Statistic 37

Global hunger affected 735 million people in 2022, linked to poverty

Statistic 38

Women and girls represent 70% of the world's poor due to gender gaps

Statistic 39

In 2022, 2.8 billion people could not afford a healthy diet

Statistic 40

Poverty in conflict-affected countries doubled since 2015

Statistic 41

Latin America saw poverty rate drop to 27% in 2022 from 30% pre-pandemic

Statistic 42

Middle East and North Africa poverty rate at 15% in 2023

Statistic 43

East Asia poverty nearly eradicated at 1.2% in 2023

Statistic 44

Global child poverty affected 333 million in extreme poverty in 2022

Statistic 45

75% of extreme poor live in rural areas globally

Statistic 46

Climate change could push 132 million more into poverty by 2030

Statistic 47

In 2023, 4.2% of world population in severe multidimensional poverty

Statistic 48

Poverty gap index globally was 2.8% in 2022

Statistic 49

80% of global poor live in countries with high inequality

Statistic 50

By 2024, extreme poverty projected at 7.2%

Statistic 51

Sub-Saharan Africa poverty rate at 35% in 2023

Statistic 52

Global remittances to poor households reached $647 billion in 2022

Statistic 53

In 2022, 1 in 10 people worldwide were extremely poor

Statistic 54

Poverty in LDCs fell by 1% annually pre-COVID

Statistic 55

2023 global poverty rate at $3.65/day was 25%

Statistic 56

In 2022, 44 million people pushed into poverty by health spending

Statistic 57

In 2023 US, 40% of homeless had serious mental illness

Statistic 58

30% of US homeless reported substance use disorder 2023

Statistic 59

Black Americans 13% population but 37% homeless 2023 US

Statistic 60

Native Hawaiians/Pacific Islanders 1% pop, 24% homeless in HI

Statistic 61

LGBTQ+ youth 40% of homeless youth US

Statistic 62

Homelessness shortens life expectancy by 30 years US

Statistic 63

25% of homeless US women experienced domestic violence

Statistic 64

Veterans 9% of homeless despite 7% pop US 2023

Statistic 65

Homeless individuals 10x higher hospitalization rates

Statistic 66

50-60% of homeless have mental health conditions US

Statistic 67

Family homelessness impacts 300,000 children annually US

Statistic 68

Unaccompanied youth 5% of PIT homeless but higher needs

Statistic 69

Homelessness costs US $30k per person annually in services

Statistic 70

20% of homeless US are over 55 years old 2023

Statistic 71

Hispanic/Latino 6% overrepresented in homelessness US

Statistic 72

Housing First reduces homelessness costs by 40%

Statistic 73

Homeless students score 20% lower academically US

Statistic 74

38% of homeless have disabilities US 2023

Statistic 75

Domestic violence causes 25% of family homelessness

Statistic 76

COVID increased unsheltered by 20% in some areas

Statistic 77

Rapid rehousing diverts 85% from shelter US

Statistic 78

2023 encampment clearances displaced 50,000 US

Statistic 79

Mental health untreated leads to 2x recidivism homelessness

Statistic 80

Housing vouchers prevent homelessness for 60% recipients

Statistic 81

SNAP reduces homelessness risk by 14% US

Statistic 82

On a single night in 2023, 653,104 people experienced homelessness in US

Statistic 83

US homelessness rose 12% from 2022 to 2023 to 653k

Statistic 84

California had 181,399 homeless in 2023 PIT count

Statistic 85

New York state 91,271 homeless individuals 2023

Statistic 86

Family homelessness up 15.5% in US 2023 to 153,702

Statistic 87

Veterans homelessness down 7.5% to 35,000 in 2023 US

Statistic 88

Chronic homelessness affected 143,000 US people in 2023

Statistic 89

Unsheltered homelessness 64% of total in CA 2023

Statistic 90

US individual adults homeless numbered 386,000 in 2023 PIT

Statistic 91

Youth homelessness estimated 4.2x PIT at 700,000 annually US

Statistic 92

2023 saw record 2,800 encampments in US cities

Statistic 93

Sheltered homelessness down 4% nationally US 2023

Statistic 94

Florida homeless count up 35% to 25,959 in 2023

Statistic 95

DC had highest per capita homelessness rate 7.7 per 1k

Statistic 96

Seattle-King County 13,368 homeless 2023, up 20%

Statistic 97

Unsheltered rose 7% to 260,000 US 2023

Statistic 98

Emergency shelter use up in Northeast US 2023

Statistic 99

35 states saw homelessness increases over 10% 2023

Statistic 100

Hawaii homelessness up 50% to 6,000 in 2023

Statistic 101

Total US homeless beds 450,000 but 100k gap 2023

Statistic 102

In 2023, 28% of US homeless were families with children

Statistic 103

Chicago homeless 19,375 up 7% 2023

Statistic 104

National PIT count methodology covers 80% of US population

Statistic 105

2023 homelessness crisis driven by 20% rent hikes

Statistic 106

US official poverty rate was 11.5% in 2022, affecting 37.9 million people

Statistic 107

Supplemental Poverty Measure (SPM) was 12.4% in 2022 for US

Statistic 108

Child poverty rate in US dropped to 5.2% by SPM in 2021 due to expansions

Statistic 109

US poverty rate for Black Americans was 17.1% in 2022

Statistic 110

Hispanic US poverty rate stood at 16.9% in 2022

Statistic 111

Non-Hispanic White poverty rate was 8.6% in 2022 US

Statistic 112

US elderly poverty rate by SPM was 10.2% in 2022

Statistic 113

Deep poverty (below 50% threshold) affected 5.5% of US population in 2022

Statistic 114

Southern US states had poverty rates above 15% in 2022, e.g., Mississippi 19.1%

Statistic 115

Rural US poverty rate was 14.2% in 2022 vs. 11.1% urban

Statistic 116

Working poor in US numbered 6.1 million in 2022

Statistic 117

US poverty threshold for family of four was $27,750 in 2022

Statistic 118

2023 US poverty rate estimated at 12.4% preliminary

Statistic 119

Female-headed households had 23.4% poverty rate in US 2022

Statistic 120

Married couple families poverty rate 4.7% in US 2022

Statistic 121

US Native American poverty rate 23.3% on reservations

Statistic 122

Asian American poverty rate lowest at 9.5% in 2022 US

Statistic 123

US child poverty by official measure 12.4% in 2022

Statistic 124

Disability increased poverty risk by 25% in US 2022

Statistic 125

Food insecurity affected 12.8% of US households in 2022, linked to poverty

Statistic 126

Homelessness correlated with 25% higher poverty in high-cost areas

Statistic 127

US median income rose to $74,580 in 2022, but poverty persisted

Statistic 128

Extreme poverty in US (below $2/day) affected 613,000 in 2019

Statistic 129

2021 ARPA reduced child poverty by 30-50%

Statistic 130

US poverty rose in 2023 estimates to 12.9%

1/130
Sources
Trusted by 500+ publications
Harvard Business ReviewThe GuardianFortuneMicrosoftWorld Economic ForumFast Company
Harvard Business ReviewThe GuardianFortune+497
Helena Kowalczyk

Written by Helena Kowalczyk·Edited by Felix Zimmermann·Fact-checked by Nikolas Papadopoulos

Published Feb 13, 2026·Last verified Apr 18, 2026·Next review: Oct 2026
Fact-checked via 4-step process— how we build this report
01Primary Source Collection

Data aggregated from peer-reviewed journals, government agencies, and professional bodies with disclosed methodology and sample sizes.

02Editorial Curation

Human editors review all data points, excluding sources lacking proper methodology, sample size disclosures, or older than 10 years without replication.

03AI-Powered Verification

Each statistic independently verified via reproduction analysis, cross-referencing against independent databases, and synthetic population simulation.

04Human Cross-Check

Final human editorial review of all AI-verified statistics. Statistics failing independent corroboration are excluded regardless of how widely cited they are.

Read our full methodology →

Statistics that fail independent corroboration are excluded.

While global poverty rates have declined, the staggering reality that over 700 million people still survive on less than $2.15 a day reveals a crisis that is both deeply entrenched and alarmingly close to home.

Key Takeaways

  • 1In 2023, approximately 712 million people worldwide lived in extreme poverty (less than $2.15 per day)
  • 2Sub-Saharan Africa accounted for 60% of the world's extreme poor in 2023
  • 3The global extreme poverty rate fell from 10% in 2015 to 8.5% in 2023
  • 4US official poverty rate was 11.5% in 2022, affecting 37.9 million people
  • 5Supplemental Poverty Measure (SPM) was 12.4% in 2022 for US
  • 6Child poverty rate in US dropped to 5.2% by SPM in 2021 due to expansions
  • 7In 2022, 9.1% of US children under 18 lived in poverty
  • 82021 child poverty rate fell to 5.2% under SPM due to child tax credit
  • 9US child poverty affects 1 in 6 children, or 11 million
  • 10On a single night in 2023, 653,104 people experienced homelessness in US
  • 11US homelessness rose 12% from 2022 to 2023 to 653k
  • 12California had 181,399 homeless in 2023 PIT count
  • 13In 2023 US, 40% of homeless had serious mental illness
  • 1430% of US homeless reported substance use disorder 2023
  • 15Black Americans 13% population but 37% homeless 2023 US

Poverty persists globally despite some progress, with millions still living in extreme hardship.

Child and Youth Poverty

1In 2022, 9.1% of US children under 18 lived in poverty
Verified
22021 child poverty rate fell to 5.2% under SPM due to child tax credit
Verified
3US child poverty affects 1 in 6 children, or 11 million
Verified
4Black children face 24.6% poverty rate in US 2022
Directional
5Hispanic children poverty at 20.6% in 2022 US
Single source
640% of US homeless youth identify as LGBTQ+
Verified
7Foster care youth experience 20-25% homelessness post-exit
Verified
8Child poverty costs US $1 trillion annually in lost productivity
Verified
91 in 7 US children lived in poverty in 2023 estimates
Directional
10Deep child poverty tripled in US 2022 after CTC expiration
Single source
1150% of US children in poverty spend at least half year poor
Verified
12Rural child poverty rate 20% higher than urban in US
Verified
13Single-mother families have 41% child poverty rate US 2022
Verified
14Food-insecure children in US numbered 8.8 million in 2022
Directional
152.5 million US children homeless in 2022-23 school year
Single source
16Native American children have 32% poverty rate US
Verified
17Youth aging out of foster care have 20% poverty rate immediately
Verified
18Child poverty linked to 13% lower high school graduation
Verified
1928% of US children in low-income families below 200% FPL
Directional
20Immigrant children poverty rate 18% vs. 10% native-born US
Single source
21Head Start serves 800,000 poor children annually US
Verified
221 million US children in extreme poverty (<$2/day)
Verified
23Child poverty in South highest at 18% regionally US 2022
Verified
2415% of US infants/toddlers in poverty 2022
Directional
25Homeless students up 16% to 1.4 million pre-K-12 US 2023
Single source

Child and Youth Poverty Interpretation

A nation that allows its most innocent citizens to bear such disproportionate burdens of poverty, homelessness, and systemic neglect is not just failing its moral test but actively sabotaging its own future, one stolen childhood at a time.

Global Poverty

1In 2023, approximately 712 million people worldwide lived in extreme poverty (less than $2.15 per day)
Verified
2Sub-Saharan Africa accounted for 60% of the world's extreme poor in 2023
Verified
3The global extreme poverty rate fell from 10% in 2015 to 8.5% in 2023
Verified
4In 2022, 1.1 billion people lived in multidimensional poverty across 112 countries
Directional
5South Asia had 370 million people in extreme poverty in 2023
Single source
6Global poverty headcount ratio at $6.85 a day was 47% in low-income countries in 2023
Verified
7COVID-19 pushed 97 million more people into extreme poverty globally in 2020
Verified
8By 2030, 575 million people could still be in extreme poverty, mostly in sub-Saharan Africa
Verified
9In 2022, 3.3 billion people (40% of global population) lacked social protection, exacerbating poverty
Directional
10Extreme poverty rate in fragile states was 40% in 2023
Single source
11In 2023, 45% of people in least developed countries lived below $2.15/day
Verified
12Global hunger affected 735 million people in 2022, linked to poverty
Verified
13Women and girls represent 70% of the world's poor due to gender gaps
Verified
14In 2022, 2.8 billion people could not afford a healthy diet
Directional
15Poverty in conflict-affected countries doubled since 2015
Single source
16Latin America saw poverty rate drop to 27% in 2022 from 30% pre-pandemic
Verified
17Middle East and North Africa poverty rate at 15% in 2023
Verified
18East Asia poverty nearly eradicated at 1.2% in 2023
Verified
19Global child poverty affected 333 million in extreme poverty in 2022
Directional
2075% of extreme poor live in rural areas globally
Single source
21Climate change could push 132 million more into poverty by 2030
Verified
22In 2023, 4.2% of world population in severe multidimensional poverty
Verified
23Poverty gap index globally was 2.8% in 2022
Verified
2480% of global poor live in countries with high inequality
Directional
25By 2024, extreme poverty projected at 7.2%
Single source
26Sub-Saharan Africa poverty rate at 35% in 2023
Verified
27Global remittances to poor households reached $647 billion in 2022
Verified
28In 2022, 1 in 10 people worldwide were extremely poor
Verified
29Poverty in LDCs fell by 1% annually pre-COVID
Directional
302023 global poverty rate at $3.65/day was 25%
Single source
31In 2022, 44 million people pushed into poverty by health spending
Verified

Global Poverty Interpretation

The bleak math of our progress reveals a starkly divided world: while East Asia has nearly conquered extreme poverty, a resilient and growing stronghold of it persists, with Sub-Saharan Africa alone accounting for three-fifths of the globe's most destitute, reminding us that success in one region is a fragile victory when hundreds of millions elsewhere remain trapped in deprivation.

Homelessness Demographics and Impacts

1In 2023 US, 40% of homeless had serious mental illness
Verified
230% of US homeless reported substance use disorder 2023
Verified
3Black Americans 13% population but 37% homeless 2023 US
Verified
4Native Hawaiians/Pacific Islanders 1% pop, 24% homeless in HI
Directional
5LGBTQ+ youth 40% of homeless youth US
Single source
6Homelessness shortens life expectancy by 30 years US
Verified
725% of homeless US women experienced domestic violence
Verified
8Veterans 9% of homeless despite 7% pop US 2023
Verified
9Homeless individuals 10x higher hospitalization rates
Directional
1050-60% of homeless have mental health conditions US
Single source
11Family homelessness impacts 300,000 children annually US
Verified
12Unaccompanied youth 5% of PIT homeless but higher needs
Verified
13Homelessness costs US $30k per person annually in services
Verified
1420% of homeless US are over 55 years old 2023
Directional
15Hispanic/Latino 6% overrepresented in homelessness US
Single source
16Housing First reduces homelessness costs by 40%
Verified
17Homeless students score 20% lower academically US
Verified
1838% of homeless have disabilities US 2023
Verified
19Domestic violence causes 25% of family homelessness
Directional
20COVID increased unsheltered by 20% in some areas
Single source
21Rapid rehousing diverts 85% from shelter US
Verified
222023 encampment clearances displaced 50,000 US
Verified
23Mental health untreated leads to 2x recidivism homelessness
Verified
24Housing vouchers prevent homelessness for 60% recipients
Directional
25SNAP reduces homelessness risk by 14% US
Single source

Homelessness Demographics and Impacts Interpretation

America's homelessness crisis is a brutal arithmetic where being Black, a veteran, or a young LGBTQ+ person drastically increases your odds of losing everything, while the cost of leaving people on the streets—in shattered lives, overwhelmed hospitals, and wasted potential—proves that decency is far cheaper than neglect.

Homelessness Prevalence

1On a single night in 2023, 653,104 people experienced homelessness in US
Verified
2US homelessness rose 12% from 2022 to 2023 to 653k
Verified
3California had 181,399 homeless in 2023 PIT count
Verified
4New York state 91,271 homeless individuals 2023
Directional
5Family homelessness up 15.5% in US 2023 to 153,702
Single source
6Veterans homelessness down 7.5% to 35,000 in 2023 US
Verified
7Chronic homelessness affected 143,000 US people in 2023
Verified
8Unsheltered homelessness 64% of total in CA 2023
Verified
9US individual adults homeless numbered 386,000 in 2023 PIT
Directional
10Youth homelessness estimated 4.2x PIT at 700,000 annually US
Single source
112023 saw record 2,800 encampments in US cities
Verified
12Sheltered homelessness down 4% nationally US 2023
Verified
13Florida homeless count up 35% to 25,959 in 2023
Verified
14DC had highest per capita homelessness rate 7.7 per 1k
Directional
15Seattle-King County 13,368 homeless 2023, up 20%
Single source
16Unsheltered rose 7% to 260,000 US 2023
Verified
17Emergency shelter use up in Northeast US 2023
Verified
1835 states saw homelessness increases over 10% 2023
Verified
19Hawaii homelessness up 50% to 6,000 in 2023
Directional
20Total US homeless beds 450,000 but 100k gap 2023
Single source
21In 2023, 28% of US homeless were families with children
Verified
22Chicago homeless 19,375 up 7% 2023
Verified
23National PIT count methodology covers 80% of US population
Verified
242023 homelessness crisis driven by 20% rent hikes
Directional

Homelessness Prevalence Interpretation

While we rightly celebrate a decline in veteran homelessness, the overall 12% leap to 653,000 people without a home, driven by punishing rent hikes, reveals a nation that is brilliant at creating value but disastrous at providing shelter.

US Poverty Rates

1US official poverty rate was 11.5% in 2022, affecting 37.9 million people
Verified
2Supplemental Poverty Measure (SPM) was 12.4% in 2022 for US
Verified
3Child poverty rate in US dropped to 5.2% by SPM in 2021 due to expansions
Verified
4US poverty rate for Black Americans was 17.1% in 2022
Directional
5Hispanic US poverty rate stood at 16.9% in 2022
Single source
6Non-Hispanic White poverty rate was 8.6% in 2022 US
Verified
7US elderly poverty rate by SPM was 10.2% in 2022
Verified
8Deep poverty (below 50% threshold) affected 5.5% of US population in 2022
Verified
9Southern US states had poverty rates above 15% in 2022, e.g., Mississippi 19.1%
Directional
10Rural US poverty rate was 14.2% in 2022 vs. 11.1% urban
Single source
11Working poor in US numbered 6.1 million in 2022
Verified
12US poverty threshold for family of four was $27,750 in 2022
Verified
132023 US poverty rate estimated at 12.4% preliminary
Verified
14Female-headed households had 23.4% poverty rate in US 2022
Directional
15Married couple families poverty rate 4.7% in US 2022
Single source
16US Native American poverty rate 23.3% on reservations
Verified
17Asian American poverty rate lowest at 9.5% in 2022 US
Verified
18US child poverty by official measure 12.4% in 2022
Verified
19Disability increased poverty risk by 25% in US 2022
Directional
20Food insecurity affected 12.8% of US households in 2022, linked to poverty
Single source
21Homelessness correlated with 25% higher poverty in high-cost areas
Verified
22US median income rose to $74,580 in 2022, but poverty persisted
Verified
23Extreme poverty in US (below $2/day) affected 613,000 in 2019
Verified
242021 ARPA reduced child poverty by 30-50%
Directional
25US poverty rose in 2023 estimates to 12.9%
Single source

US Poverty Rates Interpretation

While policy can create profound victories, like dramatically cutting child poverty, the stubborn and uneven persistence of deprivation across race, region, and family structure proves that for millions of Americans, prosperity remains a country they can see but cannot afford to live in.

Sources & References

  • WORLDBANK logo
    Reference 1
    WORLDBANK
    worldbank.org
    Visit source
  • OURWORLDINDATA logo
    Reference 2
    OURWORLDINDATA
    ourworldindata.org
    Visit source
  • OPHI logo
    Reference 3
    OPHI
    ophi.org.uk
    Visit source
  • DATA logo
    Reference 4
    DATA
    data.worldbank.org
    Visit source
  • ILOSTAT logo
    Reference 5
    ILOSTAT
    ilostat.ilo.org
    Visit source
  • UNCTAD logo
    Reference 6
    UNCTAD
    unctad.org
    Visit source
  • FAO logo
    Reference 7
    FAO
    fao.org
    Visit source
  • UNWOMEN logo
    Reference 8
    UNWOMEN
    unwomen.org
    Visit source
  • CEPAL logo
    Reference 9
    CEPAL
    cepal.org
    Visit source
  • UNICEF logo
    Reference 10
    UNICEF
    unicef.org
    Visit source
  • OXFAM logo
    Reference 11
    OXFAM
    oxfam.org
    Visit source
  • AFDB logo
    Reference 12
    AFDB
    afdb.org
    Visit source
  • SDGS logo
    Reference 13
    SDGS
    sdgs.un.org
    Visit source
  • UN logo
    Reference 14
    UN
    un.org
    Visit source
  • WHO logo
    Reference 15
    WHO
    who.int
    Visit source
  • CENSUS logo
    Reference 16
    CENSUS
    census.gov
    Visit source
  • CBPP logo
    Reference 17
    CBPP
    cbpp.org
    Visit source
  • ERS logo
    Reference 18
    ERS
    ers.usda.gov
    Visit source
  • BLS logo
    Reference 19
    BLS
    bls.gov
    Visit source
  • ASPE logo
    Reference 20
    ASPE
    aspe.hhs.gov
    Visit source
  • NLIHC logo
    Reference 21
    NLIHC
    nlihc.org
    Visit source
  • NBER logo
    Reference 22
    NBER
    nber.org
    Visit source
  • NYTIMES logo
    Reference 23
    NYTIMES
    nytimes.com
    Visit source
  • AECF logo
    Reference 24
    AECF
    aecf.org
    Visit source
  • NCCD logo
    Reference 25
    NCCD
    nccd.cdc.gov
    Visit source
  • HUDUSER logo
    Reference 26
    HUDUSER
    huduser.gov
    Visit source
  • CHILDWELFARE logo
    Reference 27
    CHILDWELFARE
    childwelfare.gov
    Visit source
  • UNICEFUSA logo
    Reference 28
    UNICEFUSA
    unicefusa.org
    Visit source
  • URBAN logo
    Reference 29
    URBAN
    urban.org
    Visit source
  • FEEDINGAMERICA logo
    Reference 30
    FEEDINGAMERICA
    feedingamerica.org
    Visit source
  • NCHE logo
    Reference 31
    NCHE
    nche.ed.gov
    Visit source
  • CHILDTRENDS logo
    Reference 32
    CHILDTRENDS
    childtrends.org
    Visit source
  • MIGRATIONPOLICY logo
    Reference 33
    MIGRATIONPOLICY
    migrationpolicy.org
    Visit source
  • ECLKC logo
    Reference 34
    ECLKC
    eclkc.ohs.acf.hhs.gov
    Visit source
  • ZEROTOTHREE logo
    Reference 35
    ZEROTOTHREE
    zerotothree.org
    Visit source
  • ENDHOMELESSNESS logo
    Reference 36
    ENDHOMELESSNESS
    endhomelessness.org
    Visit source
  • HUDEXCHANGE logo
    Reference 37
    HUDEXCHANGE
    hudexchange.info
    Visit source
  • NEWS logo
    Reference 38
    NEWS
    news.va.gov
    Visit source
  • HCD logo
    Reference 39
    HCD
    hcd.ca.gov
    Visit source
  • USICH logo
    Reference 40
    USICH
    usich.gov
    Visit source
  • VOICEOFYOUTH logo
    Reference 41
    VOICEOFYOUTH
    voiceofyouth.org
    Visit source
  • USATODAY logo
    Reference 42
    USATODAY
    usatoday.com
    Visit source
  • KINGCOUNTY logo
    Reference 43
    KINGCOUNTY
    kingcounty.gov
    Visit source
  • NAEH logo
    Reference 44
    NAEH
    naeh.org
    Visit source
  • CHICAGOTRIBUNE logo
    Reference 45
    CHICAGOTRIBUNE
    chicagotribune.com
    Visit source
  • NATIONALHOMELESS logo
    Reference 46
    NATIONALHOMELESS
    nationalhomeless.org
    Visit source
  • NCBI logo
    Reference 47
    NCBI
    ncbi.nlm.nih.gov
    Visit source
  • KFF logo
    Reference 48
    KFF
    kff.org
    Visit source
  • SAMHSA logo
    Reference 49
    SAMHSA
    samhsa.gov
    Visit source
  • FAMILYHOMELESSNESS logo
    Reference 50
    FAMILYHOMELESSNESS
    familyhomelessness.org
    Visit source
  • WWW HUD logo
    Reference 51
    WWW HUD
    www HUD.gov
    Visit source
  • NAMI logo
    Reference 52
    NAMI
    nami.org
    Visit source

Logos provided by Logo.dev

On this page

  1. 01Key Takeaways
  2. 02Child and Youth Poverty
  3. 03Global Poverty
  4. 04Homelessness Demographics and Impacts
  5. 05Homelessness Prevalence
  6. 06US Poverty Rates
Helena Kowalczyk

Helena Kowalczyk

Author

Felix Zimmermann
Editor
Nikolas Papadopoulos
Fact Checker

Our Commitment to Accuracy

  • Rigorous fact-checking process
  • Data from reputable sources
  • Regular updates to ensure relevance
Learn more

Explore More In This Category

  • Transgender Discrimination Statistics
  • Gender Inequality In The United States Statistics
  • Diet Culture Statistics
  • Homeless Veterans Statistics
  • Rural Health Disparities Statistics
  • Veteran Homeless Statistics