GITNUX MARKETDATA
Browse Our Category
Sustainability In Industry
Latest update:


Battery Recycling Statistics
Start with the 2026 milestone that requires a Digital Battery Passport for every battery placed on the EU market, then measure how that push intersects with recovery performance and economics, from 90%+ lithium recovery in pilot hydrometallurgy to up to a 20% yield boost from better sorting and disassembly. You will also see why the recycling pipeline is scaling fast, with 35% of global recycling revenues attributed to Europe in 2023 alongside investment of $1.6 billion in 2022, and why forecasts point to $3.7 billion for the sector by 2031 as EV battery stock becomes tomorrow’s feedstock.

Sustainability In The Esports Industry Statistics
As esports pushes for greener performance, the latest figures reveal how sustainability progress varies sharply by platform and partnership, not evenly across the industry. See the 2025 benchmarks that separate measurable waste and energy gains from what is still just promise.
Sustainability In The Video Game Industry Statistics
A surprising share of the game economy is quietly tied to power and reporting standards, from data centers using only about a 10 percent slice less energy after efficiency upgrades to 66 percent of operators tracking IT energy at a granular level. See how clean energy funding, science based target leadership at 91 percent, and energy efficient streaming and consolidation pressures are reshaping the sustainability footprint behind console revenue and esports.
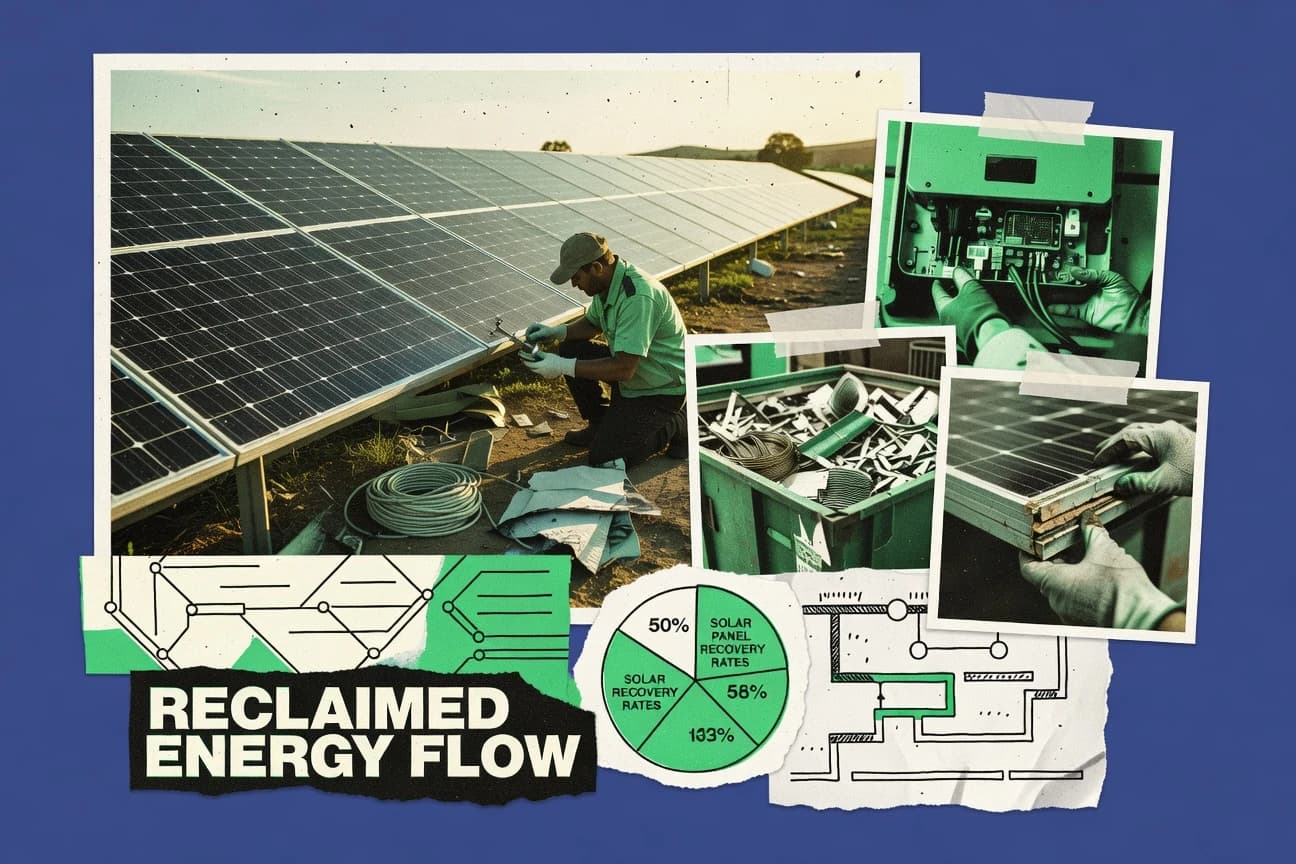
Sustainability In The Solar Industry Statistics
Global solar investment hit $500 billion in 2023 and the levelized cost of solar PV fell to $0.049 per kWh, while the US added 264,000 jobs that year. From module prices dropping to $0.11 per watt to record greenhouse gas savings and rapidly improving payback periods, this dataset connects finance, manufacturing, and emissions in one clear story. If you want to see which sustainability claims hold up across markets and technologies, keep going.
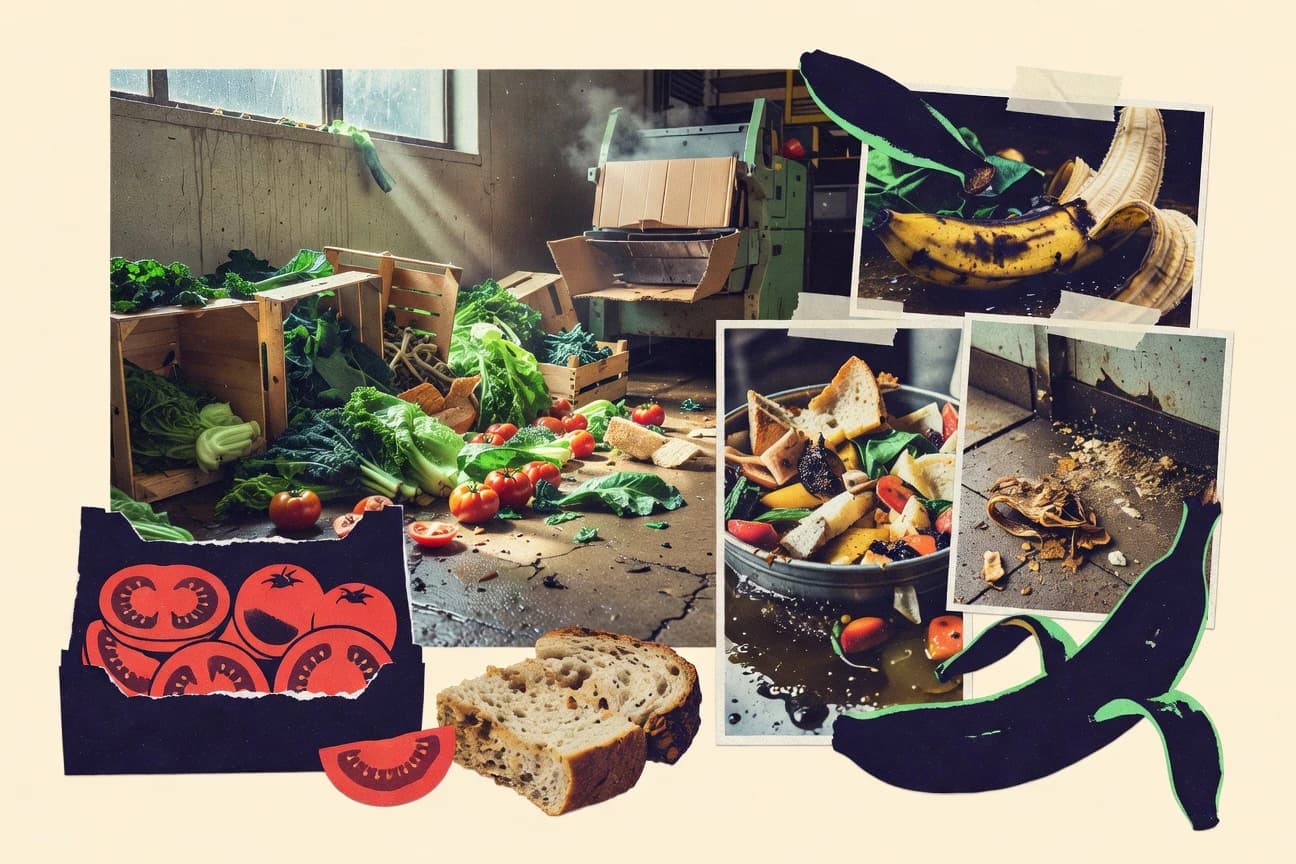
Food Waste Global Statistics
Food Waste Global pulls together a hard reality check for 2024 and beyond, from 1.6 billion tonnes of food lost and wasted each year and US$1.6 trillion in economic cost to a $24.6 billion food waste market value that keeps growing alongside landfill methane and freshwater waste. You will also see how policy and technology are reshaping the outcome, including the EU’s 2025 Farm to Fork target and anaerobic digestion pathways that can cut greenhouse gas emissions by 50 to 90 percent compared with landfilling.

Sustainability In The Mortgage Industry Statistics
See how sustainability is moving from “nice-to-have” to measurable mortgage performance, with energy efficient portfolios showing a 12% lower probability of foreclosure and a 14.2% default-rate reduction in Nordic long term data. The page also tracks where the market is heading as 58% of mortgage lenders plan to use climate scenario analysis by 2024, alongside the sharp cost and risk tradeoffs like higher flood insurance premiums in FEMA zones and tighter ESG eligibility controls.

Sustainability In The Procurement Industry Statistics
While food, buildings, and packaging keep widening the procurement carbon and waste footprint, the pressure is also getting personal fast with 34% of procurement functions reporting ESG regulatory requirements raised their compliance costs and 1 in 5 companies struggling to get supplier ESG data in time for deadlines. This page lines up the most decision critical figures, from 3.2% of global GDP at value risk to circular economy and lifecycle cost savings, to show exactly where sustainable procurement pays off and where it can still break.
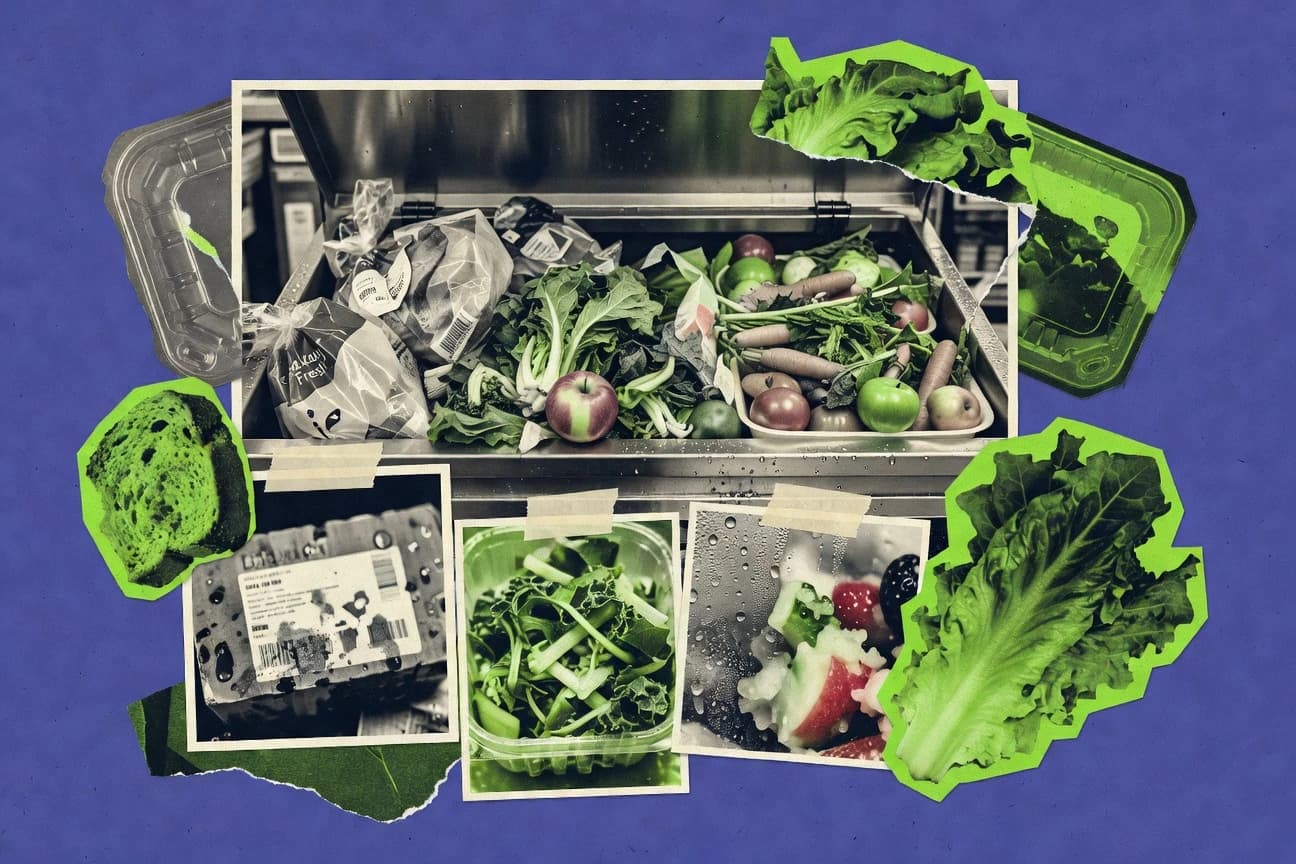
American Food Waste Statistics
Food waste is still the biggest slice of what landfills take, with 20% of municipal solid waste landfilled in 2018 being food waste, yet the U.S. has built its policy around the Food Recovery Hierarchy and clear national targets to cut loss and waste by 50% by 2030. You will also see what it costs households, how much climate pollution is tied to disposal and methane, and which recovery and composting moves deliver the biggest reductions.

Sustainability In The Biotechnology Industry Statistics
By 2026, sustainability pressures have moved from strategy to measurable outcomes with major shifts across energy use, emissions, and waste in biotech operations. See how these 2026 signals contrast with earlier baselines, and what they suggest for investors, regulators, and companies trying to cut impact without slowing innovation.
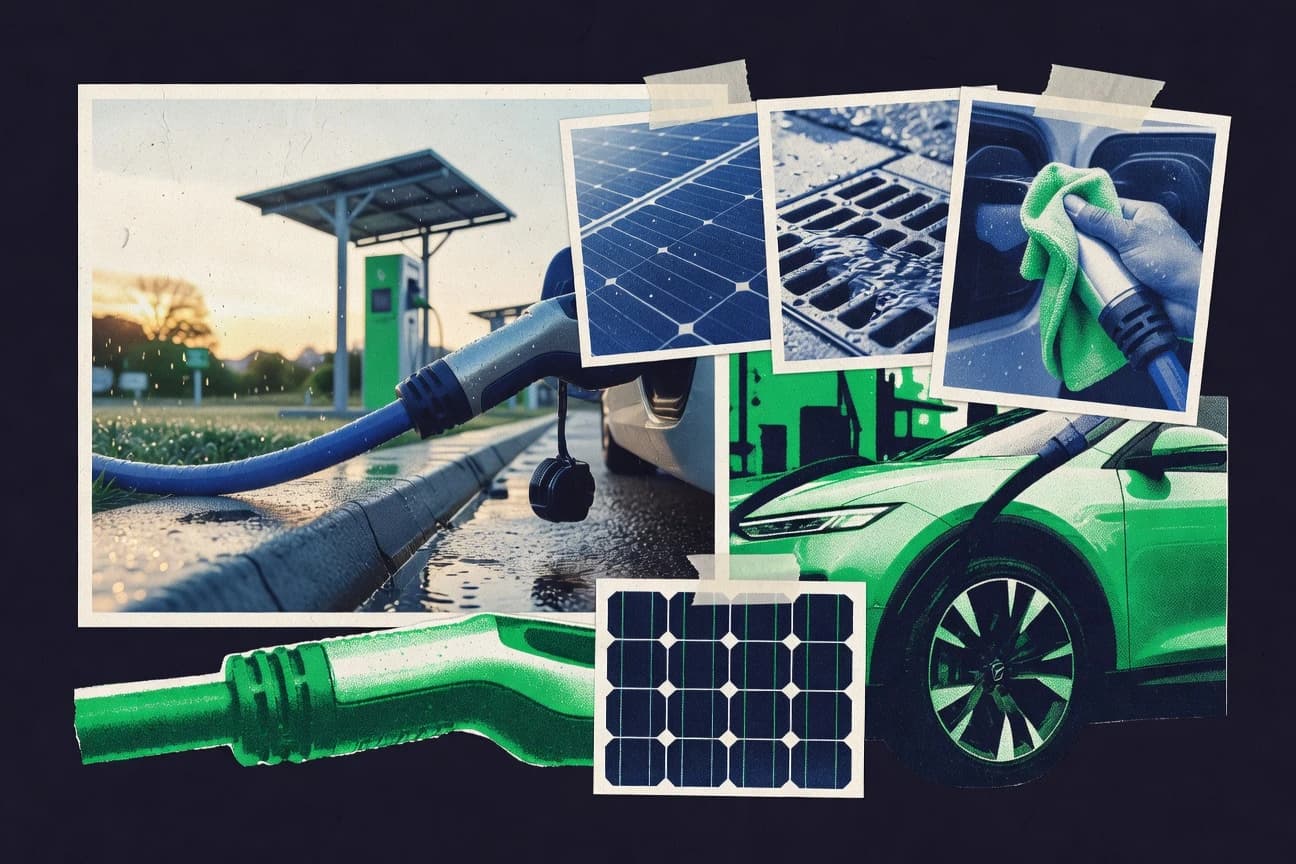
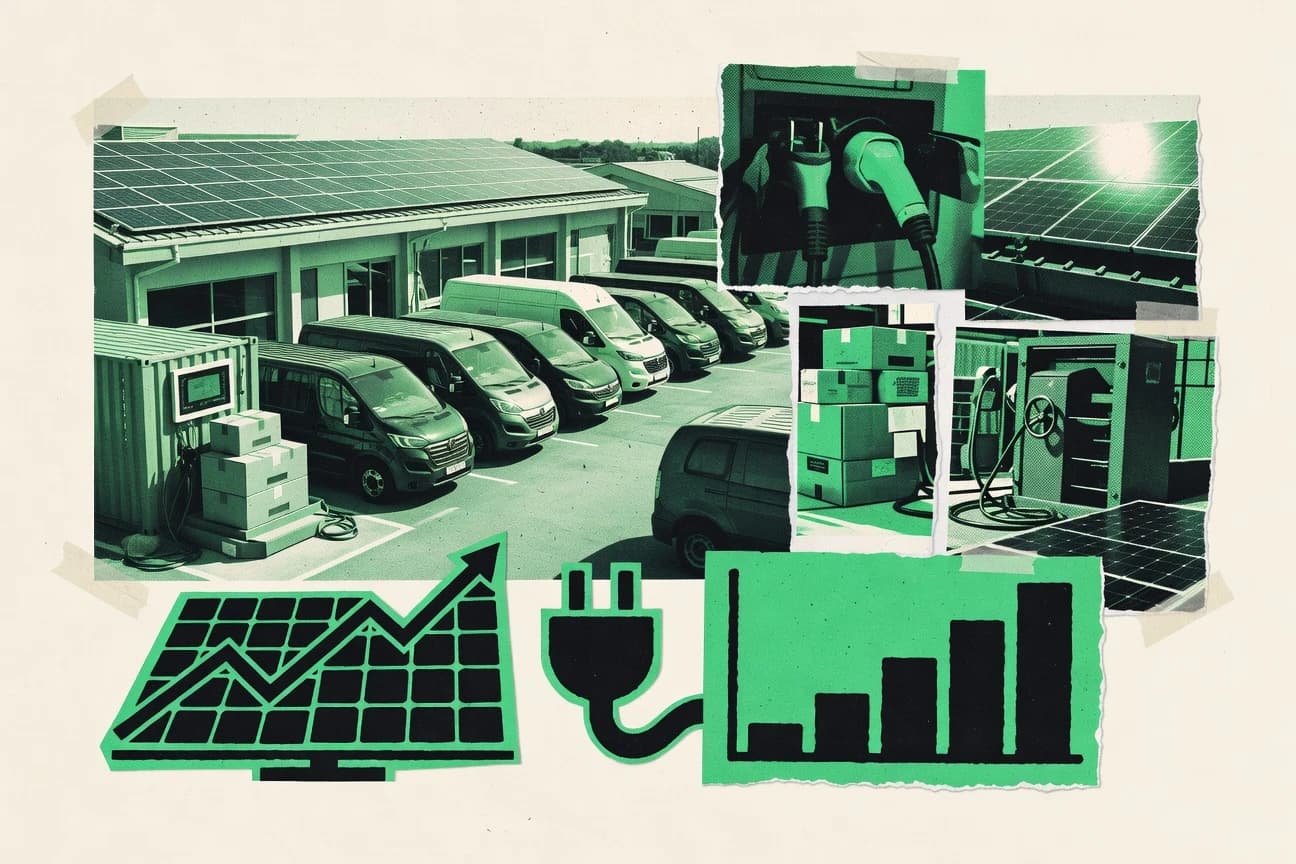
Sustainability In The Ev Industry Statistics
With 430 GW of new solar PV added globally in 2023 and 70% of new battery investment still landing in utility-scale systems, EV climate gains hinge on whether cleaner power and grid flexibility can keep up with adoption friction, because 45% of potential buyers worry about charging access. This page pairs that supply side with the stuff that usually gets ignored, from 15% of European chargers reported non-operational to EU battery and sustainability rules tightening from 2024, plus lifecycle metrics like tailpipe emissions at zero and durability at 200,000 km.

Sustainability In The Technology Industry Statistics
A tight look at sustainability metrics in the technology industry, where cleaner operations and smarter sourcing are finally being measured against hard numbers like 2026 energy use intensity and 2025 progress on renewables adoption. See where targets are accelerating and where they stall, so you can separate credible operational gains from wishful reporting.
Green Economy Statistics
Green Economy statistics show a sharp split between rising clean energy momentum and the slower pace of economy wide decarbonization, with 2026 figures setting the tone for what is accelerating now and what still lags. Get the ratios, the coverage, and the turning points in one place so you can see where policy, investment, and real world emissions are moving in opposite directions.

Sustainability In The Food Packaging Industry Statistics
Plastic waste is still leaking into the environment, while the EU tightens by 2025 to require packaging that is recyclable by design in practice, and meanwhile 44% of executives say sustainability is already a major driver of packaging investment. This page connects the incentives and the frictions, from 55% of consumers struggling to recycle certain formats to the scale of the shift in sustainable packaging markets and the evidence on what really cuts climate and material impacts.

Sustainability In The Retail Industry Statistics
See how retail sustainability is shifting from promises to measurable outcomes, from soaring investment in circular initiatives to deeper cuts in high impact emissions and waste. The 2026 signals make the contrast hard to ignore and help you spot what is accelerating for real versus what is still lagging behind.

Waste Statistics
Europe still sends about 17% of municipal waste to landfill, while China has already pushed incineration to 56% and the US keeps generating plastics at an estimated 27.6 million tons in 2022. Follow how policy tools like EU bottle collection targets, EPR rules, and landfill methane capture reshape recycling, energy recovery, and emissions as global waste grows toward 2050.

Sustainability In The Culinary Industry Statistics
From a 27% global food waste reduction target by 2030 to a $8.0 billion 2023 market for food waste management, this page maps where progress is most likely to stick and where it keeps slipping, especially into household and post harvest storage losses. You will also see how packaging, composting, cold chain logistics, and smart kitchen tools are reshaping emissions and costs alongside proof points like 1.6× higher profit odds for sustainability certified firms and 75% of EU municipal food waste needing separate collection by end 2024.

Sustainability In The Education Industry Statistics
From 51% of school leaders using sustainability curriculum to the projected $25.2 billion sustainability management software market by 2030, the page connects classroom practice to measurable emissions, e-waste and compliance pressure. You will see how transport and buildings reshape campus sustainability decisions, from diesel bus CO2 rates to nearly zero energy requirements for new school facilities.
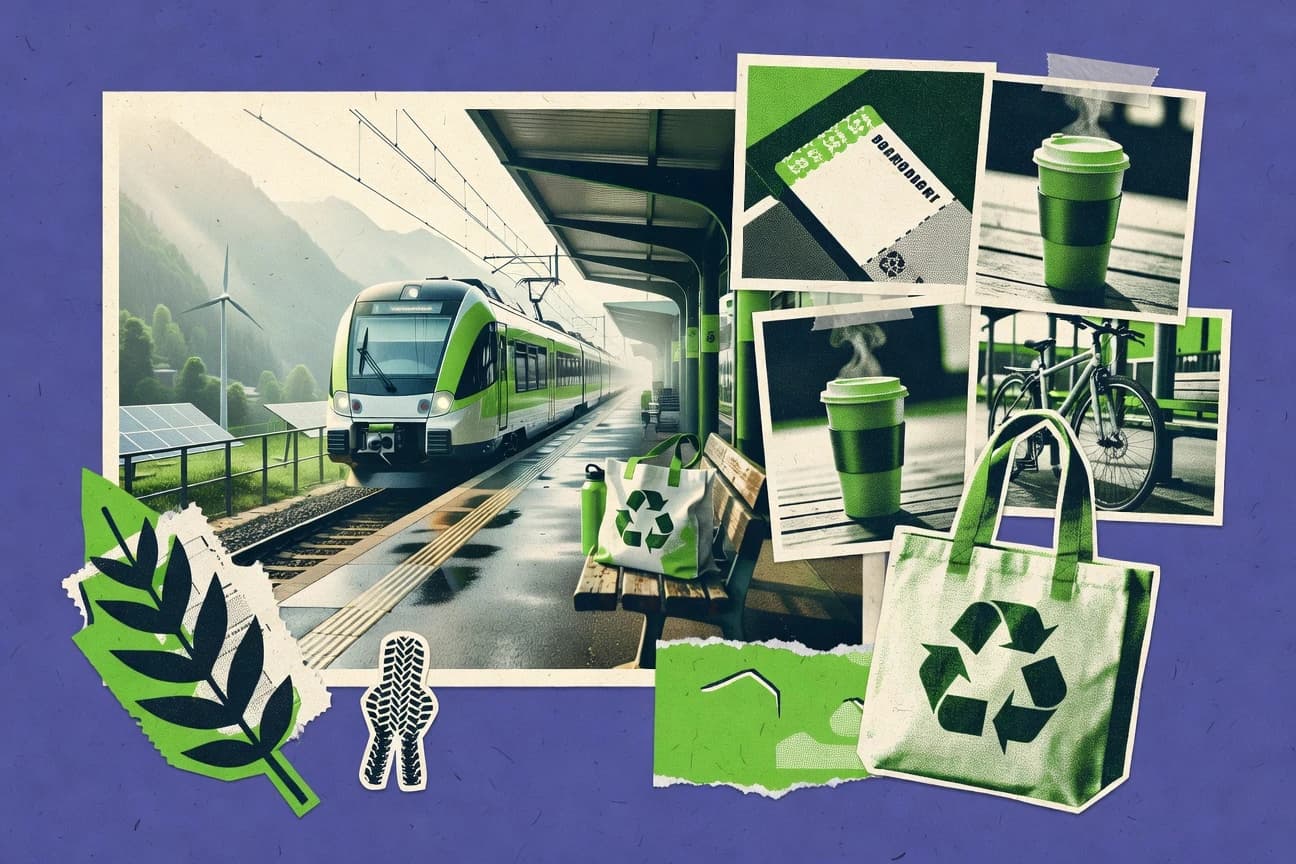
Sustainability In The Travel Industry Statistics
Transportation drives about 20% of global greenhouse gas emissions, yet travelers are demanding action fast, with 61% saying sustainability influences where they book and 40% adjusting plans due to sustainability concerns. Policy and reporting pressure is tightening too, from EU flight emissions rules to CSRD moving more companies into disclosure by an estimated 50,000, while hotel efficiency upgrades can cut energy use by up to 45% and reduce water use by 15 to 25%.
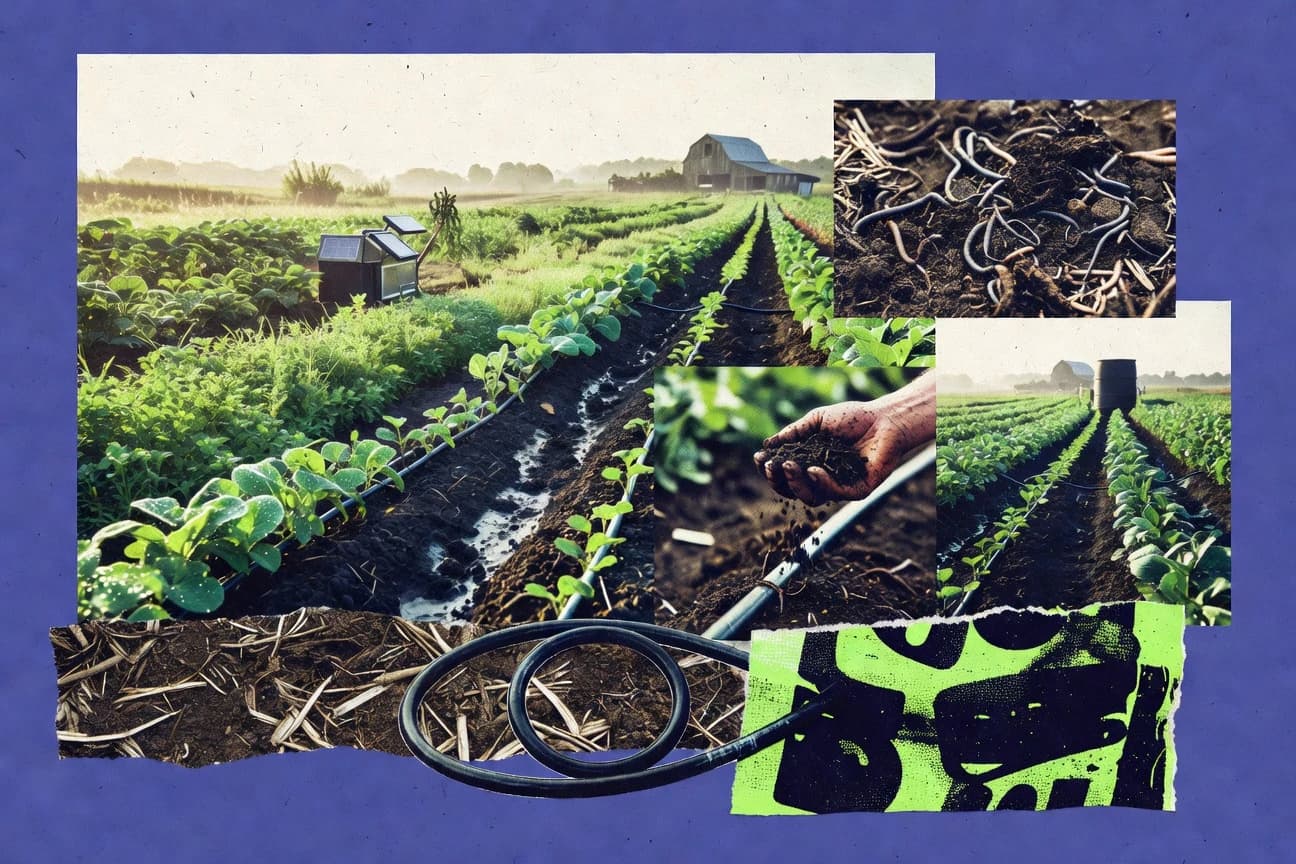
Sustainability In The Farming Industry Statistics
From 10.7% of global greenhouse gases coming from agriculture and 33% of food lost before retail, to soil erosion and nitrogen pollution that still persist at scale, these 2025 ready farming statistics show where sustainability efforts deliver and where they fall short. You will also see the sharp policy and practice tension behind change, including a projected US$ 125 billion per year in harmful subsidies versus a US$ 250 billion annual investment gap for climate smart farming.

Sustainability In The Fashion Industry Statistics
Fast fashion’s footprint is still shrinking slower than its marketing, even as sustainability commitments multiply. Get the latest 2025 and 2026 benchmarks behind garment waste, supply chain emissions, and recycling claims to see exactly where progress is measurable and where it is mostly promise.