GITNUX MARKETDATA
Browse Our Category
Sustainability In Industry
Latest update:


Sustainability In The Floral Industry Statistics
47% of food system emissions come from agriculture and land use, yet cut flower carbon footprints can swing most with greenhouse heating and lighting, fertilizer-linked N2O, and even store to home transport, so the biggest wins are upstream and energy driven. With the global cut flowers and foliage market now valued at $16.3 billion in 2023 and EU rules pushing renewables to at least 42.5% by 2030, this page connects the dots between climate math, pesticide and fertilizer compliance, and what certified supply chains must prove to stay competitive.

Sustainability In The Animation Industry Statistics
A sharp shift is underway in how animation production thinks about sustainability, and the latest figures are hard to ignore. From concrete energy and material signals to what creators are or are not measuring, these 2025 and 2026 stats expose where progress is real and where it is still mostly intent.
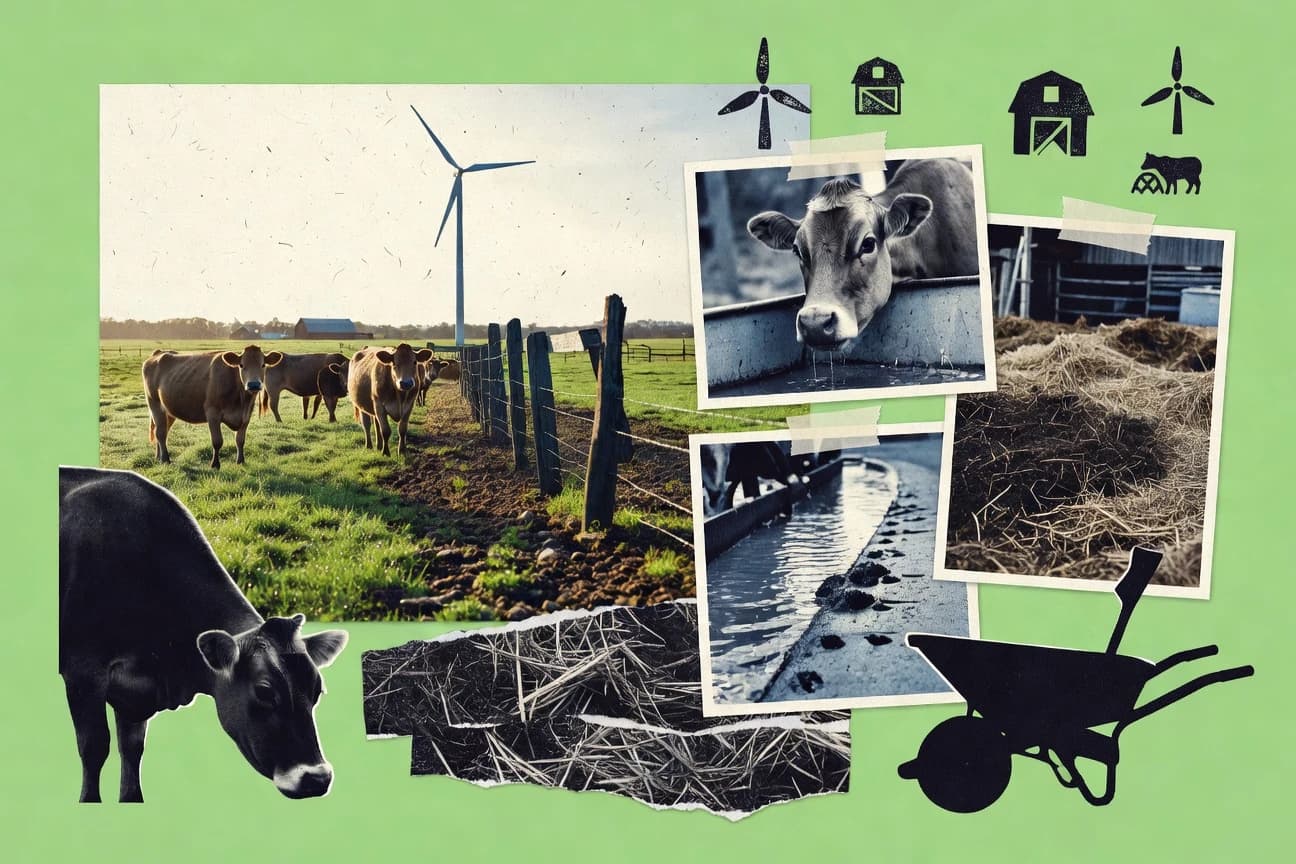
Sustainability In The Beef Industry Statistics
Beef is tied to habitat loss and emissions at a scale that reshapes biodiversity and climate risk, including global production contributing about 4.6% of total anthropogenic greenhouse gases, mainly methane from enteric fermentation. The page pairs that pressure with workable fixes, like regenerative and rotational grazing that can boost pollinator habitats by 25% and cut net greenhouse emissions by up to 1.2 tons CO2e per hectare each year through soil carbon gains.
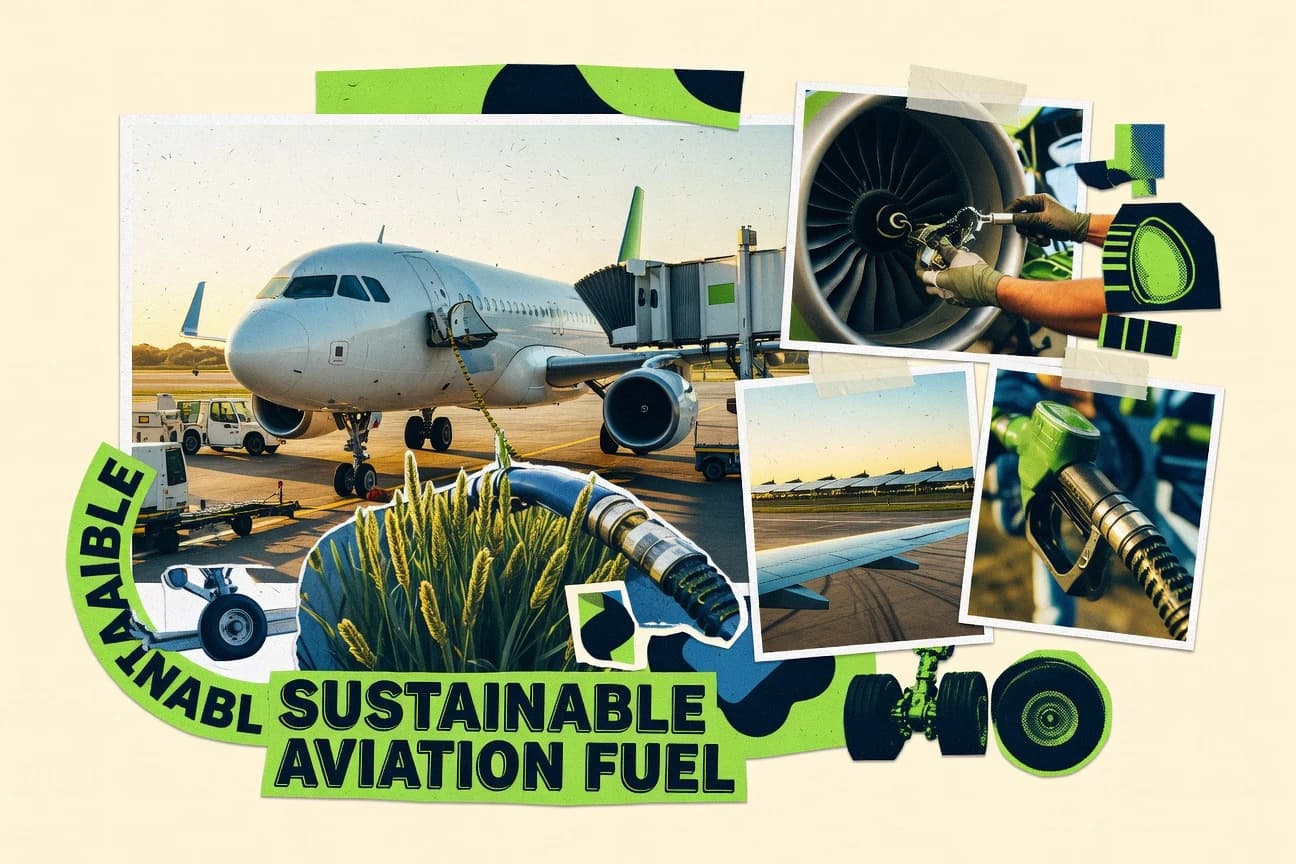
Sustainability In The Aviation Industry Statistics
See how 2026 forecasts challenge comfort zone assumptions about aviation emissions and efficiency, with hard figures that move beyond promises to measurable progress. You will also find the latest safety, reporting, and sustainability trends that shape where airlines and regulators are actually putting their money next.

Sustainability In The High Tech Industry Statistics
See how fast the sustainability gap is widening and what it looks like in hard totals for 2025, from data centers becoming a dominant driver of emissions and embodied carbon to e-waste leakage that still leaves roughly 48 million tons unmanaged after formal recycling. The page pairs big tech and semiconductor benchmarks with energy, water, and materials constraints so you can tell whether efficiency gains are keeping up with AI demand.

Sustainability In The Event Industry Statistics
Want proof that event sustainability is moving from pledges to measurement? See how targets are reshaping practices, from waste and materials to energy and logistics, with the latest 2025 and 2026 figures showing where real progress is happening and where the gap still surprises.

Sustainability In The Dessert Industry Statistics
As dessert makers push harder for cleaner supply chains, the latest 2025 figures reveal how sustainability is reshaping everything from ingredient sourcing to energy use. The surprising gap between what brands report and what their operations demand makes this page worth your time.

Sustainability In The Tourism Industry Statistics
Tourism sustains 1.2 billion jobs worldwide, yet accommodation alone drives about 8.5% of global tourism emissions and hotels can cut energy use intensity up to 10.0% since 2010 to 2017 through benchmarking and retrofit gains of 10 to 30%. From 55% of EU consumers choosing energy efficient businesses to 64% of global travelers wanting sustainability info at booking and 57% willing to pay more, these 2025 to 2023 backed figures show where traveler demand, climate impact, and practical savings finally line up.

Sustainability In The Packaging Industry Statistics
Seventy percent of U.S. consumers want companies to cut packaging waste and EU policy is tightening the rules fast, so this page links what people demand to the targets that will reshape recyclability, EPR, and plastics controls across the supply chain. It also tackles the uncomfortable tradeoffs behind the life cycle numbers, from single use plastic’s 42 percent share of plastic waste to how recycling rates and allocation rules can flip claimed environmental wins.

Sustainability In The Supply Chain Industry Statistics
Scope 3 emissions tied to global supply chains still reach 2.7 billion tonnes of CO2e each year, while rules and market pressure are tightening fast, from CSRD coverage of about 50,000 EU and certain non EU companies to CBAM charges starting to roll in. Learn which operational levers are moving the needle, including how supplier scorecards can lift supplier performance by 14% on average and why 33% of executives flag cost pressures as the biggest blocker.

Sustainability In The Jewelry Industry Statistics
As 2026 data points reveal how sustainability claims are shifting from marketing language to measurable sourcing and emissions results, the jewelry industry’s gap between “responsible” and “verifiable” is getting harder to hide. This page pulls the most telling figures together so you can see exactly where progress is accelerating and where it’s stalling.

Sustainability In The Space Industry Statistics
A sharp 2026 forecast shows how quickly space sustainability is tightening from research to measurable impact, with major shifts in emissions, materials use, and reuse plans that you can’t ignore. See where current momentum helps and where it still falls short, as the industry’s “green” promises collide with the realities of launches and supply chains.
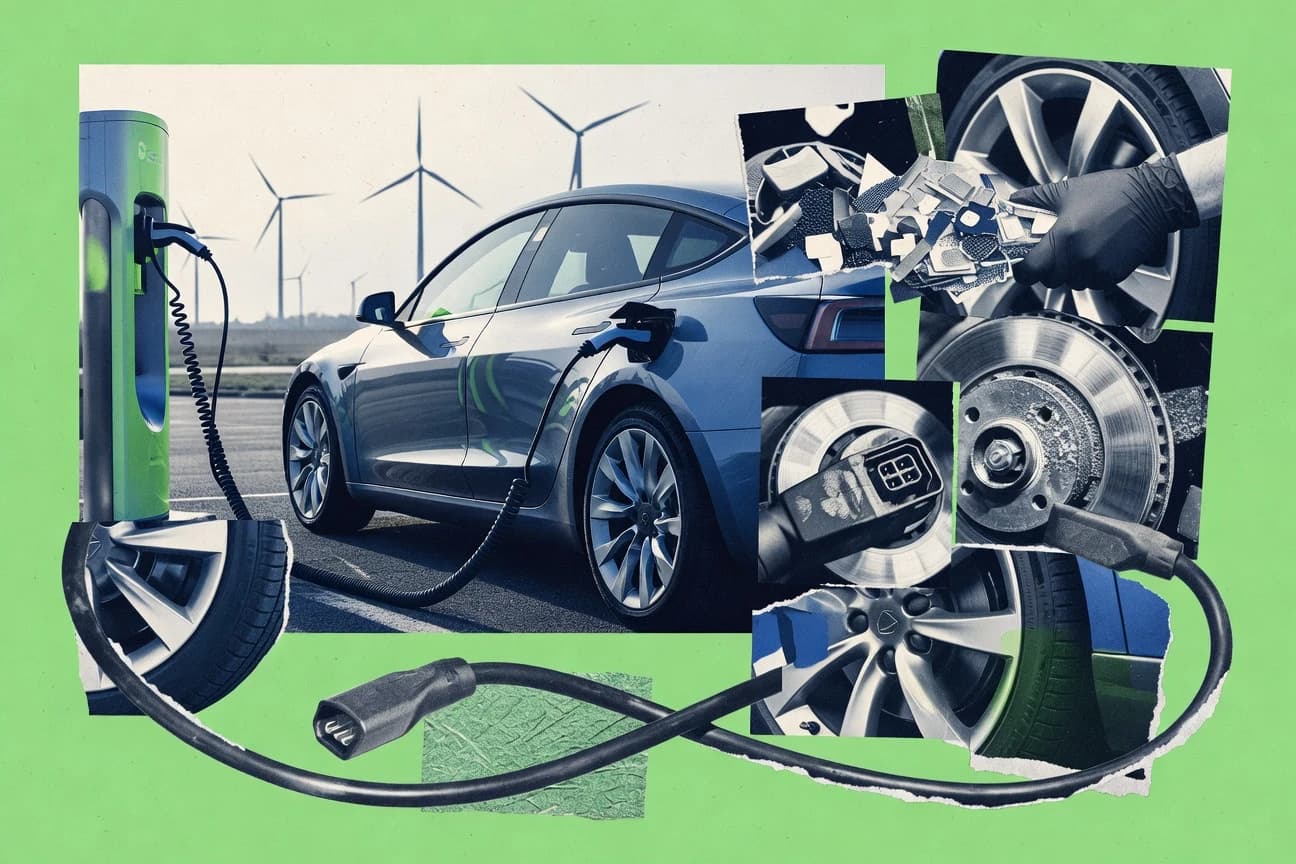
Sustainability In The Auto Industry Statistics
Electric vehicles reached 13.0 million global sales in 2023, yet the carbon and cost story is split across the whole supply chain, from battery manufacturing energy demand and transport emissions to recycling targets like 4% recycled lithium by 2030. Use these sharp, policy-linked figures to compare where progress is real and where it is still locked behind grids, hydrogen choices, and charging buildout such as 5.4 million public points worldwide.

Sustainability In The Transportation Industry Statistics
Freight and passenger transport are cutting emissions while demand keeps rising, and the latest 2026 figures reveal where progress is actually landing. You will see the sharp gap between policy promises and measurable outcomes across modes, giving you a clear picture of what is working and what is still falling short.

Esg Food Industry Statistics
Food systems drive 10 to 13% of global human caused greenhouse gases, yet the biggest consumer facing lever is wasted food at 41%, a mismatch that turns shopping and retail choices into real climate action. Get the latest ESG signals and investment pressure behind safer labor, smarter packaging circularity, and climate and nutrition risks, from 36% reporting adoption to $7.1 billion sustainable packaging and $4.0 billion food waste recycling market demand.

Sustainability In The Dance Industry Statistics
Sustainability In The Dance Industry tracks how carbon, waste, and supply chain decisions ripple through rehearsals, tours, and productions, with 2026 figures showing where the biggest gains can still be made. The contrast between policy promises and what actually lands on stages makes the page a must read for anyone trying to measure real momentum, not just intentions.

Sustainability In The Fast Fashion Industry Statistics
Fast fashion's immense water and chemical pollution masks its exploitative labor and growing waste crisis.

Sustainable Fashion Industry Statistics
The sustainable fashion market is rapidly growing as consumer demand shifts towards eco-friendly practices.