
By 2023, the Amazon’s deforestation rate in Brazil fell to 13,235 km² after earlier peaks, yet habitat loss is still the top threat flagged by the IUCN across many groups of threatened species. At the same time, more than 40% of the world’s terrestrial land has already been converted to agriculture or pasture, tightening the squeeze on forests, freshwater systems, and the species that depend on them. This post connects these trends so you can see how land clearing, fragmentation, and climate feedbacks line up in the real numbers.
Key Takeaways
- IUCN reports that the top threat to threatened species is habitat loss (including land-use change), appearing across many taxa in Red List threat data
- By 2022, over 40% of the world’s terrestrial land has been converted to agriculture or pasture (habitat conversion), consistent with IPBES global assessment summaries
- The Amazon lost 17% of its forest cover from 1970 to 2019, indicating long-term habitat loss, per WWF’s synthesis citing PRODES and research (2019)
- The rate of deforestation in the Brazilian Amazon fell to 13,235 km² in 2023 after prior peaks, showing changing habitat loss pressure, per Brazil’s PRODES data (2023)
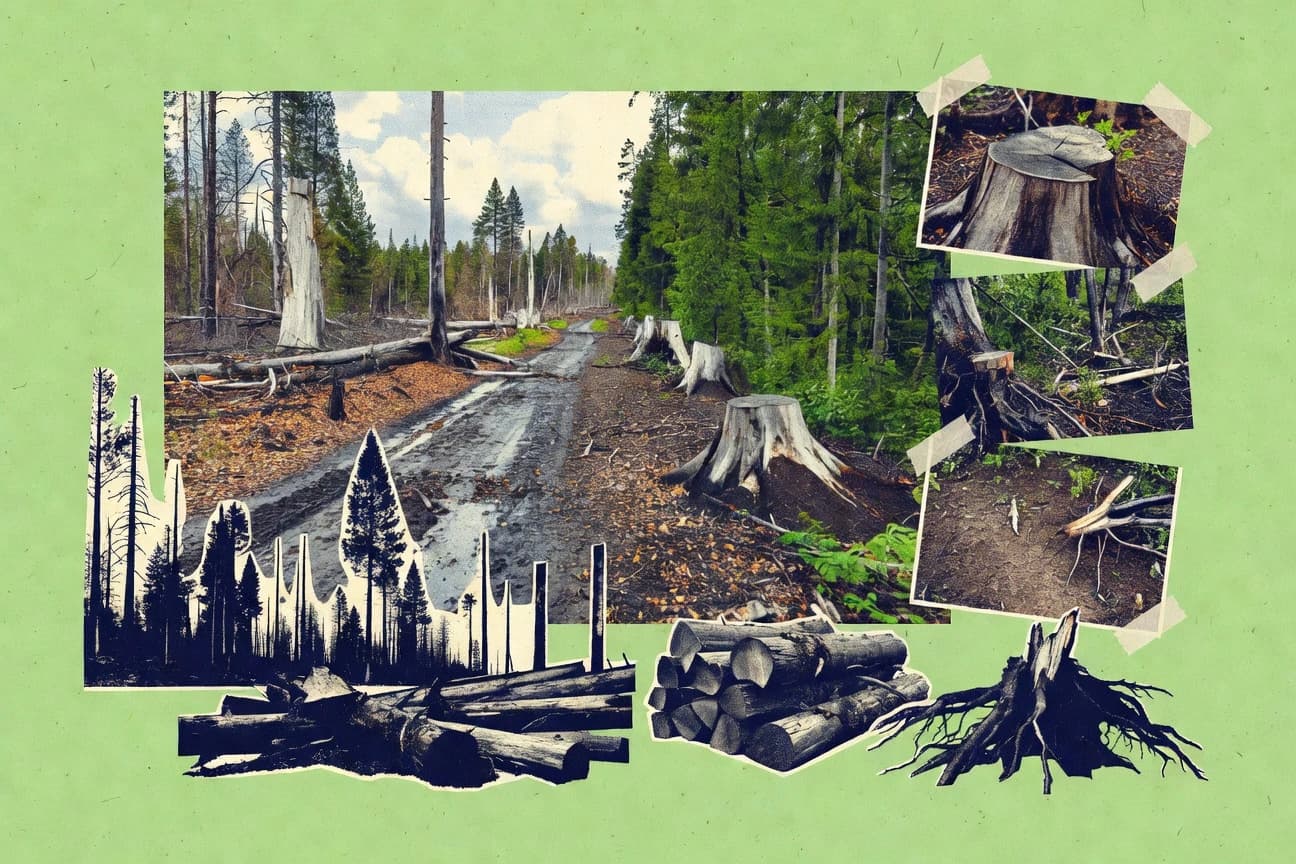
- Logging and timber extraction contribute to deforestation and habitat loss; FAO FRA 2020 provides global forest loss context including logging and other removals (2020)
- Land-use change is responsible for about 23% of global greenhouse-gas emissions, linking habitat conversion to climate-driven biodiversity impacts, per IPCC AR6 (2022)
- In a TEEB review, ecosystem service losses from deforestation are monetizable at large scales, underscoring economic impacts of habitat conversion (2010–2011 synthesis)
- In 2022, global beef exports were about $80 billion, and cattle expansion is a known driver of habitat loss (OECD-FAO Agricultural Outlook; trade stats)
- In 2024, the EU’s EUDR requires operators to implement due diligence to avoid placing commodities linked to deforestation on the EU market, targeting habitat loss in supply chains (EUDR)
- In 2020, protected areas covered 15% of terrestrial and 7% of marine areas, providing some habitat preservation though not enough to stop habitat loss overall (CBD 2020 / WDI)
- In 2023, the Convention on Biological Diversity Aichi Targets were not met, and one of the largest gaps included pressures on biodiversity including habitat loss (CBD assessment)
- 29% of global land is covered by forests, down from 31% in 1990 (a long-run decline in forest area that reflects ongoing habitat loss).
- The world lost 4.1 million hectares of forest in 2021 (annual deforestation magnitude relevant to habitat loss).
- About 70% of the world’s population lives in areas experiencing high or very high water stress (affecting freshwater habitat availability and degradation).
- Deforestation is responsible for roughly 10% of global greenhouse gas emissions (forest habitat loss feedback with climate).
Habitat loss driven by land use change is the leading threat to biodiversity, with impacts still rising worldwide.
Related reading
01 · Category
Biodiversity Status1 stats
01
IUCN reports that the top threat to threatened species is habitat loss (including land-use change), appearing across many taxa in Red List threat data
Interpretation
Biodiversity Status Interpretation
IUCN reports that habitat loss and land use change are the leading threat to threatened species across many taxa in Red List data, underscoring that biodiversity status is being driven by widespread habitat degradation rather than isolated pressures.
02 · Category
Habitat Conversion4 stats
01
By 2022, over 40% of the world’s terrestrial land has been converted to agriculture or pasture (habitat conversion), consistent with IPBES global assessment summaries
02
The Amazon lost 17% of its forest cover from 1970 to 2019, indicating long-term habitat loss, per WWF’s synthesis citing PRODES and research (2019)
03
The rate of deforestation in the Brazilian Amazon fell to 13,235 km² in 2023 after prior peaks, showing changing habitat loss pressure, per Brazil’s PRODES data (2023)
04
In 2020, the estimated global extent of intact forest landscapes declined; GFW’s intact forest landscapes indicator shows ongoing habitat loss pressures (data portal)
Interpretation
Habitat Conversion Interpretation
By 2022, more than 40% of the world’s terrestrial land had been converted to agriculture or pasture, showing that habitat conversion is the dominant and continuing driver behind long term habitat loss pressures seen in places like the Amazon and the Brazilian Amazon’s fluctuating deforestation rates.
03 · Category
Industry Drivers1 stats
01
Logging and timber extraction contribute to deforestation and habitat loss; FAO FRA 2020 provides global forest loss context including logging and other removals (2020)
Interpretation
Industry Drivers Interpretation
Logging and timber extraction are key industry drivers of habitat loss, and FAO FRA 2020 highlights that global forest loss includes logging and other removals as major contributors.
04 · Category
Climate & Economics3 stats
01
Land-use change is responsible for about 23% of global greenhouse-gas emissions, linking habitat conversion to climate-driven biodiversity impacts, per IPCC AR6 (2022)
02
In a TEEB review, ecosystem service losses from deforestation are monetizable at large scales, underscoring economic impacts of habitat conversion (2010–2011 synthesis)
03
In 2022, global beef exports were about $80 billion, and cattle expansion is a known driver of habitat loss (OECD-FAO Agricultural Outlook; trade stats)
Interpretation
Climate & Economics Interpretation
With land-use change accounting for about 23% of global greenhouse-gas emissions and deforestation ecosystem losses proving monetizable at large scales, the climate and economic stakes of habitat loss are tightly linked, while beef exports around $80 billion in 2022 show how cattle-driven expansion can translate trade value into real environmental costs.
05 · Category
Market Size6 stats
01
In 2024, the EU’s EUDR requires operators to implement due diligence to avoid placing commodities linked to deforestation on the EU market, targeting habitat loss in supply chains (EUDR)
02
In 2020, protected areas covered 15% of terrestrial and 7% of marine areas, providing some habitat preservation though not enough to stop habitat loss overall (CBD 2020 / WDI)
03
In 2023, the Convention on Biological Diversity Aichi Targets were not met, and one of the largest gaps included pressures on biodiversity including habitat loss (CBD assessment)
04
The Kunming-Montreal Global Biodiversity Framework sets a target to protect 30% of land and waters by 2030 (habitat safeguarding against loss), per CBD (2022)
05
The Global Environment Facility (GEF) has funded projects for forest and biodiversity conservation; from 1991–2022, GEF approved thousands of projects contributing to habitat conservation (GEF portfolio)
06
In 2023, the UK’s Environment Act included commitments to support biodiversity and halt decline, indirectly addressing habitat loss pressures (legislation)
Interpretation
Market Size Interpretation
For the Market Size angle, the push to curb habitat loss is scaling fast, with the EU’s 2024 EUDR due diligence rules coming as only 15% of terrestrial and 7% of marine areas were protected in 2020, and with global targets now aiming to protect 30% of land and waters by 2030.
06 · Category
Global Forest Trends2 stats
01
29% of global land is covered by forests, down from 31% in 1990 (a long-run decline in forest area that reflects ongoing habitat loss).
02
The world lost 4.1 million hectares of forest in 2021 (annual deforestation magnitude relevant to habitat loss).
Interpretation
Global Forest Trends Interpretation
Under the Global Forest Trends lens, forest coverage has fallen to 29% of global land from 31% in 1990 and the world still lost 4.1 million hectares of forest in 2021, showing that habitat loss is both a long term decline and a continuing annual threat.
More related reading
07 · Category
Land Use Change1 stats
01
About 70% of the world’s population lives in areas experiencing high or very high water stress (affecting freshwater habitat availability and degradation).
Interpretation
Land Use Change Interpretation
For the Land Use Change angle, the fact that about 70% of the world’s population lives in areas with high or very high water stress shows how widespread land and water use pressures are threatening freshwater habitats through reduced availability and degradation.
08 · Category
Climate And Habitat2 stats
01
Deforestation is responsible for roughly 10% of global greenhouse gas emissions (forest habitat loss feedback with climate).
02
Climate-driven habitat shifts are expected to move species distributions poleward and upward, increasing mismatch with local habitats (habitat loss via range contraction/shift).
Interpretation
Climate And Habitat Interpretation
Under the Climate And Habitat lens, deforestation drives about 10% of global greenhouse gas emissions while climate-driven habitat shifts push species poleward and upward, raising the odds of mismatches with the habitats they can no longer readily use.
09 · Category
Biodiversity Impacts3 stats
01
Inland habitat loss and fragmentation reduce biodiversity: fragmentation can cause species declines by limiting dispersal (quantified in meta-analyses of fragmentation impacts).
02
Around 1.5 million species are threatened with extinction, many due to habitat loss and degradation (global extinction risk scale).
03
Tropical forest fragmentation increases local extinction risk; one large-scale study quantified higher extinction rates in fragmented landscapes versus continuous forest.
Interpretation
Biodiversity Impacts Interpretation
Across the biodiversity impacts of habitat loss, fragmentation and degradation are linked to sharp declines in biodiversity, with about 1.5 million species threatened with extinction and tropical forest fragmentation showing higher local extinction rates than continuous forest.
10 · Category
Policy, Enforcement, Finance1 stats
01
In 2022, about $9.5 billion in international public finance was directed to biodiversity-related objectives (public finance scale that funds habitat conservation).
Interpretation
Policy, Enforcement, Finance Interpretation
In 2022, $9.5 billion of international public finance was aimed at biodiversity-related objectives, signaling that policy and funding channels for habitat conservation are receiving at least this level of global financial commitment.
11 · Category
Infrastructure And Exploitation1 stats
01
Wildfire-driven forest conversion to non-forest occurred at scale in many regions; one global dataset-based analysis quantified area burned converting ecosystems (conversion magnitude).
Interpretation
Infrastructure And Exploitation Interpretation
Infrastructure and exploitation pressures can be seen in how wildfire-driven forest conversion to non-forest has occurred at scale across many regions, with global dataset analyses quantifying how much area burned is turning ecosystems into non-forest.
Reference
Cite This Report
This report is designed to be cited. We maintain stable URLs and versioned verification dates. Copy the format appropriate for your publication below.
APA
Min-ji Park. (2026, February 13). Habitat Loss Statistics. Gitnux. https://gitnux.org/habitat-loss-statistics
MLA
Min-ji Park. "Habitat Loss Statistics." Gitnux, 13 Feb 2026, https://gitnux.org/habitat-loss-statistics.
Chicago
Min-ji Park. 2026. "Habitat Loss Statistics." Gitnux. https://gitnux.org/habitat-loss-statistics.
Sources & references
25 datasets cited across this report · attribution is report-level
+7 additional datasets cited (not shown individually)