GITNUX MARKETDATA
Browse Our Category
Environmental Ecological
Latest update:


Restaurant Food Waste Statistics
Food waste from US foodservice hit 4.4 billion pounds in 2015, yet prevention actions like standardized portioning and forecast-based procurement can cut kitchen waste by 28% or more, reshaping the cost and emissions math behind what restaurants throw away. You will see how diversion adoption is still limited, while methane and climate impacts, landfill methane’s 45% share of US methane emissions, and fast growing platforms and digestion capacity in the market all explain why “small plate waste” is a bigger operational and environmental issue than most teams expect.
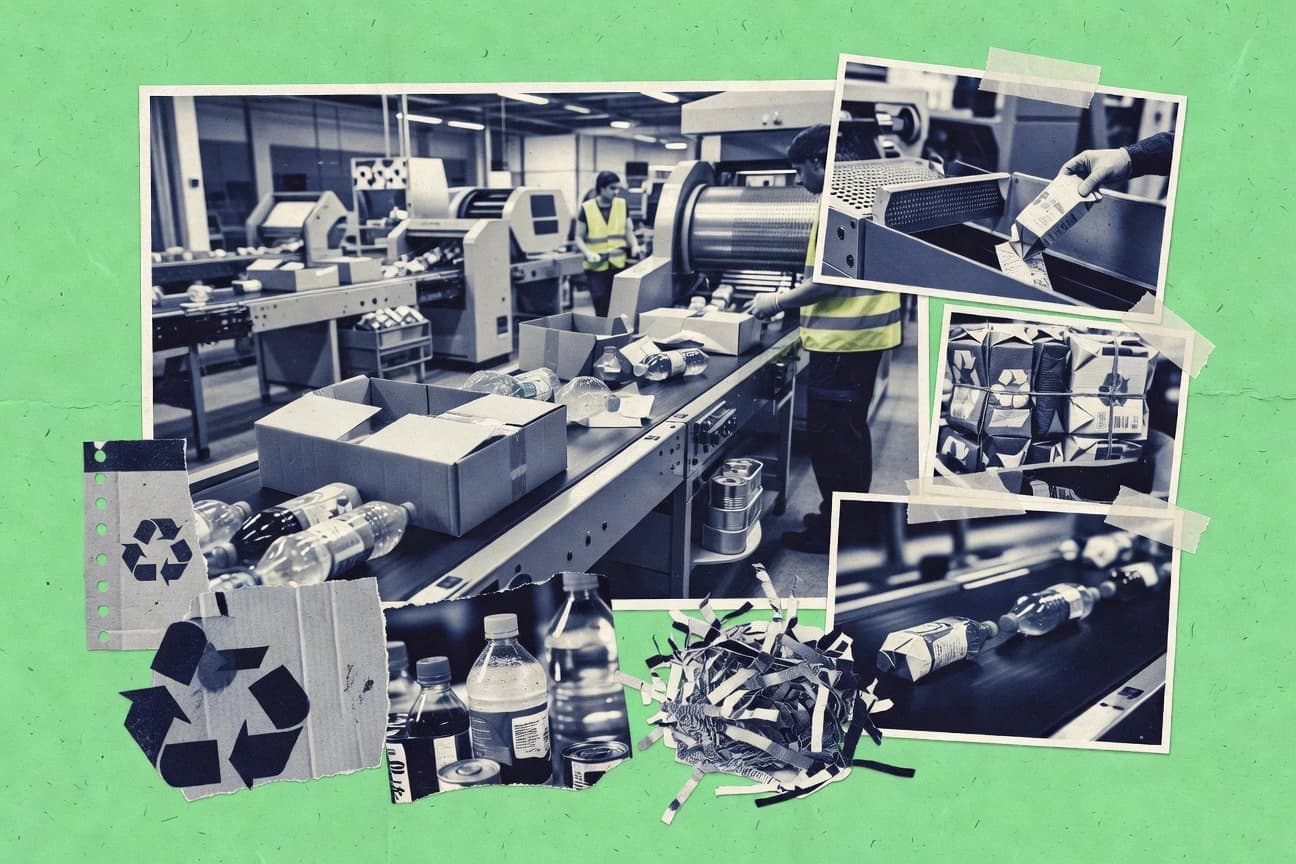
Poland Recycling Industry Statistics
With 65% of packaging waste targeted for recycling by 2025 and a municipal separate collection coverage that already topped 90% of the population by 2022, Poland is clearly building the infrastructure for a circular shift, yet the municipal recycling rate still needs to close the gap to the next benchmark. See how 45.6% municipal waste recycling in 2022, 15% incineration with energy recovery, and sector scale figures like 100,000+ jobs are shaping Poland’s waste and recycling investment pipeline worth billions.

Food Waste Statistics
Food waste doesn’t just happen at the end of the line. The latest statistics lay out how much gets lost or thrown away across the supply chain and where the biggest gaps keep showing up, so you can see which problem is shrinking and which is stubbornly growing.

Bycatch Statistics
Global marine fisheries catch an estimated 2.7 billion animals as bycatch every year, about 7.3 million tonnes, yet observer gaps and low trip coverage mean many of these events still go undetected. See how bycatch pressures seabirds, sea turtles, marine mammals, and even declining pelagic sharks alongside the real-world tools and costs being used to reduce discards and improve reporting.
World Pollution Statistics
In 2021, air pollution alone was linked to 6.7 million deaths, while unsafe water, sanitation, and hygiene still drove 485,000 diarrheal deaths in the same year and 1.4 billion people relied on unsafe drinking services in the most recent WHO UNICEF snapshot. World Pollution brings these pressures together, from fecal contamination in samples to mismanaged waste and largely untreated industrial wastewater, to show how one day of exposure can add up to a lifetime of preventable harm.

Animal Extinction Statistics
Animal Extinction tracks how fast the living world is shrinking, with 2025 figures that make one thing painfully clear: many species are not just declining, they are vanishing. You will see the sharp gaps between protection and loss, turning headline extinction counts into a timeline you can actually feel.
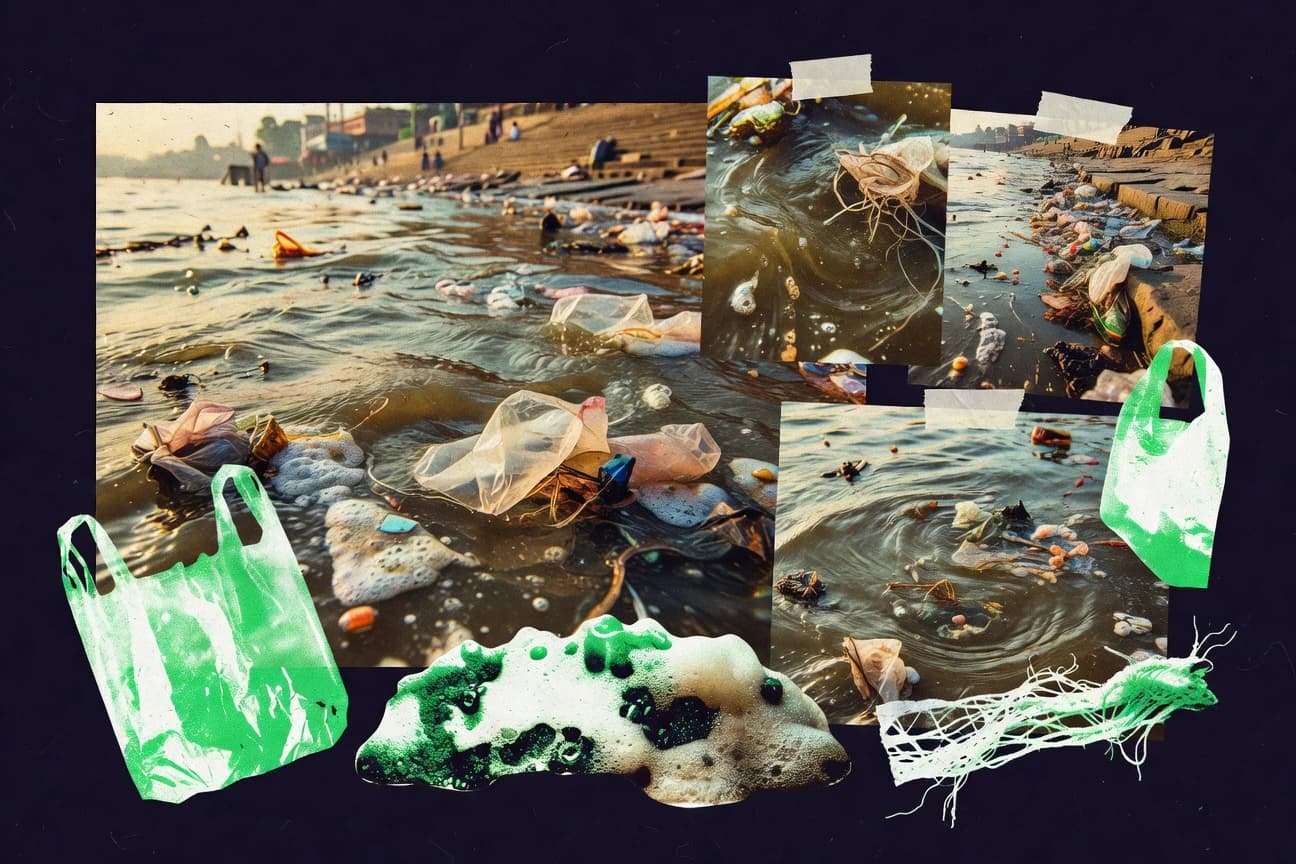
Ganges River Pollution Statistics
More than 2,000 million people in India rely at least partly on contaminated surface water linked to the Ganges, where studies have found microplastics, persistent fecal contamination at bathing ghats, low downstream dissolved oxygen, and sewage and industrial signatures in nutrients and chemicals. Use these basin wide figures to see how monsoon dilution can temporarily soften pollution yet still leave everyday river use with measurable health risk, not just pollution headlines.

Biodiversity Statistics
Nearly 8 million species may exist on Earth, yet IUCN lists 41,415 species as threatened with extinction and monitored wild mammal abundance is down 52 percent since 1990 to 2016. Track how deforestation, climate pressures, and financial gaps translate into measurable declines across forests, reefs, and freshwater life, alongside the policies and protected sites built to slow the loss.
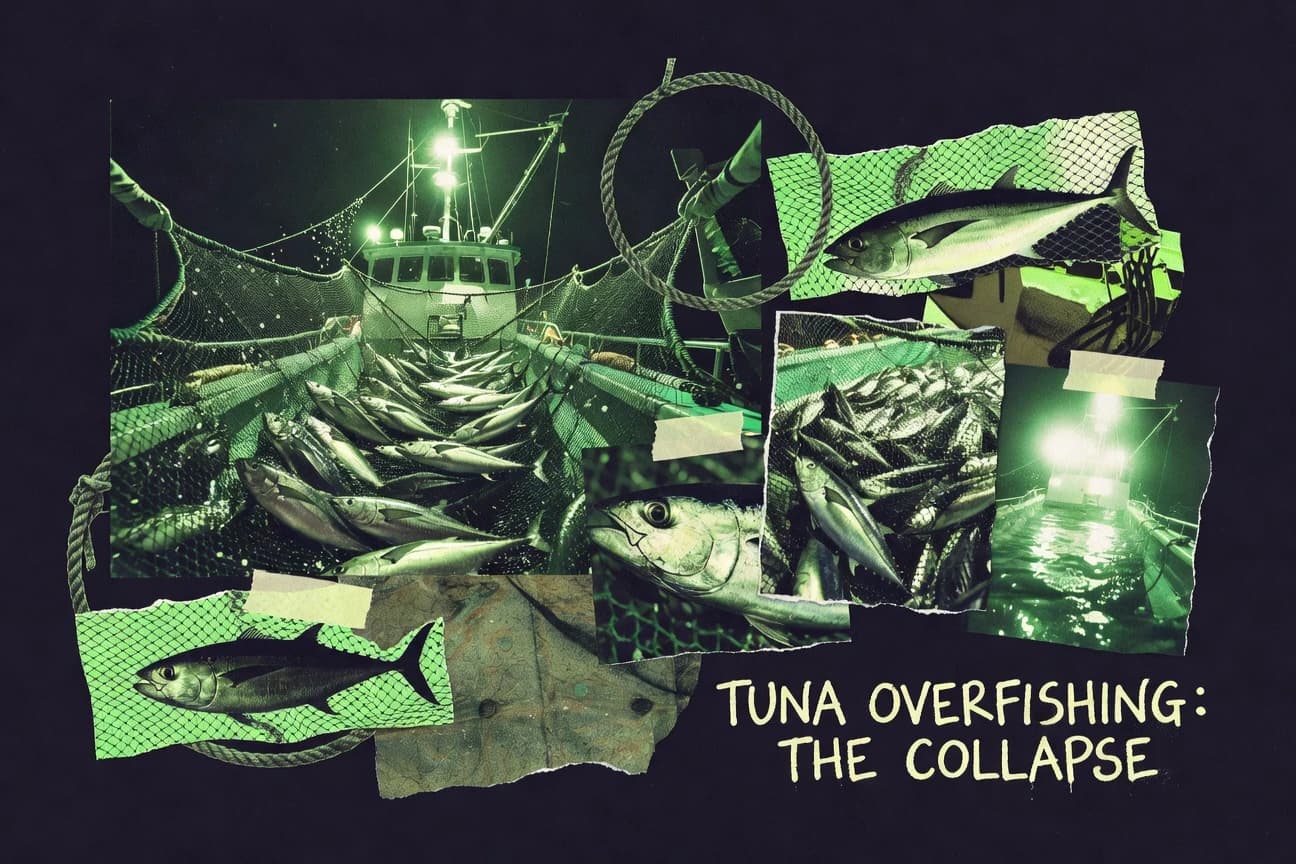
Tuna Overfishing Statistics
Global tuna catch and policy promises collide here with 2022 data plus the latest compliance signals, including 4.9 million tonnes of tuna skipjack and bonito landed worldwide alongside persistent bycatch risks from drifting and school sets. You will see how traceability and FAD management rules aim to cut overcapacity and IUU losses that cost the economy an estimated US$10 to 20 billion a year, while real-world observer and electronic monitoring requirements show where the system works and where it still leaks.
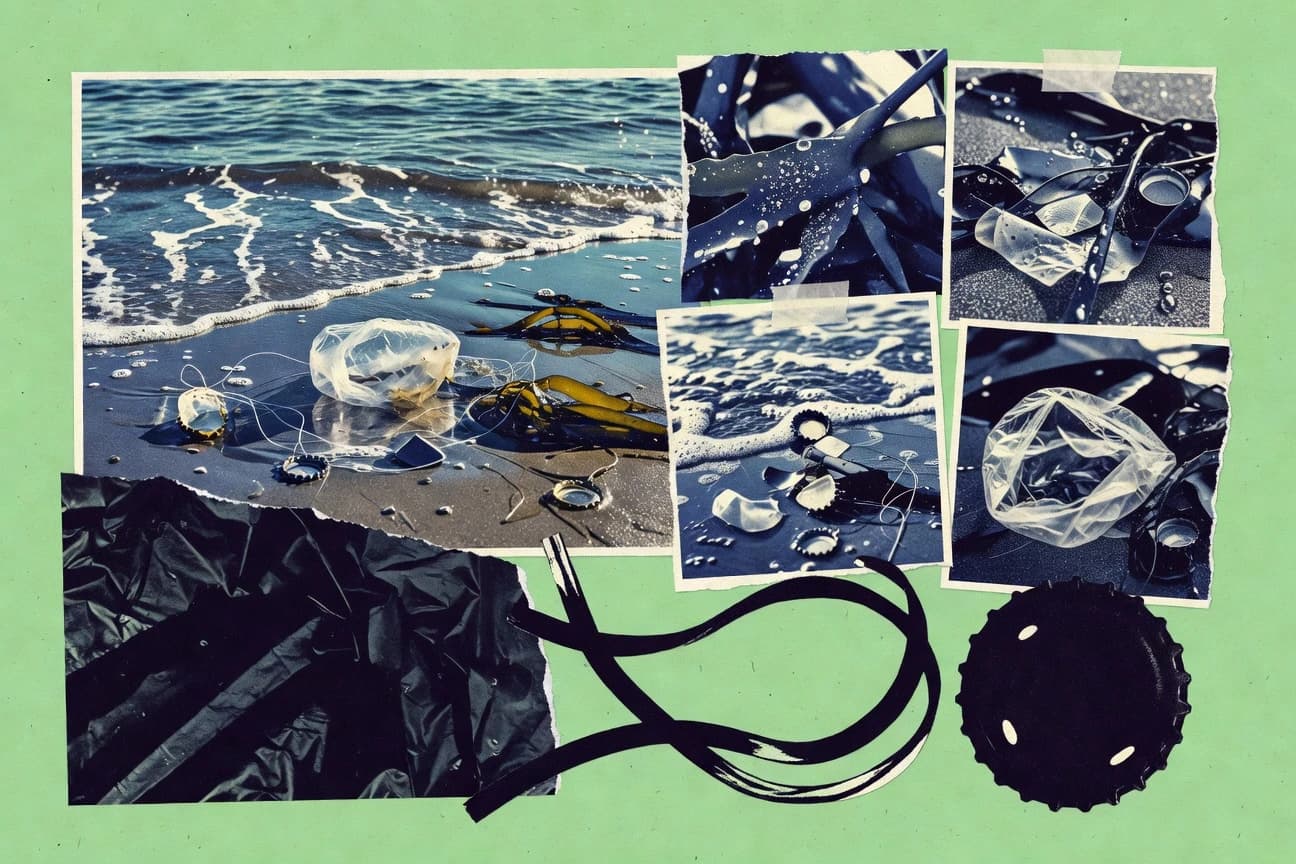
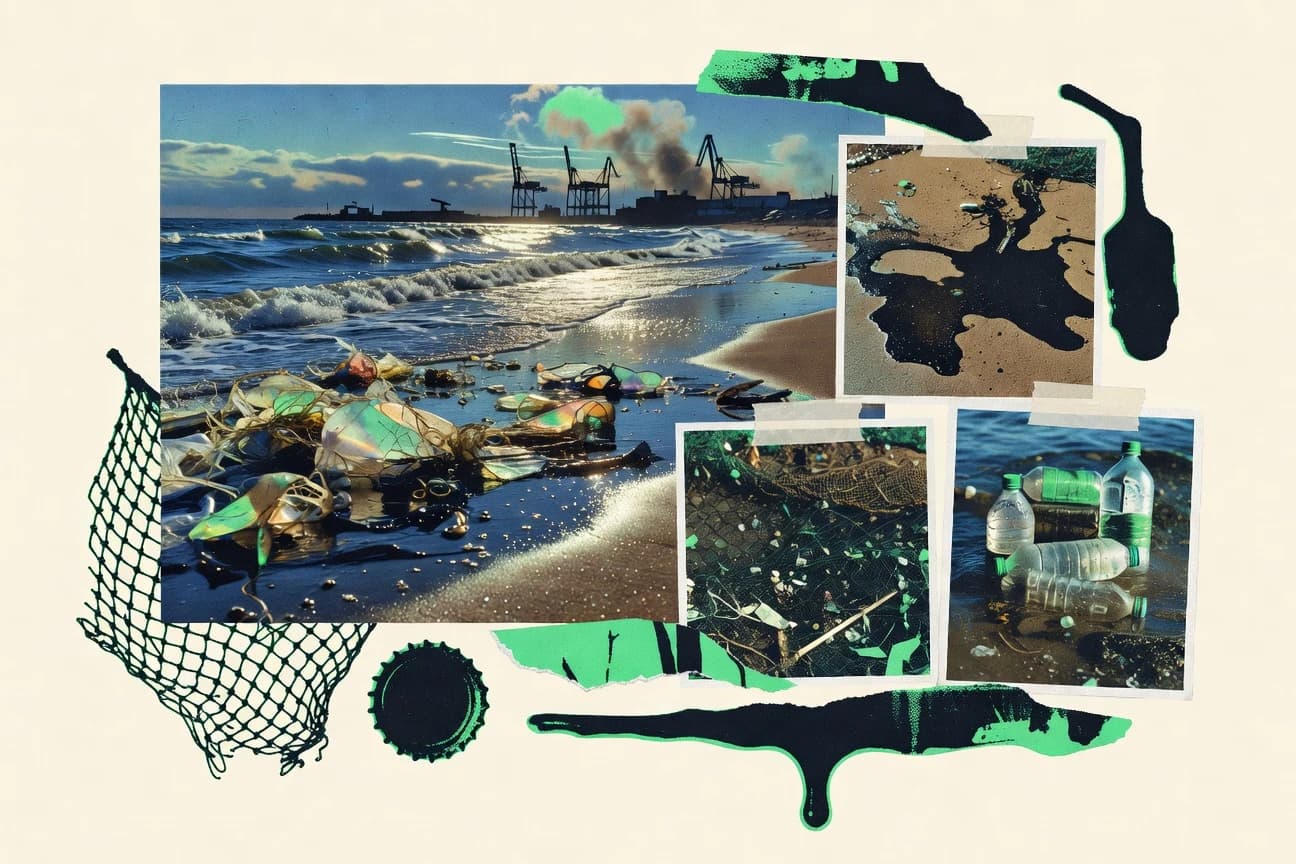
Ocean Pollution Statistics
Every year, 8 to 12 million metric tons of plastics enter the ocean from coasts and rivers while coastal harm spreads far beyond what trash alone suggests, from 400 plus hypoxic zones and rising eutrophication impacts to microplastics found across 114 species. Learn how modern leakage estimates, exposure risks, and cleanup and policy responses translate into costs running up to about $8 billion per year and into actions that are scaling, like EU targets of a 90% reduction for certain single use items by 2026 and NOAA supported removals exceeding 12 million pounds in the US since launch.
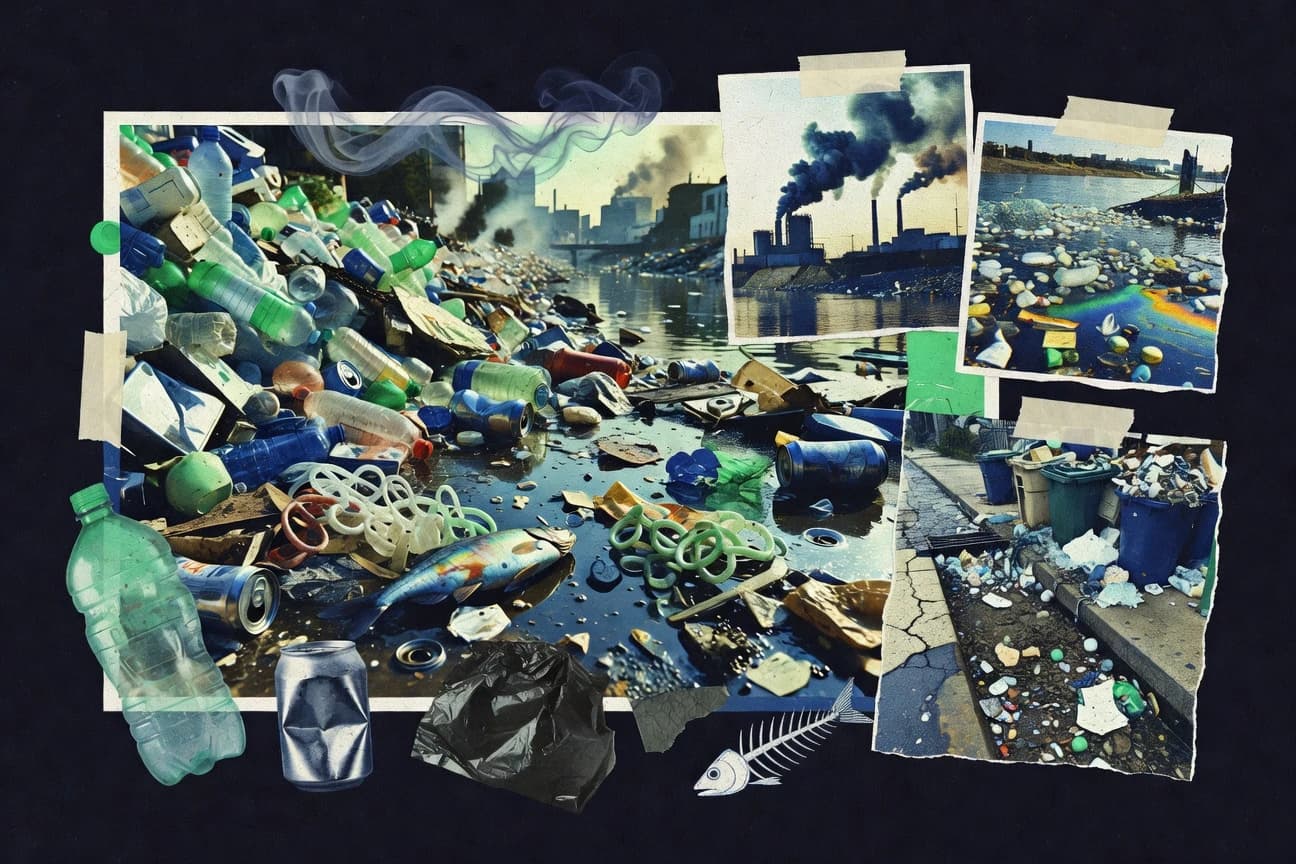
Pollution Statistics
Air pollution is still tied to 11.6% of deaths worldwide and millions of life years lost, but the climate punch is even sharper as methane alone is linked to about 0.5°C of warming since pre industrial times. Use the page to connect policy thresholds from the EU PM2.5 limit of 25 µg/m³ to Paris Agreement targets and see where monitoring, compliance, and pollution control spending are moving next.
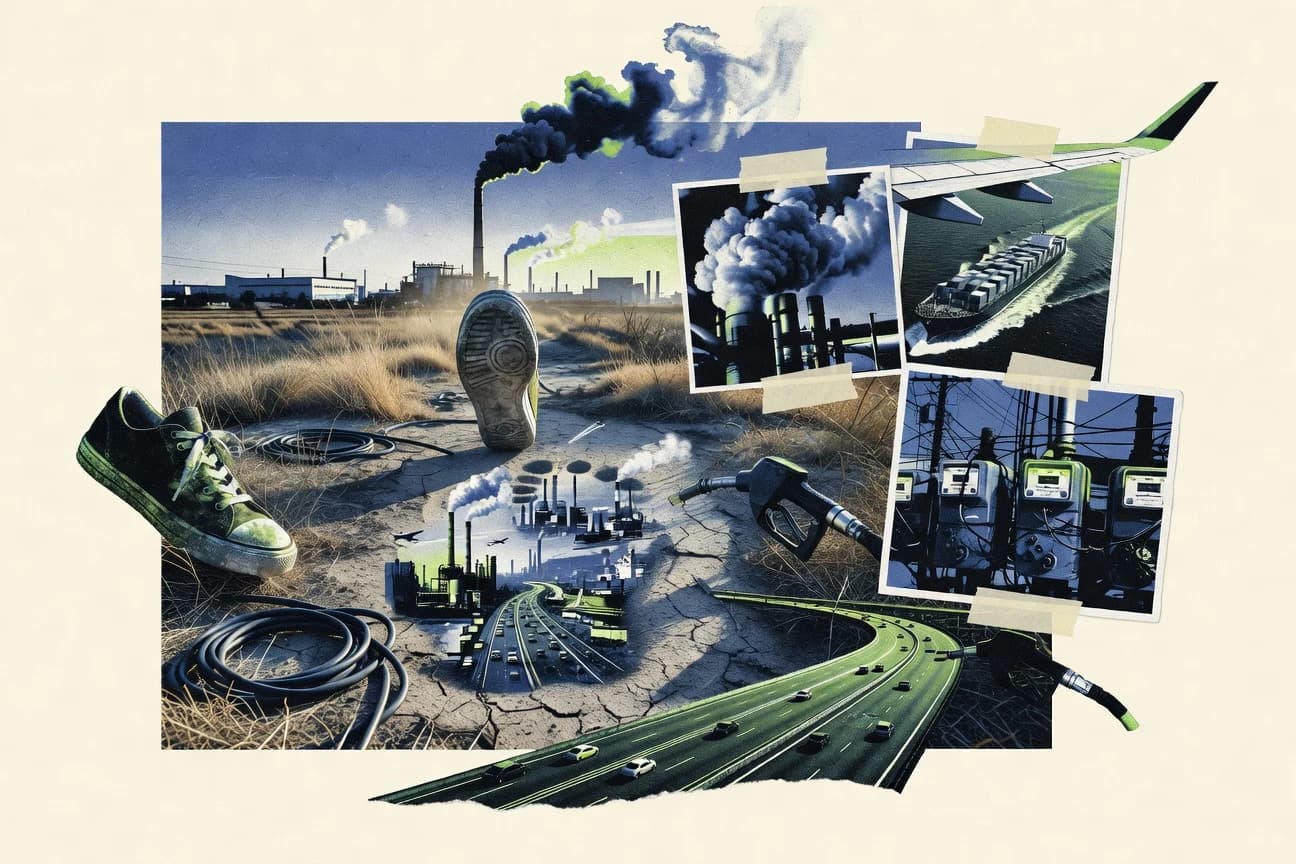
Carbon Footprint Statistics
Clean-energy investment hit US$3.2 trillion in 2023 while methane leak reductions alone offer 1.4 billion tonnes of CO2e potential, and the page ties those real levers to the carbon accounting rules that decide what companies must measure, verify, and report. You will also see how standards and policies like ISO 14064-1, ISO 14067, and the EU CBAM reshape product and organizational footprinting from land use to supply chains.

Amazon Rainforest Statistics
The Amazon Basin holds 5.5 million square kilometers of rainforest habitat and an estimated 10% of Earth’s known species, yet it is also tied to a fast-moving deforestation and carbon story, with 8,467 square kilometers cleared in Brazil in 2022 and 4.1 million hectares cleared between 2014 and 2018. Read how towering canopy structure, 20% of the world’s oxygen contribution, and carbon storage of about 86 to 140 billion metric tons collide with drought, fire, and land-use pressures across nine countries.
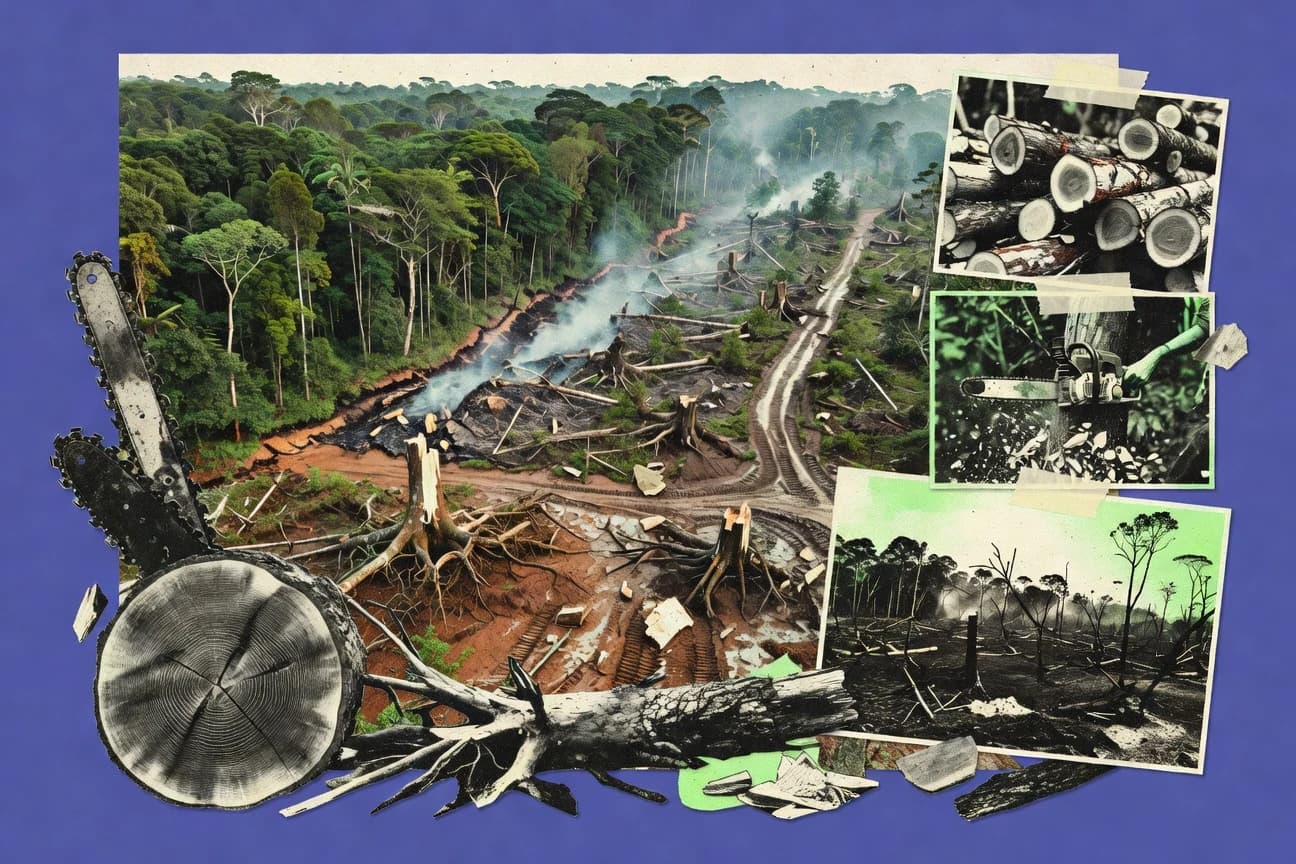
Amazon Rainforest Deforestation Statistics
Between 2001 and 2023, about 7.7% of Brazilian Legal Amazon tree cover was lost, with agriculture expansion and cattle ranching pushing clearing deeper through roads, frontiers, and mining hotspots. See how those forest changes ripple beyond biodiversity and carbon to reshape rainfall, increase warming locally, and raise risks from malaria to river sediment, alongside the enforcement record behind INPE and PRODES monitoring.

Holiday Waste Statistics
Americans toss about 25% more trash during the Christmas season, even as many gift choices nudge them toward waste or away from it, from 68% worrying about packaging to only 52% having a recycling plan. You will see what actually holds up for holiday waste, including 62% of households recycling paper when available, plus the hidden climate pressure of food waste that drives landfill methane.

Environmental Health Statistics
Air quality remains a silent global hazard, with 99% of the world’s population living where air does not meet WHO guideline limits and air pollution, water and sanitation risks contributing to 9% of deaths worldwide. Pair that with 1.7 billion people facing schistosomiasis and soil transmitted helminths tied to water and sanitation shortfalls, plus lead exposure affecting 28% of the global population in early life, and you get a clear reason to track Environmental Health statistics because the biggest risks are often preventable.

Noise Pollution Statistics
Noise is not just an inconvenience it drives major health burdens across Europe and beyond, from 48,000 new ischaemic heart disease cases each year in Western Europe to 4,000 hospital admissions linked to aircraft noise. If you want one stark comparison, nighttime noise above 40 dB disrupts sleep for 22% of Europeans while traffic noise raises cortisol levels by 20%, making quiet a public health issue rather than a preference.

Colorado River Statistics
After Glen Canyon Dam turned pre dam variability into a near constant 47°F below the dam, the Lees Ferry fish mix now runs 85% non native rainbow trout and critical native runs are crashing, including razorback sucker spawning success below 1% and Colorado River cutthroat trout in under 10% of its historic range. Meanwhile the basin is steadily drawn down and concentrated, with Lake Mead holding about 10 MAF in 2023 and delta bird species down 90% since the 1930s, so these 2025 and 2023 water and wildlife numbers force a direct question about what the river can still support.
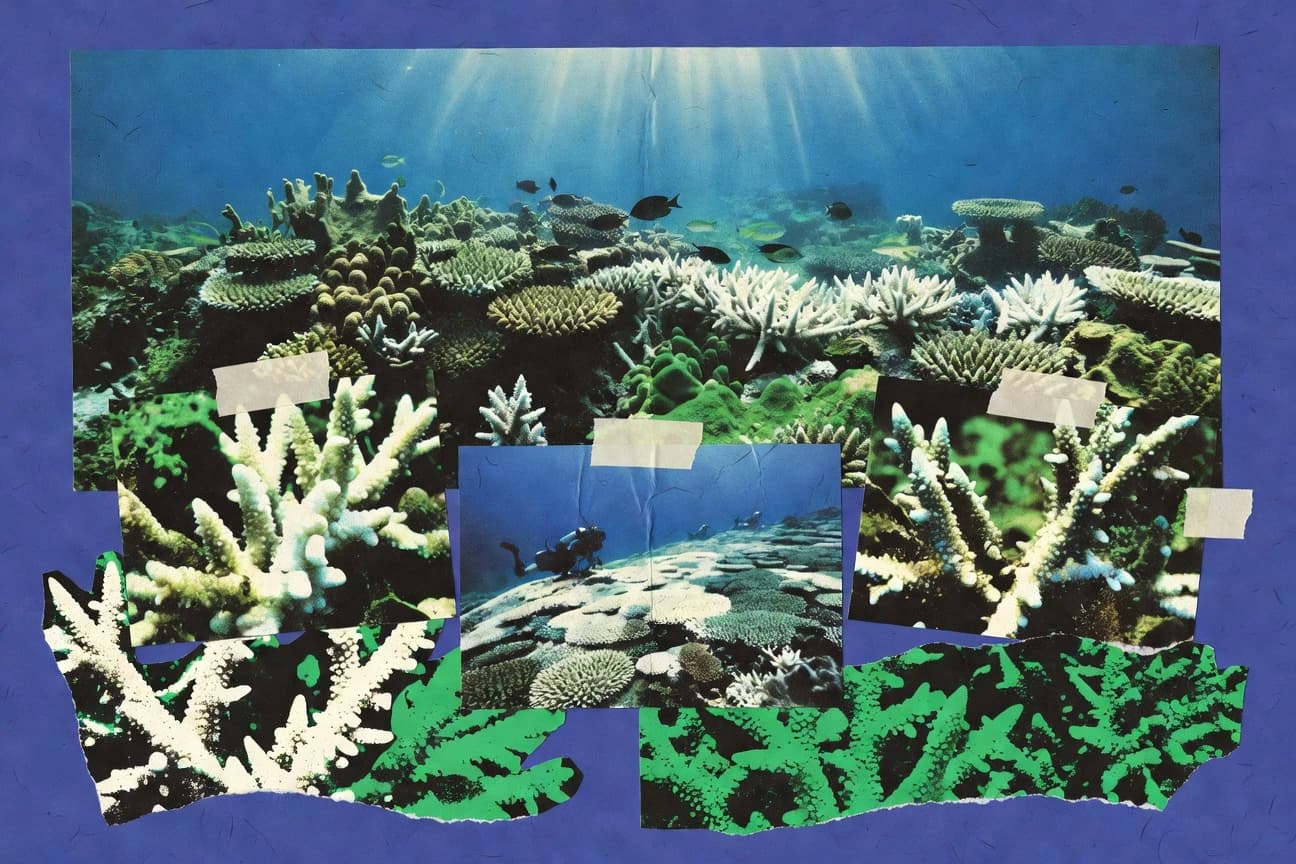
Coral Reef Bleaching Statistics
The 2023 to 2024 global bleaching event hit over 84% of the world’s reefs by March 2024, pushing NOAA heat stress levels to 84% of surveyed reefs and deepening a global loss already cut to 14% live coral cover by 2019 from 30% in 1980. With 35% of reefs losing more than half their cover since 2016 and post bleaching mortality running 80% higher when recovery stalls after 4 weeks, this page connects regional reef collapse rates to the deadlines that decide whether coral can come back.

AI Environmental Impact Statistics
From single-model trainings that can emit 626,000 pounds of CO2 to data center impacts that climb toward 1,000 TWh of electricity demand by 2026, this page turns AI carbon and water use into hard, comparable figures. It also flags the uncomfortable link between acceleration and overhead with 2025 level projections and facility level reality, including waste and grid strain, so you can judge whether efficiency gains are keeping pace.