GITNUX MARKETDATA
Browse Our Category
Environmental Ecological
Latest update:


Environmental Statistics
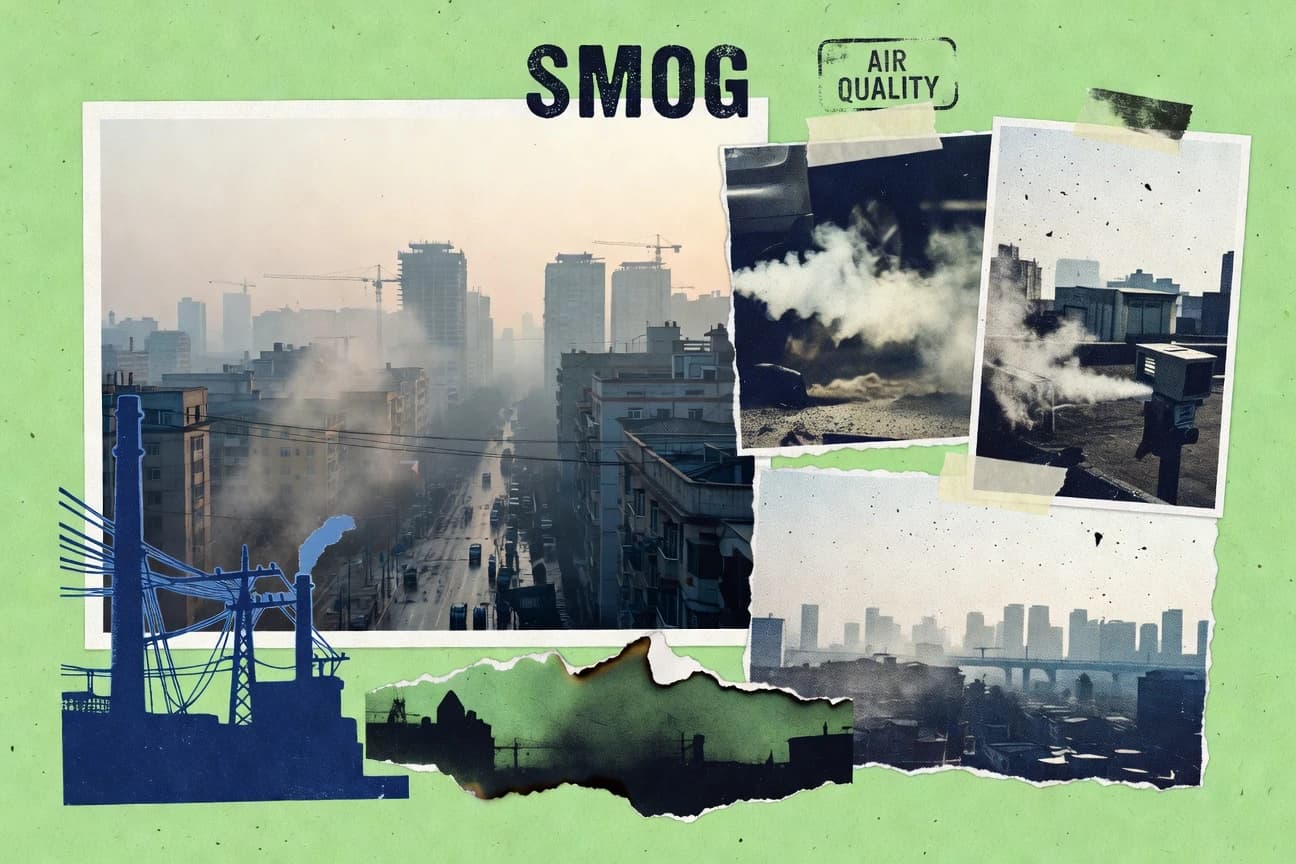
Air pollution is already baked into daily life, with PM2.5 breaching WHO guidance for 92% of the global population and 7 million premature deaths linked to air each year. This page connects those risks to the sources behind them, from vehicle exhaust and crop burning to shipping SO2 and wildfire smoke, and pairs them with the bigger climate and biodiversity pressures shaping what we breathe and what survives.

Littering Statistics
Smokers are responsible for 75% of butt litter, yet targeted anti litter campaigns can cut it by 25% where they are deployed and fines averaging about $500 deter 40% of offenders. See how pressure, bins, and deposit schemes drive huge shifts like an 80% drop in bottle litter in Europe, alongside the high cost of marine and public harm reaching $2.5 trillion globally by 2050.

Zero Waste Statistics
Zero waste is not just an ethics call, it can cut disposal costs by up to 20% and create 10 jobs per 1,000 tons diverted. See how recycling and reuse can squeeze out savings like $0.80 less energy cost per aluminum can and what 2025 and beyond targets are pushing cities to achieve.
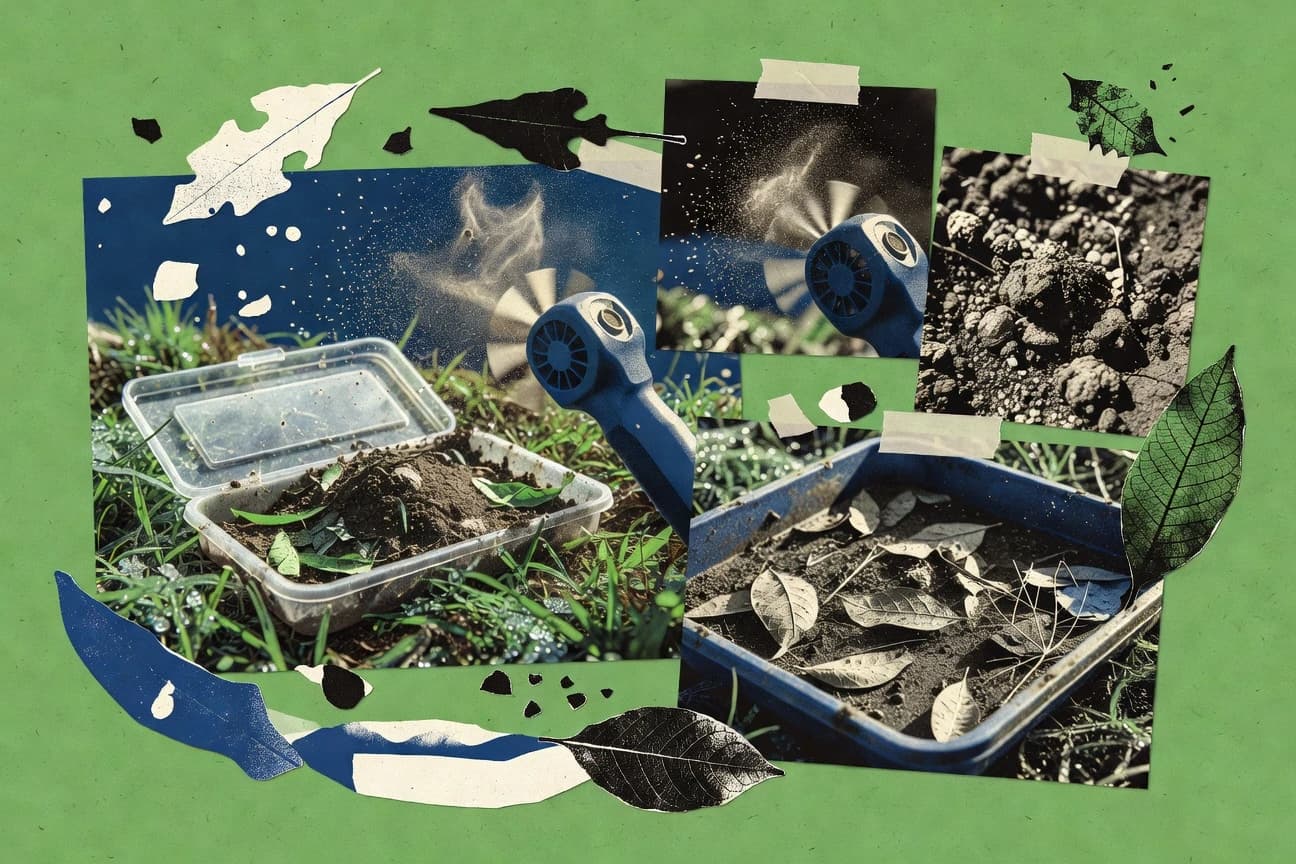
Depletion Of Natural Resources Statistics
Natural systems are being stripped at a rate that leaves little room to recover, from 10 million hectares of forest lost each year between 2015 and 2020 to insect declines of roughly 1% to 2% per year and wildlife populations down 69% since 1970. Browse Depletion Of Natural Resources for the tipping point where climate, water, and food collide, including land use and deforestation driving 25% of greenhouse gas emissions and only 3% of the planet remaining ecologically intact.

Circular Statistics
Smartphones keep climbing and global ownership hit 6.8 billion in 2023 while only 20% of people globally know how to recycle e-waste properly, so the practical gap is huge. Follow how circular fixes like AI sorting at 99% accuracy, digital product passports, and circular procurement are reshaping consumption, jobs, and emissions.
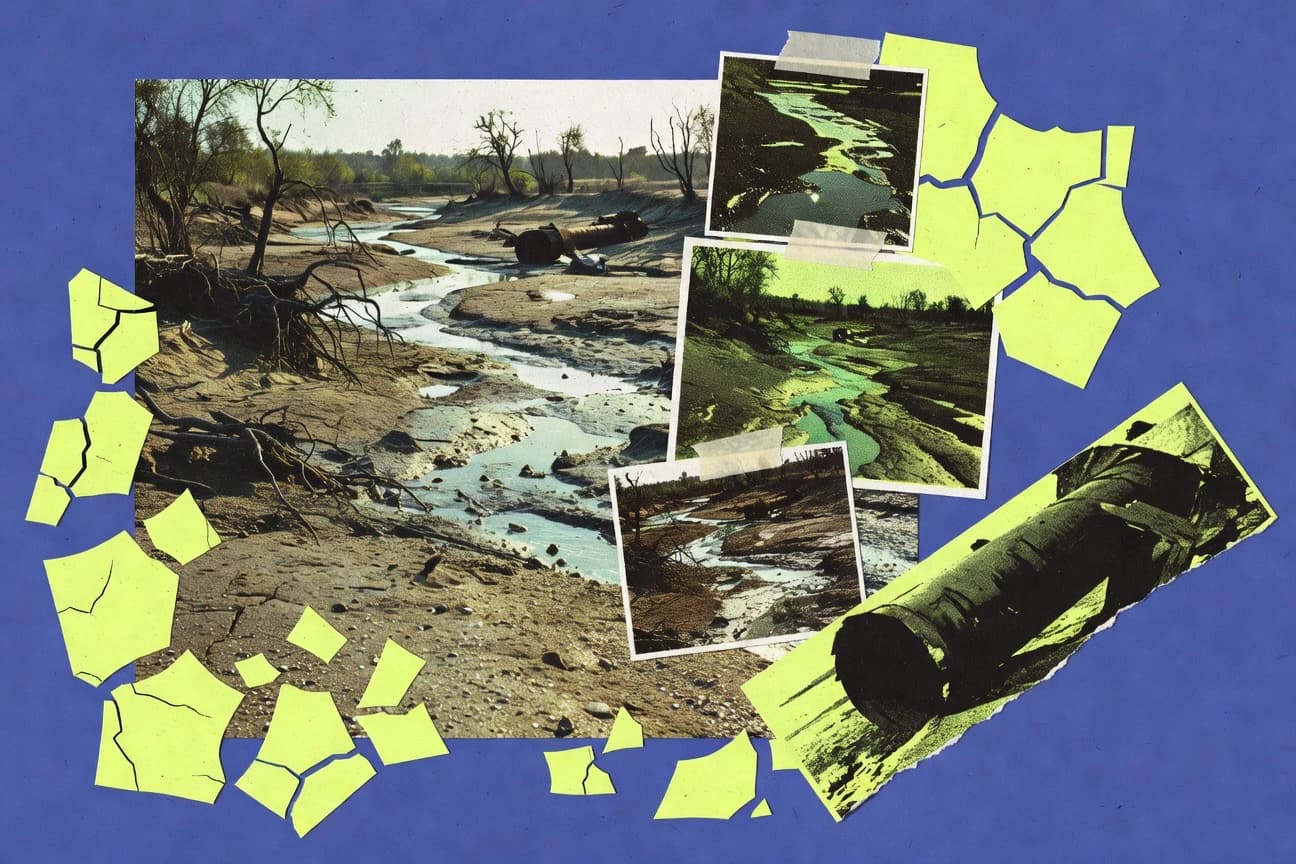
Global Water Pollution Statistics
From coral reefs losing 14% of their global cover to pollution runoff to sewage pushing pathogens and cutting shellfish populations by 60% in polluted estuaries, Global Water Pollution lays out how contaminants drive ecosystem collapse and public health costs, with water pollution hitting $260 billion a year in health expenses alone. You will also see why plastics, PFAS, heavy metals, and nutrient runoff behave like slow disasters, turning fisheries, wetlands, and drinking water into the next crisis before most people notice.

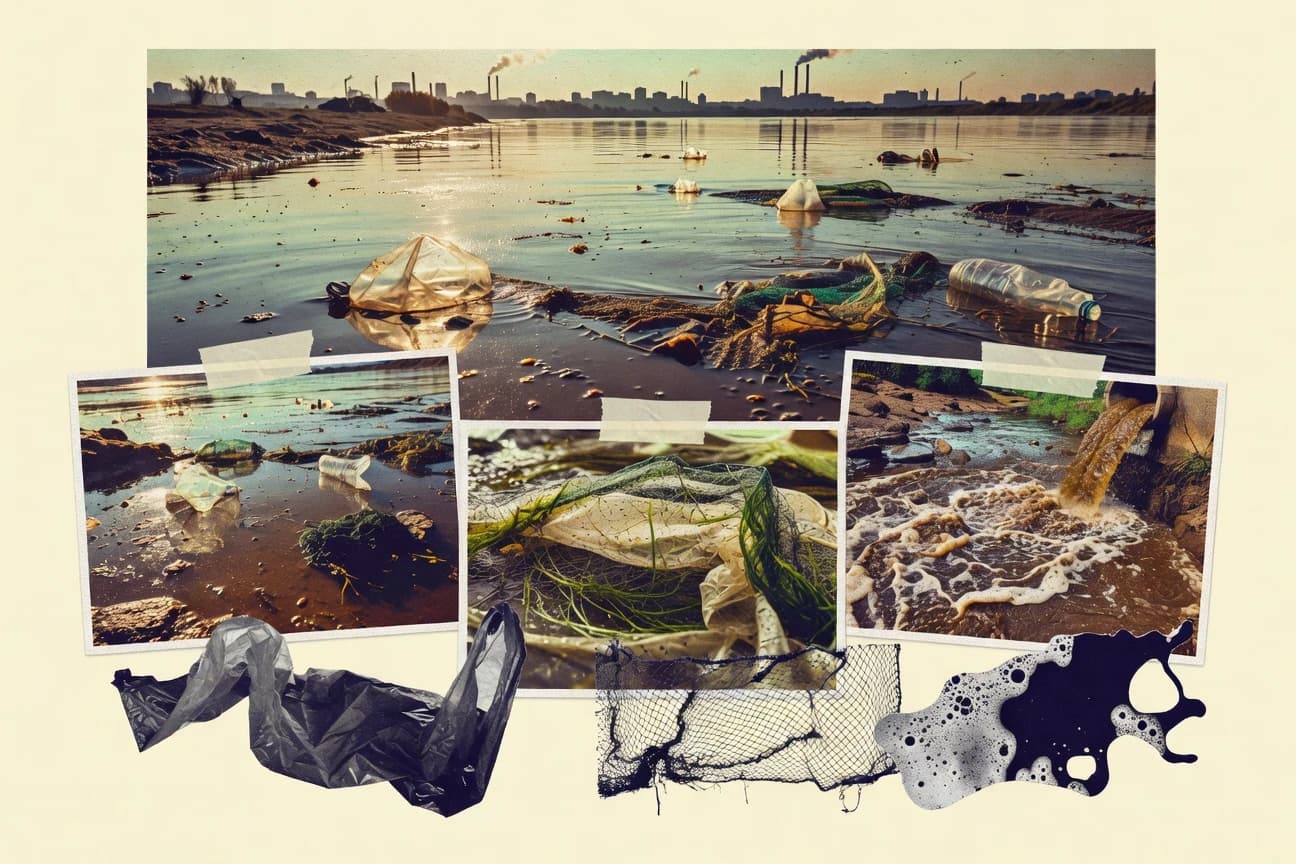
Single Use Plastics Statistics
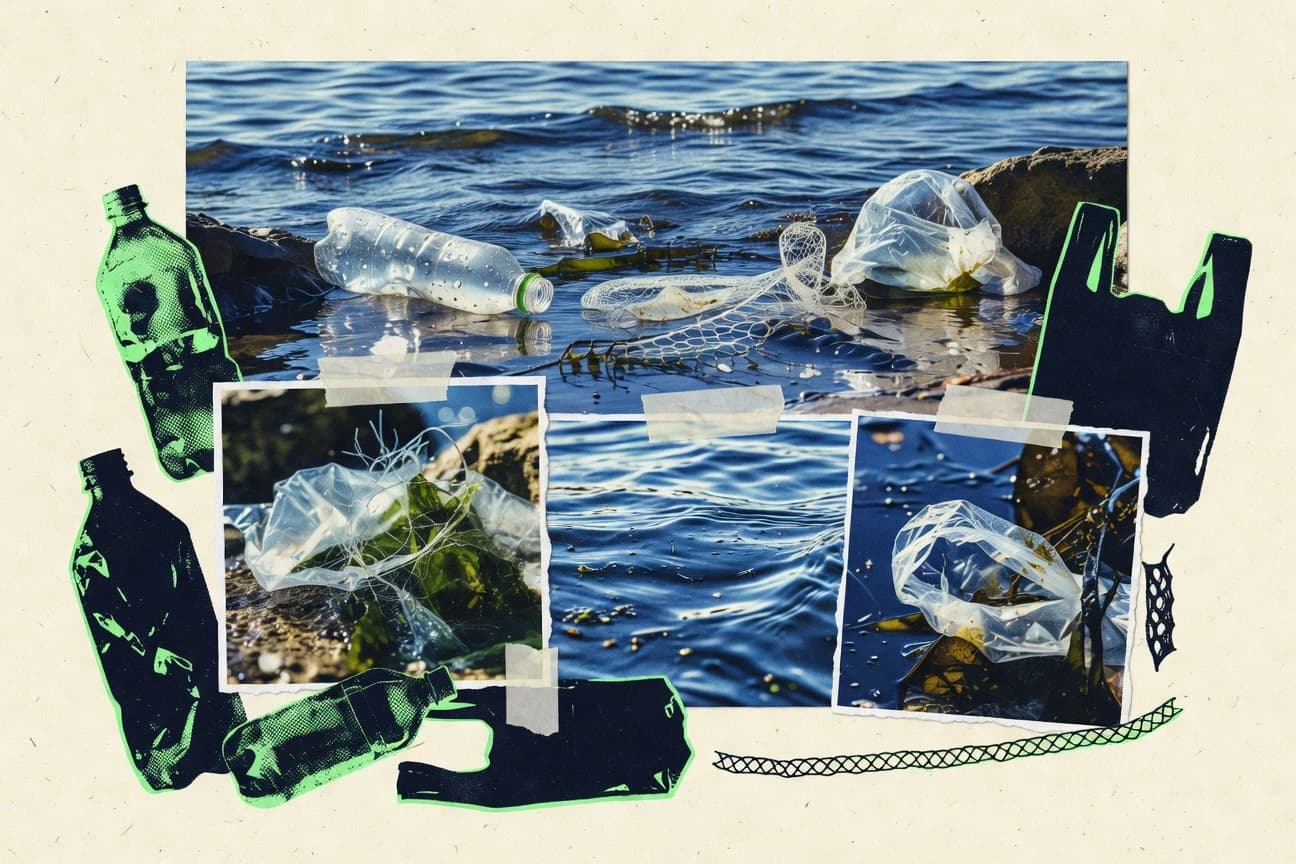
Single use plastics turn everyday convenience into staggering volume and fallout, from 2.5 billion single use water bottles used worldwide each day to microplastics and toxins reaching people, wildlife, and oceans. See why global recycling is only 9% and how single use items drive 3.4 million tons of pollution to the Great Pacific Garbage Patch, plus what that means for policy and public choices right now.
Noise Statistics
If you think subway and street noise is just “background,” the page shows how a 3 dB jump can halve safe exposure time and why typical rides reach 95 to 110 dB. You will also see how everyday sounds flip into immediate hearing danger, from a jackhammer at 110 dB after 1 minute to fireworks at 140 to 160 dB.
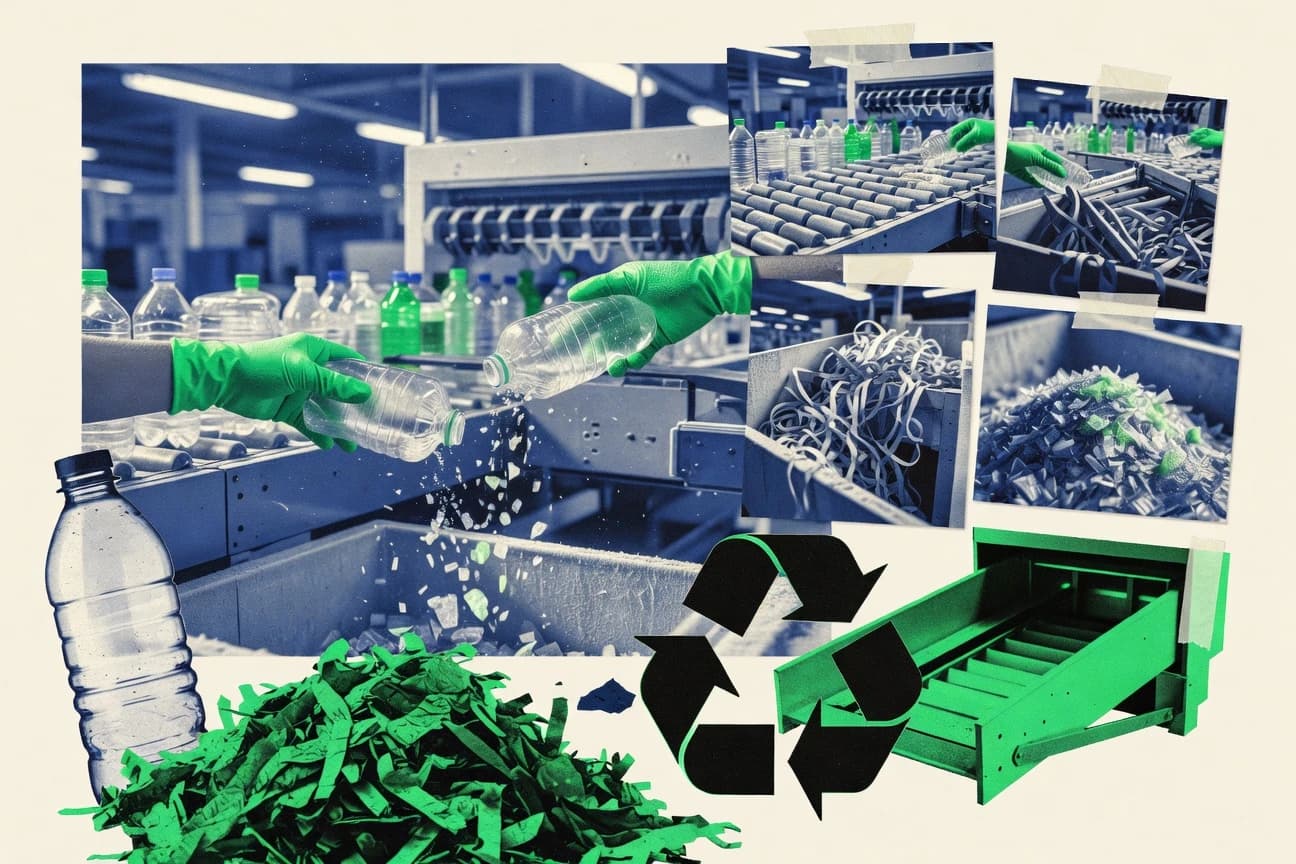
Plastics Recycling Industry Statistics
With the U.S. plastics recycling industry supporting 102,000 direct jobs and adding $14 billion to GDP annually as of 2022, this page maps the economic case behind circular plastics, from EU recycled PET priced 20 to 30 percent lower in 2023 markets to chemical recycling investments reaching $2.5 billion globally in 2022. It also connects the hidden tradeoffs, like 9 percent of plastics effectively recycled worldwide in 2019 and what higher purity sorting and rPET adoption could change for landfill, emissions, and supply chain costs.
China Pollution Statistics
China’s 2023 average PM2.5 sits at 32.2 μg/m³, about six times above WHO guidance, while local hotspots like Lanzhou average 55 μg/m³ and Urumqi hits PM10 annual average levels of 112 μg/m³. Get the full picture of what is driving the haze from coal heating spikes to industrial NOx and dust, and how pollution control since 2013 has still left millions of health and environmental impacts across cities and rivers.

Animal Poaching Statistics
Even with CITES MIKE reporting a 30% decline in poaching levels across monitored sites from 2018 to 2022, the scale remains brutal, from over 412,000 African elephants illegally killed for ivory between 2010 and 2020 to poaching and trafficking patterns that still produce seizures like 986 kg of ivory linked to syndicates in Angola. Read this to see how enforcement, community action, and market pressure collide in real places, where hotspots can swing from hundreds of incidents down to near zero, while other species like rhinos and tigers face parallel, high demand-driven threats.
Plastic Pollution In The Ocean Statistics
The page pulls no punches on the scale of the problem while tracking what actually works, from 29 million tons of plastic projected to enter oceans by 2040 and 5.25 trillion pieces already floating to treaty and deposit systems that could prevent 80 million tons of ocean entry by 2040. It pairs that with on the ground tactics and health impacts, like interceptors capturing 1,700 tons in 2023 across 15 countries and microplastics affecting seafood and humans at levels measured in weeks and grams, not abstracts.
Food Waste In America Statistics
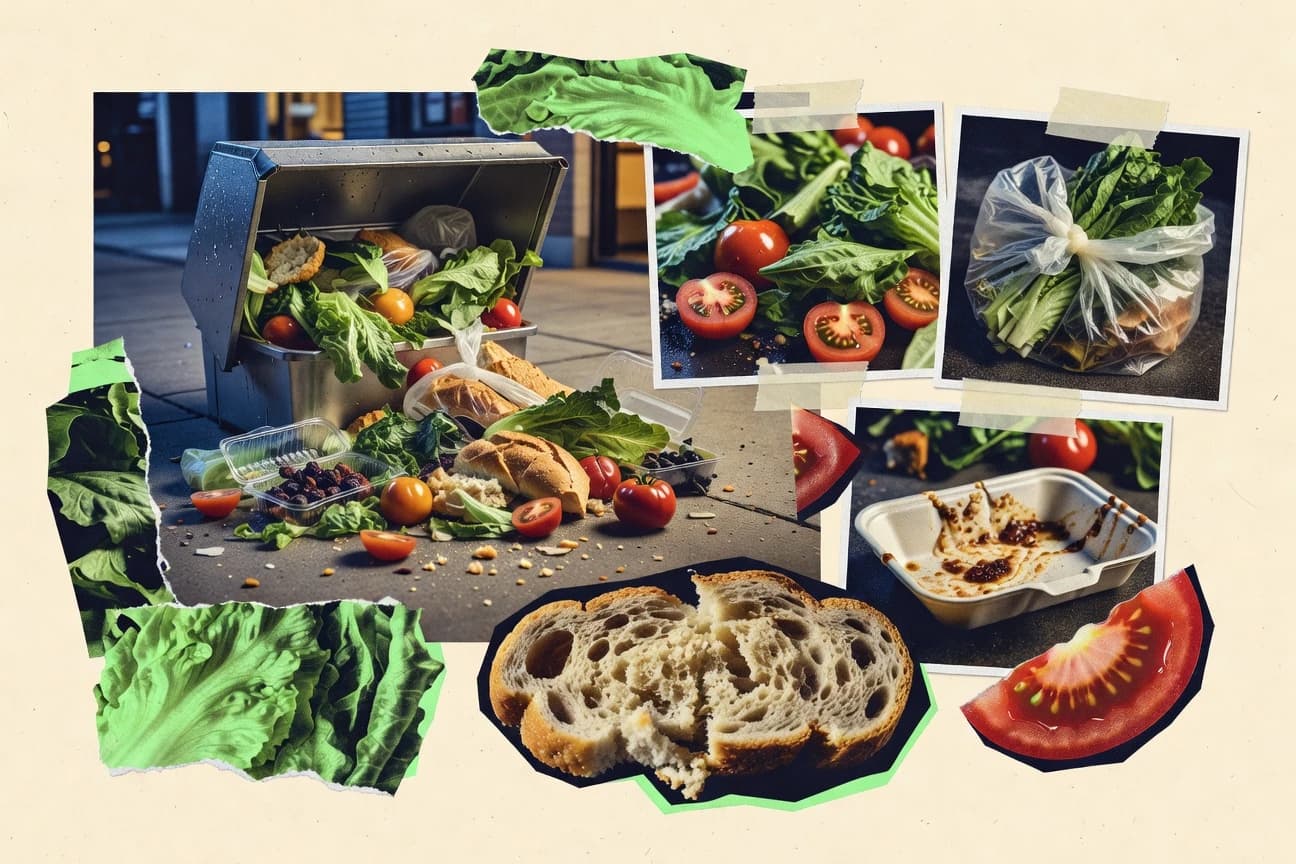
Food waste in the U.S. drains $429 billion from the economy in 2022 including externalities, even as 40% of what Americans buy goes unused and 42 coal powered plants worth of greenhouse gases are effectively released each year. This page tracks where the loss happens across farms, stores, and households and shows why the real costs go far beyond the price tags at checkout.
Ecological Statistics
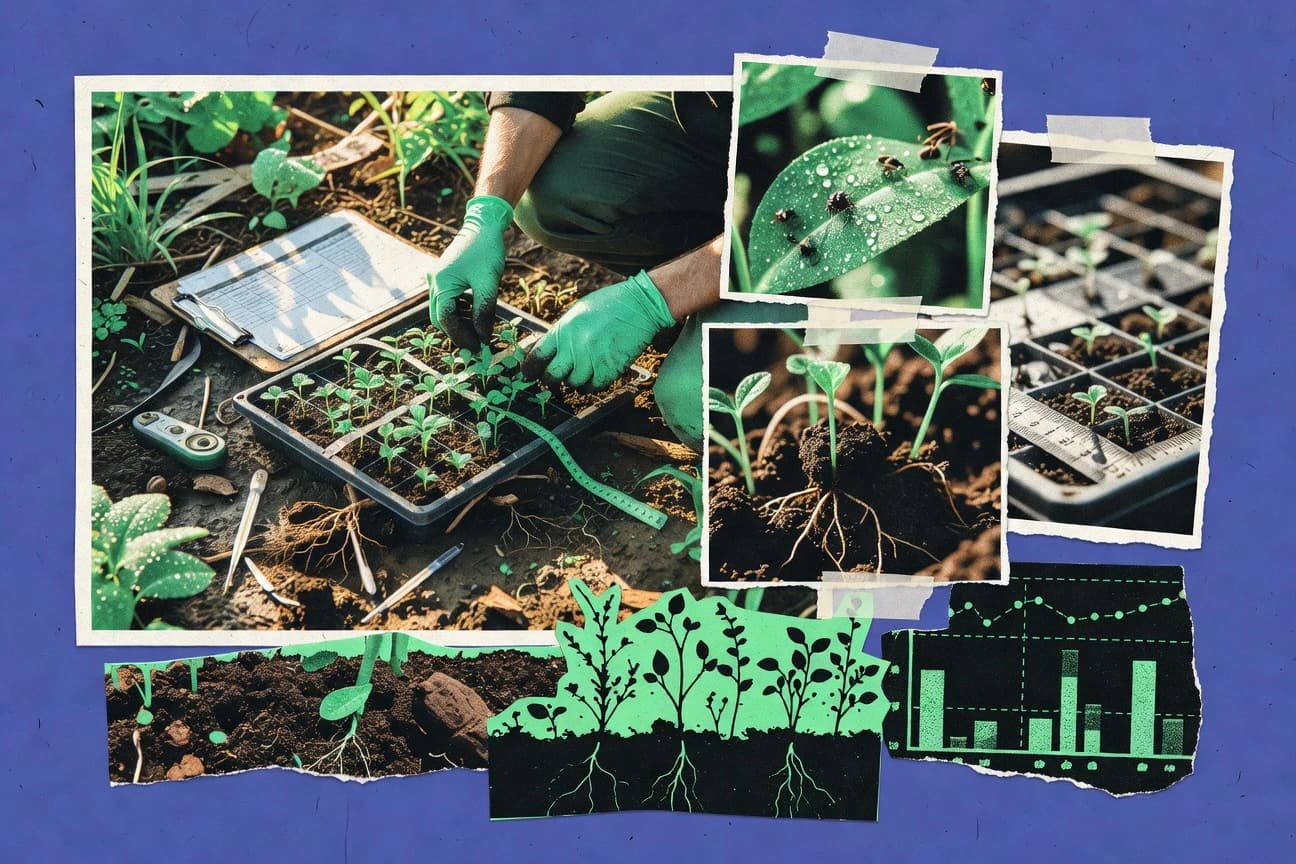
As of 2025, the IUCN Red List tracks 150,349 species and 28% are already classified as threatened, even as WWF reports an average 69% population decline in mammals, birds, reptiles, amphibians, and fish since 1970. You will also see how pressures add up across habitats, from 76% insect biomass loss in German protected areas to 34% marine animal declines, so you can understand what is driving today’s risks and where recovery might still be possible.

Water Wastewater Industry Statistics
Global wastewater still leaves 80% of rivers carrying untreated pollution, yet safely treated wastewater is only 55% worldwide as of 2023 with urban areas at 74% and rural at 38%. Track what drives the biggest wins and harms, from microfibers totaling 500,000 tons a year and 1.8 million deaths from waterborne disease to the innovations and regulations that are starting to reclaim water, cut nutrients, and curb emissions.
Elephant Poaching Statistics
Elephant poaching enforcement is getting sharper and it shows, from MIKE monitoring in 60 African sites to K9 units deployed in 20 parks, while law enforcement still arrests about 5,000 poachers each year. See how Kenya’s ranger training and Zakouma’s aerial patrols helped drive poaching down 95 percent, alongside the scale of seizures and bans that now target ivory trafficking at nearly every step.

Drought Statistics
A single 1°C of warming boosts atmospheric water demand by 7%, while El Niño raises drought risk by 50% in the tropics, pushing drought from a seasonal problem into a global systems shock. You will also see how aerosols have masked trends by 10 to 20% and why, even with early warning and smarter irrigation, drought costs keep climbing, with drought linked losses averaging $9 billion a year from 1990 to 2019.

Deforestation Statistics
Deforestation is ripping through ecosystems fast enough that by 2001 to 2022 tree cover loss worldwide reached 495 million hectares, while forests also drive biodiversity and climate shocks at the same time. From Amazon streams drying within 5 km of clearing to coral deaths up to 50% and a global forest carbon sink weakened by 20%, this page maps how habitat loss, fragmentation, and emissions connect in one relentless chain.

Poaching Statistics
Poaching pressures remain brutally measurable even as some countries inch forward with precision targets and seizures, from Botswana’s first zero elephant poaching deaths in 2022 to Tanzania recording 0.0? dead? highlights, while Africa still lost 1,013 elephants to poaching in 2019 under MIKE monitoring. Track how ivory and other wildlife trafficking translate into real losses across regions, including Angola’s 10,000+ elephant deaths since 2014 and the shifting tactics implied by the $23 billion annual global wildlife crime scale.

Light Pollution Statistics
With Milky Way visibility gone for most of us, about 80% of the global population lives under light-polluted skies, and in the contiguous United States 99% experience skyglow so strong it erases the natural night. Global sky brightness has risen by an average of 10% per year from 2012 to 2016, turning cities and even distant rural areas brighter than they should be.