GITNUX MARKETDATA
Browse Our Category
Environmental Ecological
Latest update:


Factory Pollution Statistics
See how factory emissions and wastewater keep piling up even as some pollutants fall fast, from US industrial SO2 and NOx benchmarks to Europe’s 80% SO2 cut since 1990, and then widen the view to mercury, plastics, and antibiotics contaminating air and rivers worldwide. You will also get the hard tradeoff behind the headlines, where factory pollution drives $8.1 trillion in annual global health damages and reshapes local costs from cleanup and lost workdays to premature deaths.
Global Water Scarcity Statistics
By 2050, water scarcity could displace 700 million to 1.8 billion people, while irrigation still drives most withdrawals at 70% of global freshwater use. Global Water Scarcity charts how climate change, groundwater depletion, and weak infrastructure turn everyday demand into cascading health, food, and conflict risks.
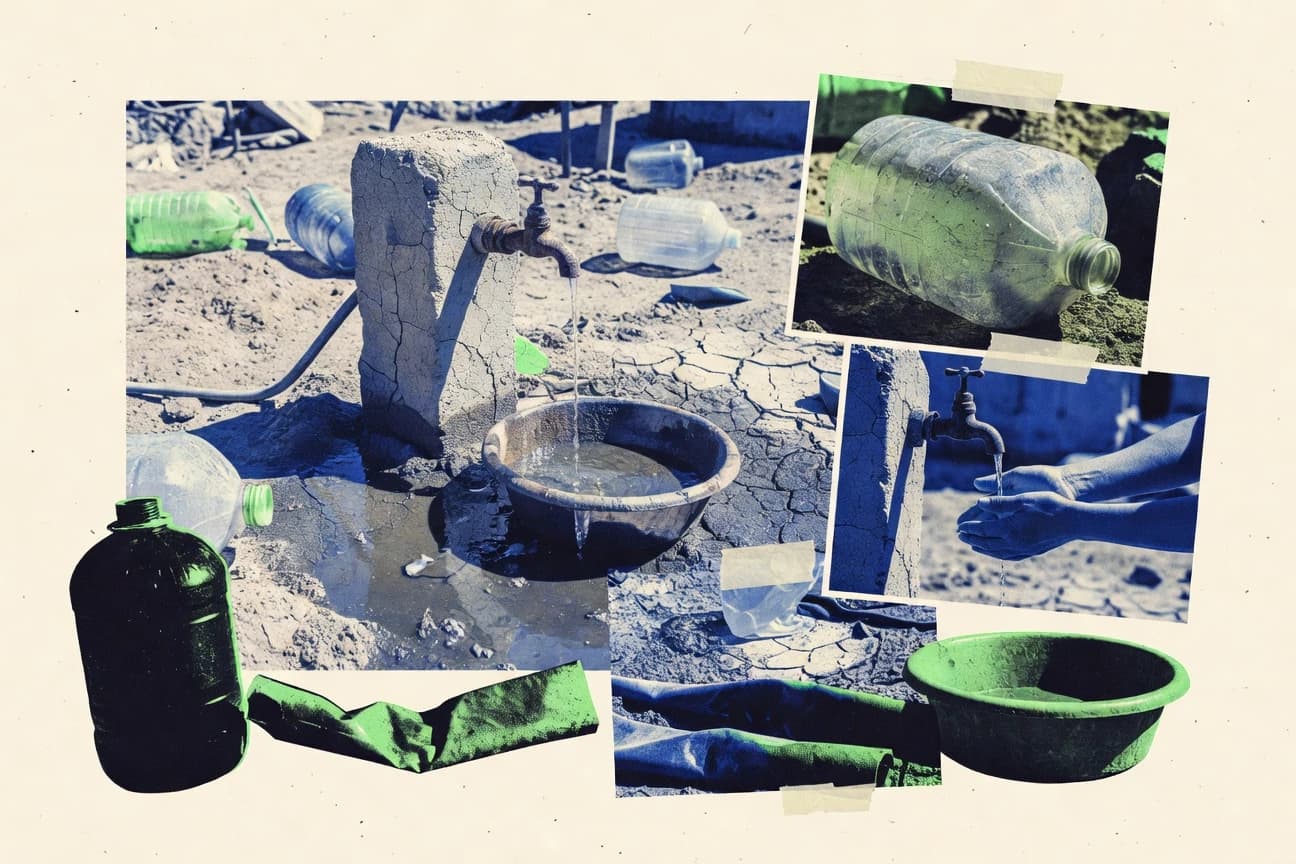
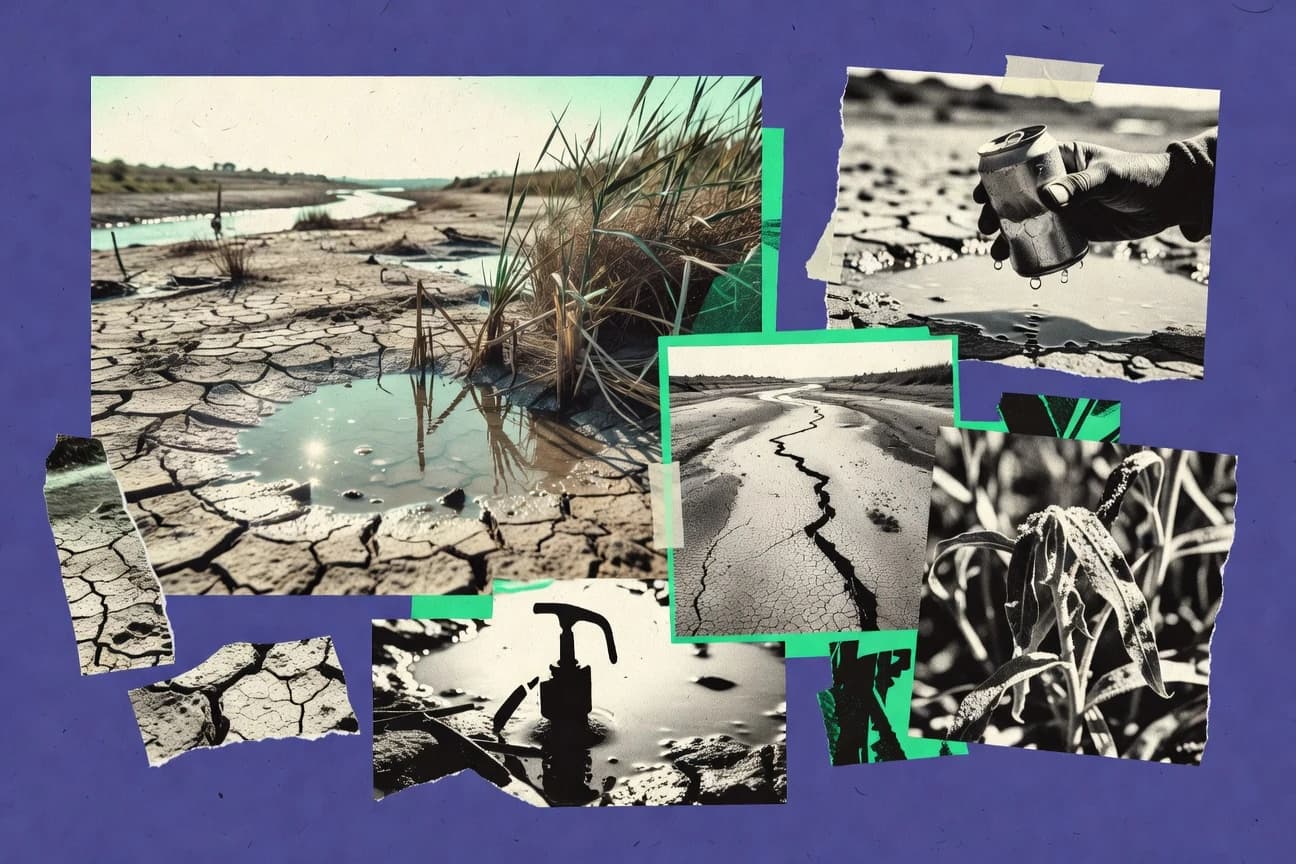
Water Crisis Statistics
By 2023, 2.4 billion people are still living without safely managed drinking water, and rural communities face deprivation up to 1.7 times worse than cities. Follow the sharp contrasts from Yemen’s 18% coverage to Europe’s 81% and see how water stress and contamination risks are reshaping health, livelihoods, and daily life worldwide.
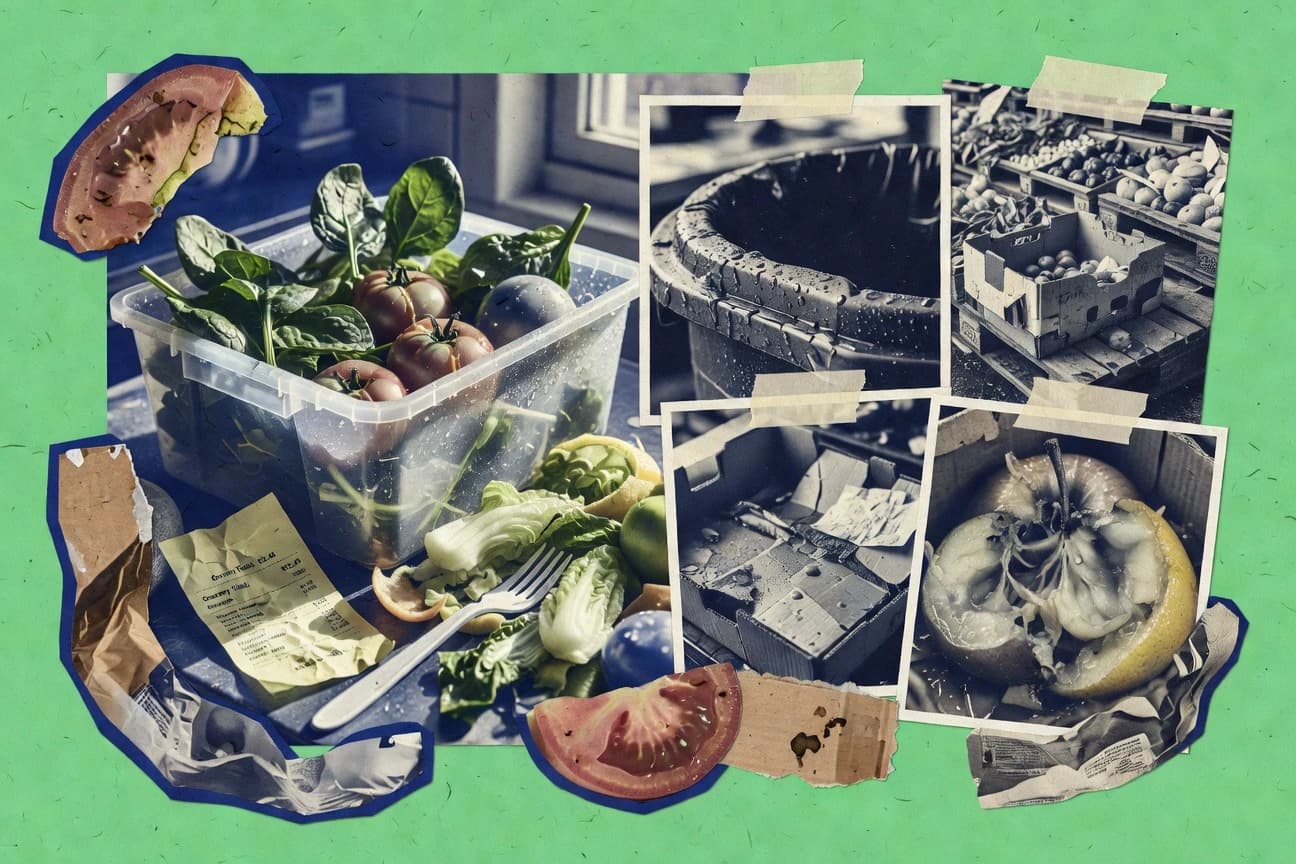
Global Food Waste Statistics
Households generate 59% of all food waste, totaling 611 million tonnes in 2022, but the breakdown swings wildly from Europe’s 99 kg per person to the US where households discard 40% of what they buy. Follow the chain from bread and dairy left to expire to losses before retail and the 8 to 10% share of global greenhouse gas emissions, and see exactly how preventable mistakes become billion tonne outcomes.

Office Paper Consumption Statistics
See how office paper demand is being squeezed and reshaped by remote work and digitization, with global office printer output still feeding 95 million tons of graphic paper demand worldwide and office printing waste running high. From US shipments down to 15.2 million tons in 2022 to EU-27 consumption of 28 million tons in 2021, this page links country by country sheet counts, recycling rates, and cost pressures to show exactly where paper use is holding on and where it is fading fast.

Microplastic Statistics
Global oceans are estimated to hold 24.4 trillion microplastic particles, yet 94% crowd into the top 200 meters, while hotspots range from 700,000 pieces per km² in the Great Pacific Garbage Patch to just 0.03 particles per m³ in Antarctic surface waters. This page pairs those striking contrasts with human and ecosystem counts, from 325 microplastic particles per liter in many bottled water samples to the sharp ingestion rates seen in seabirds and marine life, so you can see where pollution concentrates and where it quietly disperses.

Cell Phone Recycling Statistics
Only 17% of the world’s e-waste is formally collected, yet cell phones account for 7.5% and can be dragged down by informal takeback, hoarding, and illegal exports that slash recovery efficiency. By 2030, phone e-waste is projected to reach 12 million tons per year, so this page lays out where collection rates, materials recovery, and real economic value are hitting the hardest and why it matters now.
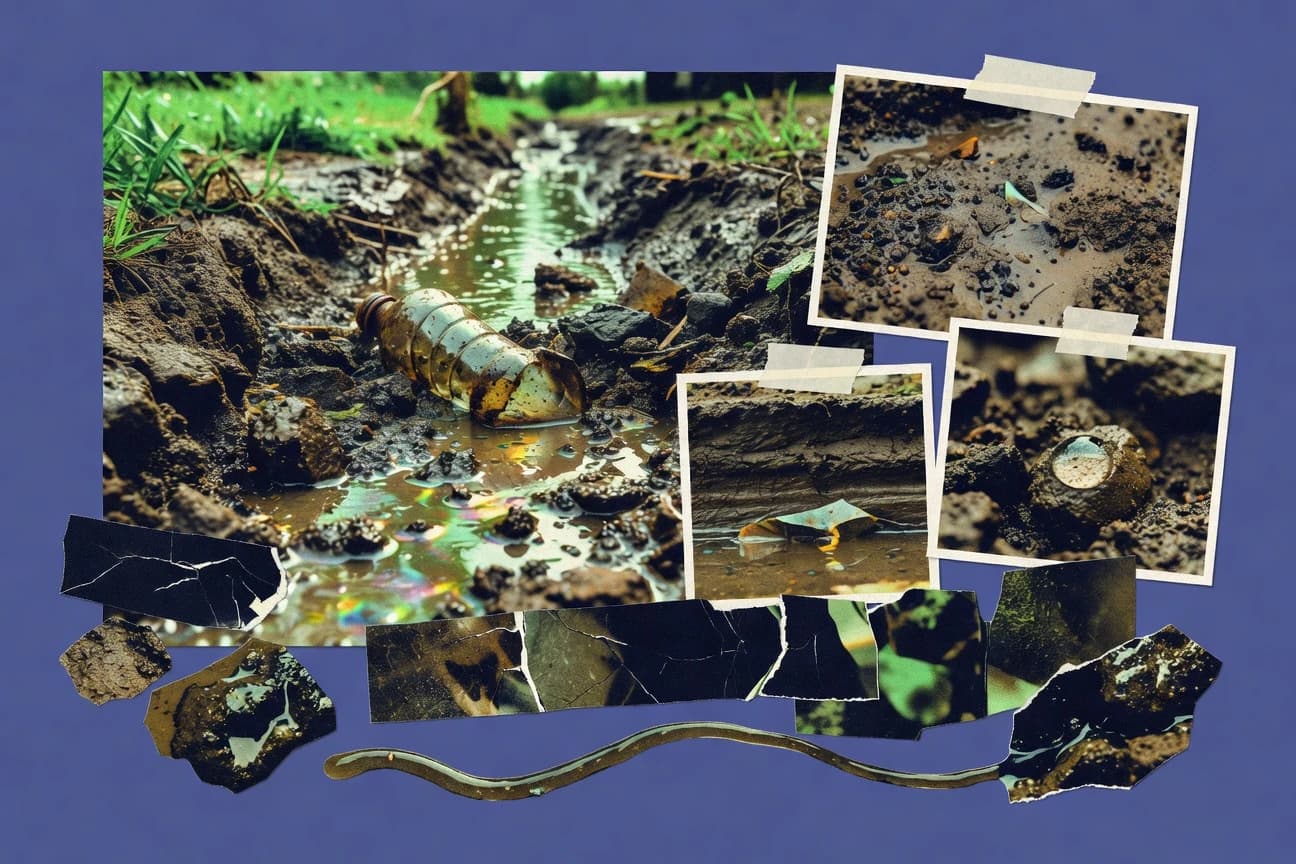
Soil Pollution Statistics
Soil pollution is no niche problem anymore. From 24% of global agricultural soils tainted by pesticides and microplastics in 80% of Asian farmland to 33% of Earth’s soils degraded by pollution, the page maps how contamination ripples into food, ecosystems, and public health.
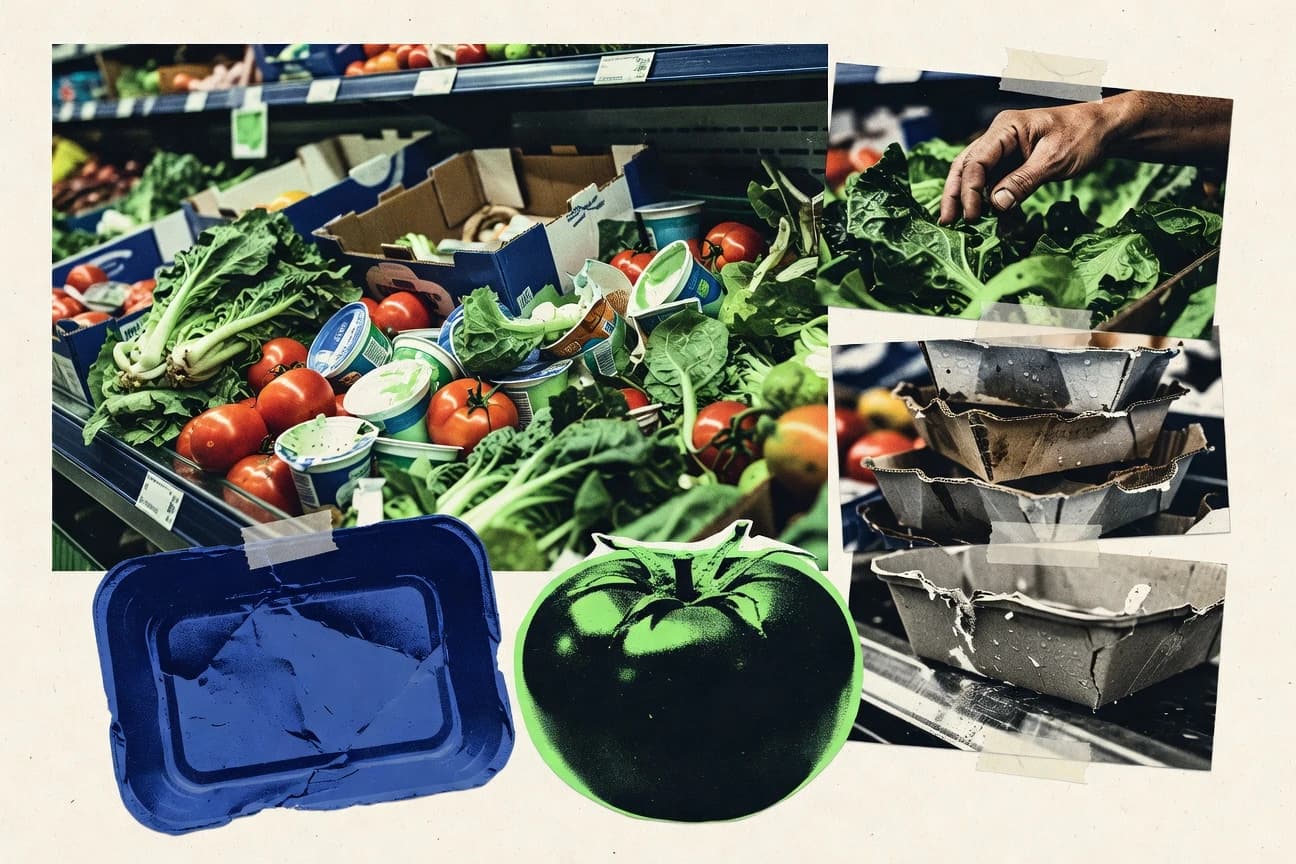
Grocery Store Food Waste Statistics
Grocery stores lose $18.1 billion in value every year in waste, and the drivers are surprisingly specific, from demand forecasting errors that create 32% of total waste to cosmetic rejections that toss 20% of fruit and veg before it ever hits a shelf. See how small operational slipups like 39% overstocking and 22% seafood spoilage compound across departments, and what changes can cut losses in ways that go beyond “better shopping.”

Water Technology Industry Statistics
Smart water funding surged to USD 2.8 billion for venture deals in 2023 and USD 12.4 billion for corporate innovation, while governments and multilateral lenders backed it with EUR 1.2 billion from Horizon Europe and USD 5.6 billion from the World Bank. The real tension is what comes next: water tech revenue markets are expanding fast, yet operational wins like smart metering cutting non revenue losses by 25 percent and advanced desalination research getting USD 150 million in the 2024 fiscal year show where breakthroughs are actually being forced into the field.

Co2 Emissions Statistics
China’s power sector alone emitted 6.7 GtCO2 in 2023, while global fossil fuel and cement CO2 hit a record 37.4 GtCO2, and the biggest surprises are how unevenly the burden and the momentum are shared across countries and sectors. Use this page to connect the latest totals with sector drivers, from road transport and industry to land use and aviation, and see what those patterns imply for targets like net zero and 2030 emissions cuts.

Litter Statistics
Litter drains public budgets and public health alike, costing US states and localities $11.5 billion every year while littered storm drains contribute to $2.5 billion in flood damage annually. Scroll past the beach cleanups to see how plastic persists for up to 450 years, fuels wildlife deaths, and even shows up in microplastics found in 83% of tap water.
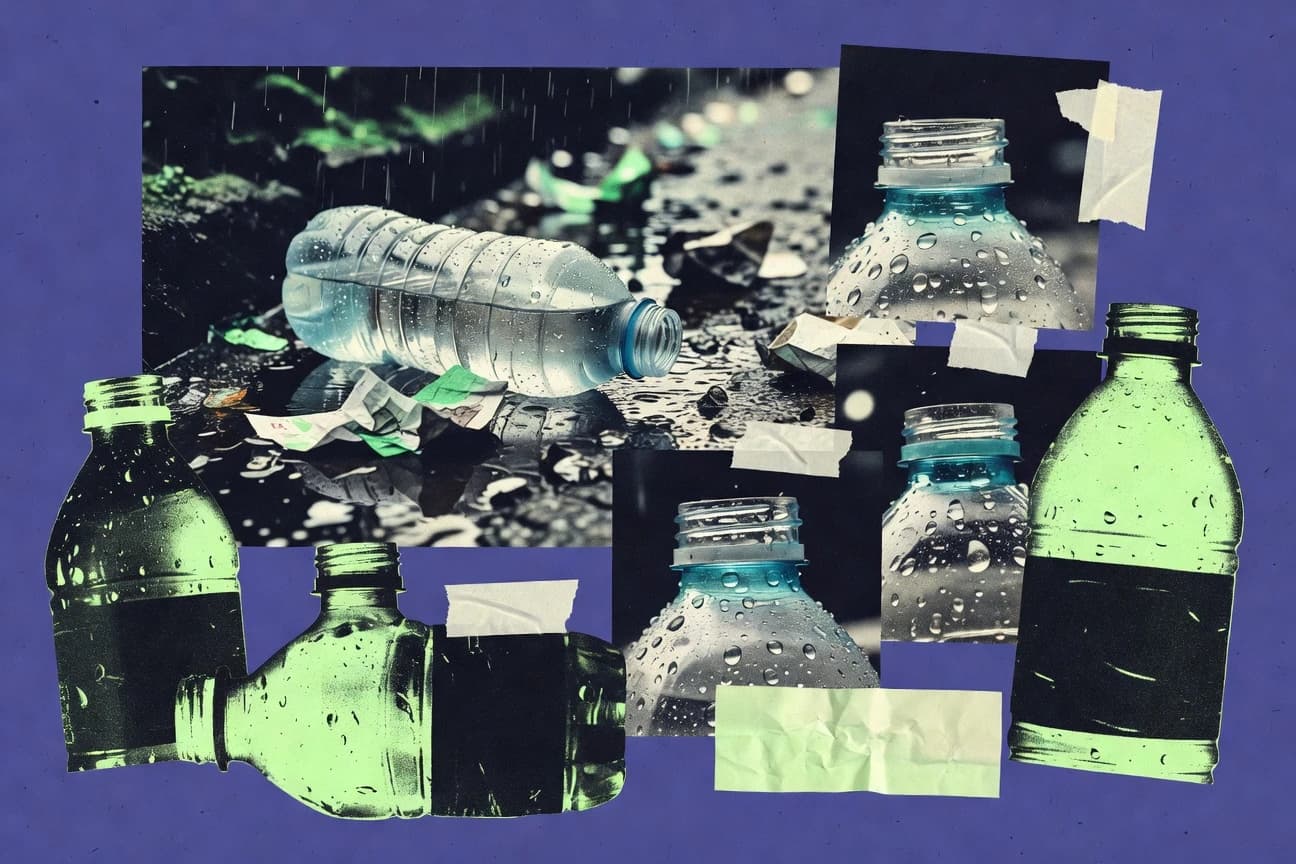
Plastic Water Bottle Statistics
Microplastics from plastic water bottles were found in 83% of human blood samples tested globally in 2023 while one bottle’s lifecycle can carry a climate footprint of about 200 g CO2e and harms 800 marine species. Read this page to connect that everyday convenience to the ocean share, tap water contamination, and near-total recycling reality that makes change feel urgent, not optional.

Endangered Animals Statistics
From Arctic ice disappearing and coral heatwaves bleaching reefs to drought and fire compressing habitats, these endangered animals face pressure that is measurable and accelerating like Great Barrier Reef heatwaves in 2022 that left 90% of corals bleached. Read through the page to see how targeted conservation can swing outcomes, from Namibia ranger efforts cutting rhino poaching by 90% since the 1990s to California condor releases that helped lift the wild population from 22 to 559 by 2024.
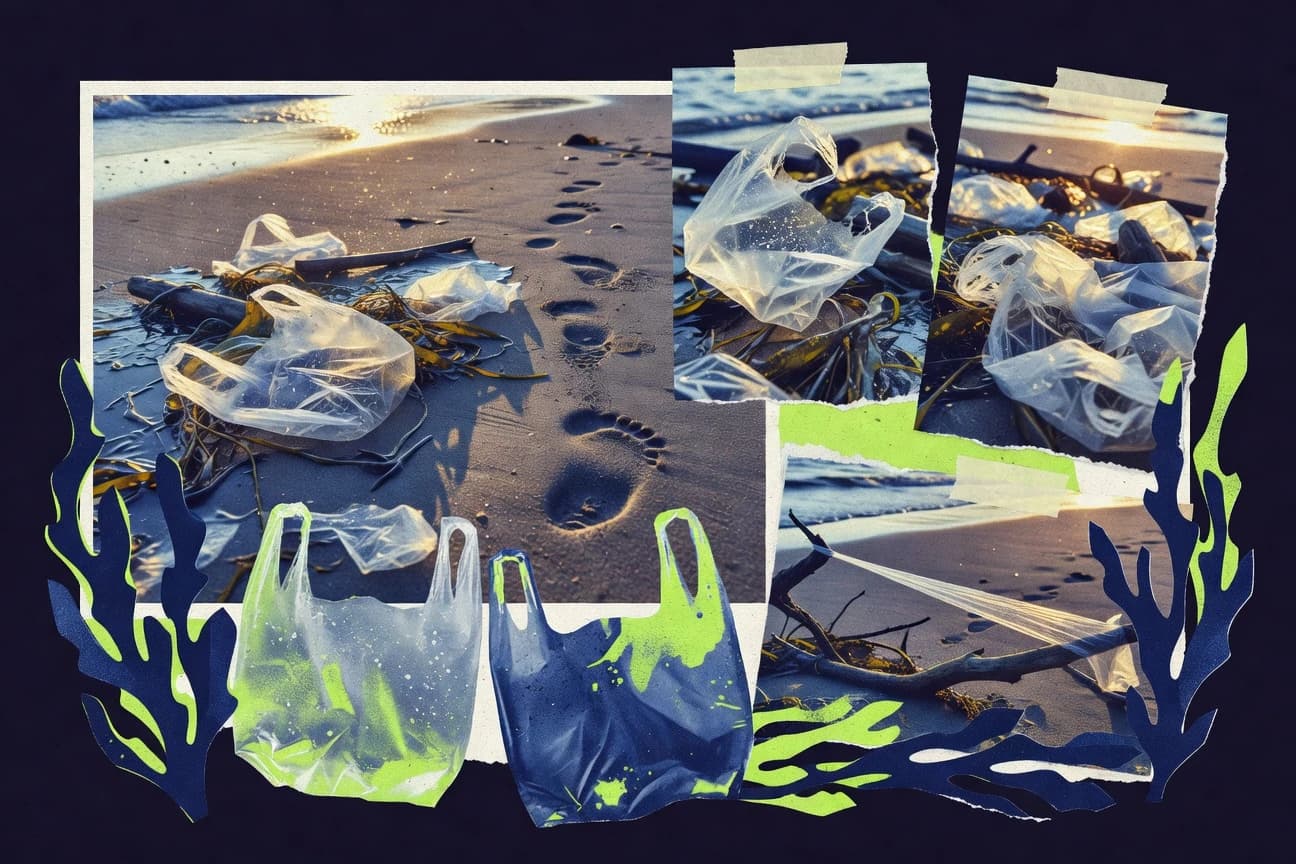
Plastic Bag Pollution Statistics
Plastic bag pollution is turning up everywhere, from microplastics in 88% of global ocean surface waters to bags driving 40% of Nile River drainage blockages that worsen floods in Egypt. The page also tracks the cascade of harm, where bags make up 46% of the largest plastics in the Great Pacific Garbage Patch and, even after they biodegrade, keep releasing toxins, methane, and UV driven airborne microplastics.

Ocean Acidification Statistics
Ocean acidification is already rewriting the chemistry and the biology of marine life, with pteropod shells dissolving 30% faster at pH 7.8 and coral recruits survival sliding 52% at pCO2 950 μatm. The page connects these tipping point losses to the wider pressure behind them, including a shift in global conditions from pre industrial CO2 of 280 ppm to over 420 ppm in 2023, and shows exactly what that means for reefs, fisheries, and coastal economies.

Bee Decline Statistics
Neonicotinoids show up in 75% of pollen and 45% of nectar samples, and linked mortality rises by 20 to 30%, while climate and habitat change in Europe shifts foraging 2 to 3 weeks earlier and cuts pollen availability by 20%. Bee Decline tracks how pesticides, Varroa and disease, and shrinking habitat collide with pollination stakes that keep climbing, with U.S. honey bee losses reaching 43.7% in 2010 to 2011 and wild bee abundance down 25% from 1990 to 2017.
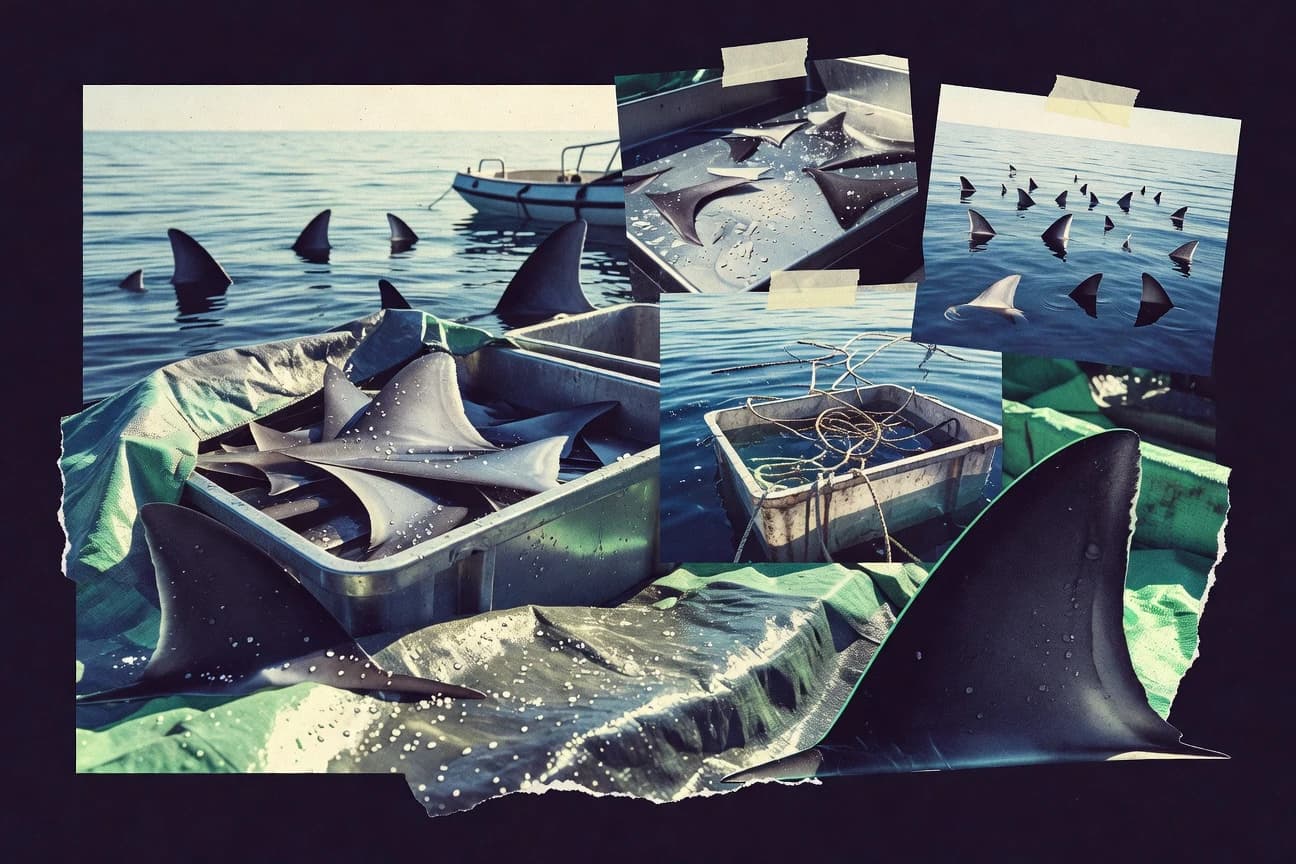
Shark Finning Statistics
See how Hong Kong cut shark fin consumption by 50% since 2014 while CITES protections expanded in 2023 to cover three more shark species and WWF helped establish 50 shark sanctuaries across 20 million sq km by 2023. Then contrast these policy wins with the persistent reality of finning, including illegal trade worth $1 to $2 billion annually and annual killing on the scale of tens of millions of sharks for their fins.

Ocean Statistics
The ocean covers 36% of Earth’s surface yet touches lives on land through fisheries, trade, and climate, from 35% of CO₂ absorbed by the ocean to 3.2 billion people living near coastlines. This page pulls together the big, current pivots including aquaculture surpassing capture by volume and 2025 style urgency points like 90% of world trade moving by sea and growing plastic and ocean heat pressures.
Environmental Science Statistics
Air pollution remains a global killer, tied to 7 million premature deaths in 2019, yet the page also tracks how climate change and infrastructure choices are reshaping risk, with 250,000 additional climate related deaths projected per year from 2030 to 2050 and global renewable capacity reaching about 4,150 GW by end 2023. Pairing health burdens from air, water, and sanitation with the momentum of monitoring, storage, and clean power, these statistics help you see where environmental pressure turns into measurable human outcomes.