
Global oceans are estimated to contain about 24.4 trillion microplastic particles, with 94% packed into the top 200 meters. That same mismatch between where plastics are easiest to find and where they end up shows up everywhere, from sea ice at 12,000 particles per liter of meltwater to the North Pacific Subtropical Gyre holding roughly 80,000 metric tons. We’ll move through these measurements field by field and depth by depth to see how microplastics build an uneven map across water, sediments, wildlife, and even people.
Key Takeaways
- Global oceans contain an estimated 24.4 trillion microplastic particles, with 94% located in the top 200 meters of the water column
- In the Great Pacific Garbage Patch, microplastic density reaches up to 700,000 pieces per km² in subsurface waters at 200m depth
- Arctic sea ice contains 12,000 microplastic particles per liter of meltwater, primarily polyethylene fibers
- Human placental tissue contains 4.0 microgram microplastics per gram, with 6-25 μm particles predominant
- 93% of bottled water brands tested contain an average of 325 microplastic particles per liter
- Human lung tissue from surgical patients averages 12 microplastic particles per section, mostly <5μm
- Global ban on microbeads in rinse-off cosmetics adopted by 80+ countries by 2023, covering 91% of top brands
- Wastewater treatment plants remove 99% of microplastics, retaining 91% in sludge applied to 56% of US cropland
- EU Single-Use Plastics Directive bans microbeads in cosmetics since 2020, reducing 5,000 tons/year emissions
- Worldwide, microplastics are found in 88% of ocean surface samples tested since 1972
- Synthetic textile fibers from laundry washing contribute 35% of primary microplastics entering oceans annually, equating to 0.5 million tons
- Tire wear particles account for 28% of microplastics in European rivers, generating 1.1 million tons yearly in the EU
- Microplastics ingested by fish reduce growth rates by 20-30% in species like European seabass
- Seabirds in the North Pacific have 90% incidence of microplastic ingestion, averaging 5.6 pieces per bird
- Clams exposed to 0.023 microplastic particles/mL show 50% reduction in feeding efficiency
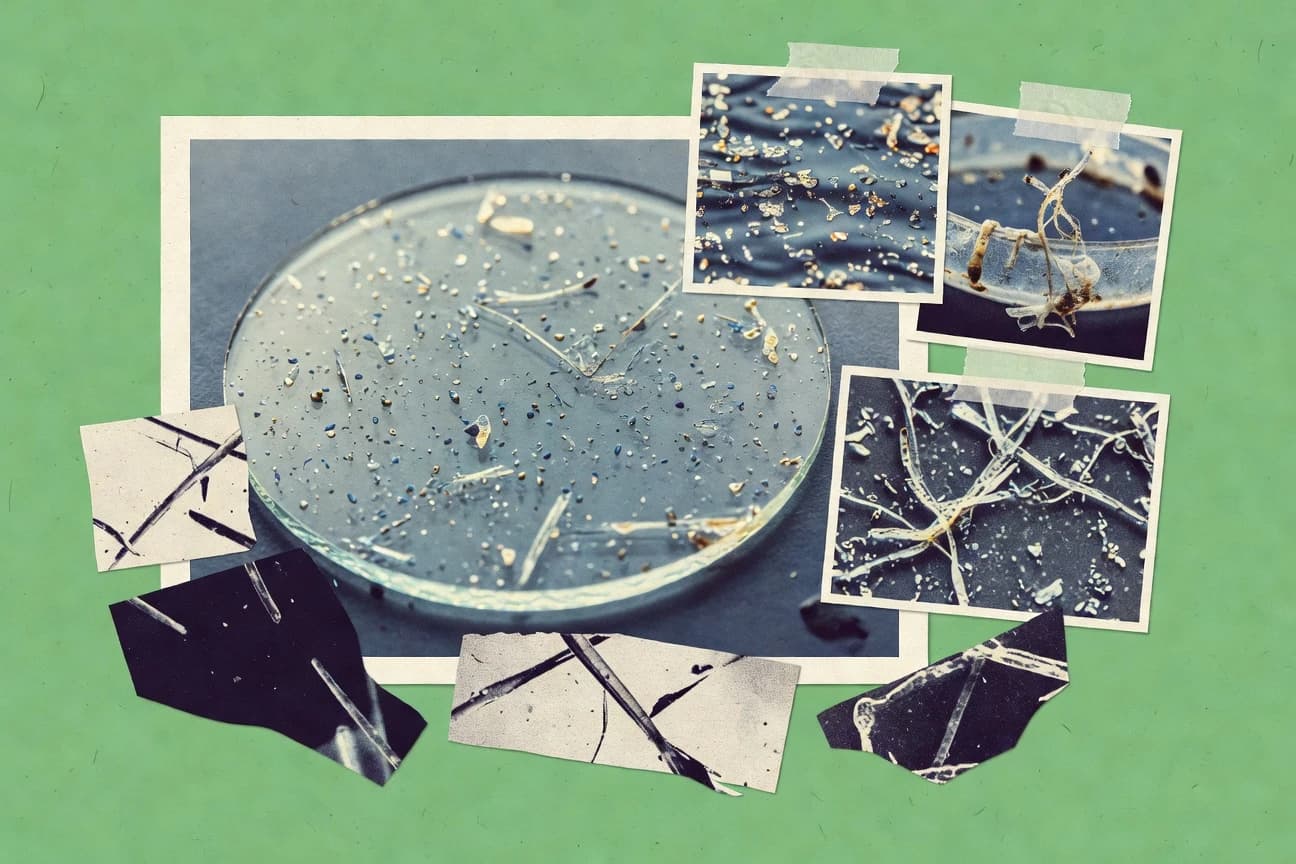
Oceans and wildlife are already packed with microplastics, with trillions found from surface to deep waters.
Related reading
01 · Category
Environmental Occurrence30 stats
01
Global oceans contain an estimated 24.4 trillion microplastic particles, with 94% located in the top 200 meters of the water column
02
In the Great Pacific Garbage Patch, microplastic density reaches up to 700,000 pieces per km² in subsurface waters at 200m depth
03
Arctic sea ice contains 12,000 microplastic particles per liter of meltwater, primarily polyethylene fibers
04
The Colorado River Basin sediments hold 4,357 microplastic particles per kg of dry sediment
05
Lake Victoria in Africa has surface water microplastic concentrations of 5.4 particles per m³, dominated by fragments
06
Urban stormwater runoff in Los Angeles carries 11,300 microplastic particles per liter during peak flow events
07
Deep-sea sediments off Hawaii accumulate 392 microplastic particles per m² at depths over 4,000m
08
Swiss lake sediments from Lake Geneva contain 78 microplastic particles per gram of sediment
09
Australian coastal waters average 4.1 microplastic particles per m² on the sea surface
10
The Yangtze River estuary has 413,000 microplastic particles per km² in surface water
11
Antarctic surface waters show 0.03 microplastic particles per m³, mostly fibers from atmospheric deposition
12
Mangrove sediments in Malaysia contain up to 32.8 microplastic particles per gram
13
English Channel beaches average 53 microplastic particles per m² in sand samples
14
Gulf of Mexico seafloor has 1,656 microplastic particles per m² at 1,000m depth
15
Tibetan Plateau lakes hold 0.79 microplastic particles per liter
16
Baltic Sea surface microlitter density is 0.12 particles per m²
17
Florida Everglades wetlands contain 8.6 microplastic particles per m² in surface water
18
North Pacific Subtropical Gyre has 1.8 trillion microplastic pieces totaling 80,000 metric tons
19
Danube River water averages 0.32 microplastic particles per m³
20
Indonesian coral reefs harbor 15.8 microplastic particles per m² in surrounding waters
21
Canadian Arctic rivers carry 57 microplastic particles per m³
22
Persian Gulf sediments average 120 microplastic particles per kg
23
Norwegian fjords contain 1.9 microplastic particles per m³ in plankton nets
24
Amazon River basin soils have 4.2 microplastic particles per gram
25
Mediterranean deep basins accumulate 2,150 microplastic particles per m²
26
Hudson River estuary shows 0.4 microplastic particles per liter
27
Galapagos Islands marine protected areas have 0.26 microplastic particles per m³
28
Patagonian shelf sediments contain 67 microplastic particles per kg dry weight
29
Southeast Asian monsoon rivers transport 1.15 trillion microplastic particles annually
30
Remote Pacific atolls beach sands average 198 microplastic particles per kg
Interpretation
Environmental Occurrence Interpretation
Our planet has meticulously replaced its once pristine waters with a chillingly thorough plastic soup, from the sunlit surface down to the eternal dark of the abyss, proving that humanity's waste is now the most ubiquitous and committed colonizer on Earth.
02 · Category
Human Health28 stats
01
Human placental tissue contains 4.0 microgram microplastics per gram, with 6-25 μm particles predominant
02
93% of bottled water brands tested contain an average of 325 microplastic particles per liter
03
Human lung tissue from surgical patients averages 12 microplastic particles per section, mostly <5μm
04
Table salt worldwide averages 0-681 microplastic particles per kg, with sea salt highest at 550
05
Infants ingest 74,000-121,000 microplastic particles yearly via bottled milk formula
06
Airborne microplastics deposit 272 particles per m² per day in urban Paris, inhalable fraction 83%
07
Human feces from 8 individuals contain average 20 microplastic particles per 10g
08
Beer samples average 12.4 microplastic particles per liter across 5 countries
09
Tea bags release 11.6 billion microplastic particles per cup when steeped at 95°C
10
Seafood consumption leads to 11,000 microplastics ingested per person yearly in the US
11
Indoor air contains 1.6 ± 0.9 microplastic fibers per m³, 4x higher than outdoors
12
Canned fish products average 152 microplastic particles per serving
13
Human blood samples from 22 donors show 77% positive for microplastics, avg 1.6 μg/mL
14
Tap water in the US contains average 4.34 microplastic particles per liter
15
Airline cabin air has up to 17 microplastic particles per m³
16
Children aged 1-2 ingest 91,000 microplastics yearly from dust and air
17
Processed honey contains average 0.10 microplastic particles per gram across global brands
18
Microplastics in carotid plaques from 304 patients average 21.7 particles/g, 4x higher than controls
19
Drinking water from plastic bottles adds 90,000 microplastics per person yearly
20
Human semen samples show 1-10 μm microplastics in 25% of cases
21
Urban street dust averages 530 microplastic particles per gram, inhaled dose 0.1-1 mg/day
22
Apples contain average 103,900 microplastic particles per gram
23
Microwaving plastic containers releases 4.22 million microplastic particles per cm²
24
Rainwater in Colorado mountains contains 365 microplastic particles per liter
25
Broccoli averages 52 microplastic particles per gram in peel
26
Cosmetics contribute 2,000 tons of microplastics to wastewater daily globally pre-bans
27
Elderly inhale 272 microplastics per day from indoor air
28
EU citizens ingest 510 microplastic particles from shellfish weekly
Interpretation
Human Health Interpretation
From our first breath to our last meal, we are now marinating in a synthetic confetti of our own making, with microplastics found in everything from the air we breathe and the water we drink to the deepest recesses of our bodies, proving we have successfully adulterated every link in our own food chain.
03 · Category
Policy/Remediation27 stats
01
Global ban on microbeads in rinse-off cosmetics adopted by 80+ countries by 2023, covering 91% of top brands
02
Wastewater treatment plants remove 99% of microplastics, retaining 91% in sludge applied to 56% of US cropland
03
EU Single-Use Plastics Directive bans microbeads in cosmetics since 2020, reducing 5,000 tons/year emissions
04
US Microbead-Free Waters Act of 2015 banned microbeads in cosmetics, eliminating 30,000 tons over decade
05
UNEA Resolution 5/14 calls for global treaty on plastic pollution by 2024, targeting full lifecycle
06
Membrane bioreactor tech in WWTPs achieves 99.9% microplastic removal efficiency
07
California's SB 54 bans microbeads since 2017, first US state law
08
G7 Ocean Plastics Charter aims to recycle 50% plastics by 2030, 100% reuse by 2050
09
Disk filters in wastewater treatment capture 95-99% microplastics >20μm
10
New Zealand banned microbeads in 2018, covering rinse-off products
11
Global commitment at Our Ocean Conference pledges $13 billion for plastic waste management by 2025
12
Bio-based flocculants remove 90% microplastics from WWTP effluent
13
UK's 25-year Environment Plan targets zero avoidable plastic waste by 2042
14
Canada banned microbeads in toiletries 2018, expanded to drains 2020
15
Magnetic nano-adsorbents extract 98% nanoplastics from water
16
France's anti-waste law bans plastic plates/cups from 2020, microbeads from 2018
17
INC-1 advances treaty text with microplastics provisions at Uruguay 2023
18
Foam flotation separation recovers 85% microplastics from beach sand
19
Australia's National Plastics Plan targets 100% reusable/recyclable packaging by 2025
20
Centrifugal separation tech removes 92% microplastics from stormwater runoff
21
Kenya's plastic bag ban since 2017 reduced microplastic precursors by 80% in rivers
22
Electrified water filters capture 89% airborne microplastics
23
India's Plastic Waste Management Rules 2016 mandate EPR for producers
24
Ultrasonic cavitation degrades 70% polystyrene microplastics in 30 min
25
Nordic Swan Ecolabel bans microplastics in certified textiles since 2021
26
Biodegradable polymer alternatives reduce microplastic persistence by 90% in soil
27
Global Plastic Treaty negotiations target production caps, with 175 countries participating by 2024
Interpretation
Policy/Remediation Interpretation
We're frantically patching the holes while the plastic tap still pours, hoping our little dams can hold back a flood we designed.
More related reading
04 · Category
Sources26 stats
01
Worldwide, microplastics are found in 88% of ocean surface samples tested since 1972
02
Synthetic textile fibers from laundry washing contribute 35% of primary microplastics entering oceans annually, equating to 0.5 million tons
03
Tire wear particles account for 28% of microplastics in European rivers, generating 1.1 million tons yearly in the EU
04
Cosmetic microbeads comprised 2% of primary microplastics before 2018 bans, with 12,000 tons entering US waterways pre-ban
05
Global plastic production reached 460 million tons in 2019, with 79% ending as mismanaged waste potential microplastic source
06
Road marking paints release 3,400 tons of microplastics yearly in Sweden alone
07
Fishing gear contributes 640,000 tons of microplastics to oceans annually via abrasion and loss
08
Agricultural plastic mulching generates 120,000 tons of microplastics entering Chinese soils yearly
09
Wastewater treatment plants effluent discharges 1-15 trillion microplastic particles daily worldwide
10
Atmospheric deposition delivers 4,000-57,000 microplastic particles per m² per year to remote oceans
11
Plastic pellets (nurdles) lost during transport amount to 100,000 tons entering marine environments yearly
12
Single-use plastic bags degrade into 4.3 million tons of microplastics in oceans over 10 years
13
Industrial abrasion of plastic products releases 12% of primary microplastics, estimated at 1.5 million tons globally per year
14
Maritime coatings on ships erode into 35,000 tons of microplastics annually in oceans
15
US plastic packaging waste totals 14.5 million tons yearly, 76% landfilled and fragmenting into microplastics
16
Global microfiber shedding from clothing washing is 496,000 tons per year
17
Paint chips from building maintenance contribute 7,000 tons of microplastics to UK waterways annually
18
Agricultural tire wear adds 10,000-30,000 tons of microplastics to EU soils yearly
19
Plastic nursery pots degrade releasing 1,200 tons of microplastics to horticultural soils in the Netherlands yearly
20
Ship scrubber discharge releases 1,400 tons of microplastics from antifouling paints globally per year
21
Expanded polystyrene packaging breaks down into 2.5 million tons of microplastics in landfills annually worldwide
22
Road runoff in Germany carries 80,000 tons of tire-derived microplastics into rivers yearly
23
PET bottle production discards generate 150,000 tons of microplastic precursors in Asia yearly
24
Synthetic turf fields shed 3,500-11,000 tons of microplastics into European soils annually
25
Global plastic incineration ash contains 0.1-1% microplastics, totaling 500,000 tons released via fly ash yearly
26
Laundry dryers vent 25-100 million microplastic fibers per household per year in the US
Interpretation
Sources Interpretation
From our laundry rooms to our highways and farmlands, humanity has perfected the art of turning nearly everything—from the clothes we wear to the tires we ride on—into a relentless, planetary confetti of microplastics.
05 · Category
Wildlife Impacts27 stats
01
Microplastics ingested by fish reduce growth rates by 20-30% in species like European seabass
02
Seabirds in the North Pacific have 90% incidence of microplastic ingestion, averaging 5.6 pieces per bird
03
Clams exposed to 0.023 microplastic particles/mL show 50% reduction in feeding efficiency
04
Coral larvae settlement decreases by 52% when exposed to 10^4 polyethylene microspheres per mL
05
Zooplankton ingestion of polystyrene microplastics reduces reproduction by 40% in copepods
06
Freshwater mussels accumulate 0.44 microplastic particles per gram of tissue, impairing filtration by 25%
07
Loggerhead sea turtles have microplastics in 59% of scats, correlating with 20% body burden increase
08
Earthworms in microplastic-amended soils exhibit 20% reduced burrowing activity and 15% weight loss
09
Antarctic krill ingest up to 14,000 microplastic fibers per individual, reducing lipid content by 10%
10
Fish in the Laurentian Great Lakes have microplastics in 75% of gastrointestinal tracts, averaging 1.5 particles/fish
11
Honeybees exposed to 10 μm polystyrene beads show 30% foraging efficiency decline
12
Barnacles on floating plastics have 97% higher microplastic ingestion than on natural substrates
13
Atlantic salmon smolts with microplastics experience 37% higher mortality during osmoregulation stress
14
Springtails in soil with 0.4% polyethylene mulch show 25% reduced reproduction rates
15
Marine mammals off California coasts have microplastics in 50% of necropsies, linked to inflammation
16
Daphnia magna exposed to 10^5 particles/L polystyrene have 70% lower survival after 21 days
17
Seabass larvae feeding on microplastic-contaminated prey show 25% reduced growth
18
Arctic seals ingest 1,460 microplastic pieces per individual on average
19
Lugworms in contaminated sediments bioaccumulate 7 microplastic particles per gram tissue, reducing egestion by 30%
20
Pelagic seabirds nestlings have microplastic-induced reduced fledging success by 15%
21
Mytilus edulis mussels exposed to 100 particles/L PVC show 40% gill damage
22
Wild boars in Italian forests have microplastics in 58% fecal samples, averaging 12 pieces per gram
23
Pufferfish in Japanese coastal waters ingest 2.9 microplastic particles per gut on average
24
Nematodes in microplastic soils show 22% reduced fertility
25
Great skua chicks have 90% microplastic prevalence, correlating with parental provisioning changes
26
Blue mussels in the Baltic Sea accumulate 0.36 particles/g tissue, impairing byssus production by 28%
27
Fish from English Channel have microplastics reducing swimming performance by 18%
Interpretation
Wildlife Impacts Interpretation
Every creature from the seabass to the seabird is on a plastic diet now, and the grim review is in: across the board it's stunting growth, killing fertility, and slowly turning thriving life into a collection of diminished statistics.
Reference
Cite This Report
This report is designed to be cited. We maintain stable URLs and versioned verification dates. Copy the format appropriate for your publication below.
APA
Karl Becker. (2026, February 13). Microplastic Statistics. Gitnux. https://gitnux.org/microplastic-statistics
MLA
Karl Becker. "Microplastic Statistics." Gitnux, 13 Feb 2026, https://gitnux.org/microplastic-statistics.
Chicago
Karl Becker. 2026. "Microplastic Statistics." Gitnux. https://gitnux.org/microplastic-statistics.
Sources & references
34 datasets cited across this report · attribution is report-level