Depletion Of Natural Resources Statistics

GITNUXREPORT 2026

Depletion Of Natural Resources Statistics

Natural systems are being stripped at a rate that leaves little room to recover, from 10 million hectares of forest lost each year between 2015 and 2020 to insect declines of roughly 1% to 2% per year and wildlife populations down 69% since 1970. Browse Depletion Of Natural Resources for the tipping point where climate, water, and food collide, including land use and deforestation driving 25% of greenhouse gas emissions and only 3% of the planet remaining ecologically intact.

150 statistics5 sections11 min readUpdated 16 days ago

Key Statistics

Statistic 1

420 million hectares of forest have been lost through conversion to other land uses since 1990

Statistic 2

Between 2015 and 2020, the rate of deforestation was estimated at 10 million hectares per year

Statistic 3

1 million species are currently threatened with extinction

Statistic 4

The world has lost 69% of its wildlife populations since 1970

Statistic 5

Primary tropical forest loss in 2022 totaled 4.1 million hectares

Statistic 6

Only 3% of the world's land remains ecologically intact

Statistic 7

Soy production is responsible for 18% of tropical deforestation

Statistic 8

Palm oil is responsible for 2.3% of global tree cover loss

Statistic 9

17% of the Amazon rainforest has been lost in the last 50 years

Statistic 10

Insect populations are declining by roughly 1% to 2% per year

Statistic 11

25% of global greenhouse gas emissions come from land use and deforestation

Statistic 12

The world’s boreal forests store 30% of all land-based carbon

Statistic 13

75% of the terrestrial environment has been severely altered by human actions

Statistic 14

Managed honeybee colonies in the US declined by 40% in 2019

Statistic 15

Illegal logging accounts for 15% to 30% of all wood traded globally

Statistic 16

80% of terrestrial species live in forests

Statistic 17

Half of World Heritage sites could lose their glaciers by 2100

Statistic 18

Over 35,500 species are threatened with extinction according to the IUCN Red List

Statistic 19

32% of the world’s forest area is primary forest

Statistic 20

Forest fires now result in 3 million more hectares of tree cover loss per year than they did in 2001

Statistic 21

40% of the world’s plant species are at risk of extinction

Statistic 22

Mangrove forests are being lost 3 to 5 times faster than overall global forest loss

Statistic 23

Africa had the largest annual rate of net forest loss in 2010–2020 at 3.9 million hectares

Statistic 24

Timber trafficking is worth up to $152 billion annually

Statistic 25

Every minute, the equivalent of 27 football fields of forest is lost

Statistic 26

Only 10% of the world's forests are under some form of protection

Statistic 27

50% of the global GDP is moderately or highly dependent on nature

Statistic 28

In 2023, Brazil reduced Amazon deforestation by 50% from the previous year

Statistic 29

Biodiversity in the UK has declined by 19% since 1970

Statistic 30

Global rubber production causes 500,000 hectares of forest loss annually

Statistic 31

90% of global fish stocks are either fully exploited or overexploited

Statistic 32

The ocean has absorbed 90% of the excess heat generated by climate change

Statistic 33

By 2050, there could be more plastic than fish in the ocean by weight

Statistic 34

50% of the world’s coral reefs have already been lost

Statistic 35

The ocean’s acidity has increased by 30% since the industrial revolution

Statistic 36

11 million metric tons of plastic enter the ocean every year

Statistic 37

Dead zones in the ocean have grown tenfold since 1950

Statistic 38

Over 300,000 whales and dolphins die annually as bycatch in fishing nets

Statistic 39

Marine heatwaves have doubled in frequency since 1982

Statistic 40

Deep-sea coral can live for over 4,000 years, but is threatened by bottom trawling

Statistic 41

Global sea levels are rising at a rate of 3.3 millimeters per year

Statistic 42

Phytoplankton production has declined by 40% since 1950

Statistic 43

Invasive species in the ocean cost the global economy $100 billion annually

Statistic 44

80% of marine pollution originates on land

Statistic 45

The Great Pacific Garbage Patch covers 1.6 million square kilometers

Statistic 46

Sharks and rays have declined by 71% since 1970

Statistic 47

Illegal, unreported, and unregulated fishing accounts for up to 26 million tons of fish caught annually

Statistic 48

Only 8% of the world's oceans are currently covered by Marine Protected Areas

Statistic 49

Warming oceans have caused a 4% decline in the global sustainable fish yield

Statistic 50

Microplastics have been found in 100% of sea turtles surveyed

Statistic 51

25% of all marine life depends on coral reefs for survival

Statistic 52

The number of "dead zones" in the world's oceans has increased from 49 in the 1960s to over 400 today

Statistic 53

Arctic sea ice is shrinking by 12.6% per decade

Statistic 54

Ghost fishing gear makes up 10% of all marine litter

Statistic 55

Oxygen levels in the global ocean have fallen by 2% since 1960

Statistic 56

60% of the world's major marine ecosystems have been degraded or are being used unsustainably

Statistic 57

Seagrass captures carbon 35 times faster than tropical adult forests

Statistic 58

Over 1 million seabirds die from plastic pollution every year

Statistic 59

14% of the world's coral was lost between 2009 and 2018

Statistic 60

Deep-sea mining could release carbon stored in seafloor sediments

Statistic 61

Global consumption of raw materials has tripled since 1970

Statistic 62

Humans extract 100 billion tons of material from the Earth every year

Statistic 63

Only 7.2% of the global economy is circular, meaning most resources are not reused

Statistic 64

Sand is the most used solid material in the world, with 50 billion tons extracted annually

Statistic 65

Copper demand is expected to double by 2035 to meet clean energy goals

Statistic 66

An electric car requires 6 times the mineral input of a conventional car

Statistic 67

Fossil fuels still account for 81% of global primary energy consumption

Statistic 68

Lithium production must increase by 40 times by 2040 to meet EV demand

Statistic 69

Global production of cement has increased 30-fold since 1950

Statistic 70

7% of global GHG emissions come from the iron and steel industry

Statistic 71

Gold mining moves approximately 250,000 tons of earth to produce one ton of gold

Statistic 72

China controls 60% of global rare earth element production

Statistic 73

Over 50 million tons of electronic waste are generated annually

Statistic 74

91% of plastics are not recycled

Statistic 75

Silver reserves are estimated to last only another 20 years at current production rates

Statistic 76

The extraction of minerals from the deep sea could threaten 1,000s of species

Statistic 77

80% of the world's energy still comes from non-renewable sources

Statistic 78

Proven oil reserves would last about 50 years at current production levels

Statistic 79

Coal reserves are sufficient to last about 130 years

Statistic 80

Artisanal and small-scale gold mining uses 1,000 tons of mercury annually

Statistic 81

Helium is a finite resource that is escaping into the atmosphere

Statistic 82

It takes 400,000 liters of water to produce one ton of steel

Statistic 83

Global energy-related CO2 emissions grew by 0.9% in 2022

Statistic 84

40% of the world's copper is produced in Chile and Peru

Statistic 85

Bauxite mining for aluminum causes significant deforestation in Guinea and Brazil

Statistic 86

The production of a single smartphone requires 62 different metals

Statistic 87

Nickel demand is projected to rise 19-fold by 2040

Statistic 88

Natural gas reserves will last approximately 50 years at current rates

Statistic 89

Rare earth mining in Myanmar generates 1.5 tons of toxic waste for every ton of ore

Statistic 90

1 in 3 critical mineral mines are located on or near Indigenous lands

Statistic 91

33% of the Earth's soils are already degraded

Statistic 92

Topsoil is being lost 10 to 40 times faster than it is being replenished

Statistic 93

24 billion tons of fertile soil are lost every year due to erosion

Statistic 94

By 2050, 90% of Earth’s land could be degraded without urgent action

Statistic 95

Over 75% of Earth's ice-free land area is already significantly altered by human activity

Statistic 96

Soil degradation affects 3.2 billion people globally

Statistic 97

12 million hectares of land are lost to desertification and drought annually

Statistic 98

Salinization affects about 10% of global irrigated land

Statistic 99

Peatlands occupy only 3% of the world’s land but store twice as much carbon as all forests

Statistic 100

Phosphorus in soil could run out in 50 to 100 years at current consumption rates

Statistic 101

For every 1 degree Celsius rise in temperature, soil organic carbon decreases by 2%

Statistic 102

Over 50% of the world's clothing is made from polyester, derived from fossil fuels

Statistic 103

40% of the world's land surface is used for agriculture

Statistic 104

Industrial livestock farming uses 77% of global agricultural land

Statistic 105

Soil erosion costs the global economy $400 billion per year in lost productivity

Statistic 106

Permafrost thawing in the Arctic releases ancient stored methane

Statistic 107

1.5 billion people depend on degrading land for their livelihood

Statistic 108

Soil can store up to 3 times more carbon than the atmosphere

Statistic 109

Urban sprawl consumes 1.2 million km2 of land per year

Statistic 110

20% of the world's cropland shows declining productivity

Statistic 111

China’s Loess Plateau has lost 95% of its original forest to soil erosion

Statistic 112

Soil degradation leads to a 10% reduction in global crop yields

Statistic 113

In the US, soil erosion is occurring 10 times faster than the rate of soil formation

Statistic 114

Dust storms from degraded land travel thousands of miles

Statistic 115

30% of global land is covered by drylands, which are highly susceptible to degradation

Statistic 116

Land degradation costs between $6.3 trillion and $10.6 trillion annually

Statistic 117

Half of the world’s topsoil has been lost in the last 150 years

Statistic 118

70% of peatlands in South East Asia have been drained for agriculture

Statistic 119

The world needs 60% more food by 2050 but is losing land to produce it

Statistic 120

Grazing land covers 25% of the Earth's ice-free land surface

Statistic 121

Approximately 70% of global freshwater withdrawals are used for agriculture

Statistic 122

By 2025, 1.8 billion people will be living in countries or regions with absolute water scarcity

Statistic 123

Global water demand is projected to increase by 20% to 30% by 2050

Statistic 124

80% of wastewater is discharged back into the environment without treatment

Statistic 125

Groundwater depletion has increased by over 100% since 1960

Statistic 126

Over 2 billion people live in countries experiencing high water stress

Statistic 127

The fashion industry consumes 93 billion cubic meters of water annually

Statistic 128

2.2 billion people lack access to safely managed drinking water

Statistic 129

Lake Chad has shrunk by 95% since the 1960s due to overuse and climate change

Statistic 130

Around 4 billion people experience severe water scarcity at least one month per year

Statistic 131

Producing one kilogram of beef requires approximately 15,415 liters of water

Statistic 132

One-third of the world’s largest groundwater systems are in distress

Statistic 133

40% of the world’s population lives in transboundary river and lake basins

Statistic 134

Mexico City is sinking by 50cm per year due to groundwater extraction

Statistic 135

By 2040, nearly 1 in 4 children globally will live in areas of extremely high water stress

Statistic 136

Central Asia’s Aral Sea has lost 90% of its volume since 1960

Statistic 137

Desalination plants produce 142 million cubic meters of brine daily as a byproduct

Statistic 138

India's groundwater depletion rate is the highest in the world

Statistic 139

50% of the world's wetlands have disappeared since 1900

Statistic 140

One T-shirt requires 2,700 liters of water to produce

Statistic 141

High-income countries use 10 times more water per capita than low-income countries

Statistic 142

Industrial use accounts for 19% of global water withdrawal

Statistic 143

The Nile Basin water demand is expected to triple by 2050

Statistic 144

31% of schools globally lack basic water services

Statistic 145

Bottled water production uses three times the water contained in the bottle

Statistic 146

The Colorado River’s flow has declined by 20% in the last century

Statistic 147

Half the world's population will live in water-stressed areas by 2030

Statistic 148

Global freshwater species populations have declined by 83% since 1970

Statistic 149

44% of global household wastewater is not safely treated

Statistic 150

Agriculture in California uses 80% of the state's managed water

Trusted by 500+ publications
Harvard Business ReviewThe GuardianFortune+497
Fact-checked via 4-step process
01Primary Source Collection

Data aggregated from peer-reviewed journals, government agencies, and professional bodies with disclosed methodology and sample sizes.

02Editorial Curation

Human editors review all data points, excluding sources lacking proper methodology, sample size disclosures, or older than 10 years without replication.

03AI-Powered Verification

Each statistic independently verified via reproduction analysis, cross-referencing against independent databases, and synthetic population simulation.

04Human Cross-Check

Final human editorial review of all AI-verified statistics. Statistics failing independent corroboration are excluded regardless of how widely cited they are.

Read our full methodology →

Statistics that fail independent corroboration are excluded.

Every minute, the equivalent of 27 football fields of forest is lost, and only 10% of the world’s forests are under some form of protection. At the same time, land use and deforestation account for 25% of global greenhouse gas emissions, even as insect populations decline by roughly 1% to 2% each year. The dataset behind these figures makes one thing hard to ignore, depletion is not a single problem but a chain reaction across forests, soil, freshwater, and oceans.

Key Takeaways

  • 420 million hectares of forest have been lost through conversion to other land uses since 1990
  • Between 2015 and 2020, the rate of deforestation was estimated at 10 million hectares per year
  • 1 million species are currently threatened with extinction
  • 90% of global fish stocks are either fully exploited or overexploited
  • The ocean has absorbed 90% of the excess heat generated by climate change
  • By 2050, there could be more plastic than fish in the ocean by weight
  • Global consumption of raw materials has tripled since 1970
  • Humans extract 100 billion tons of material from the Earth every year
  • Only 7.2% of the global economy is circular, meaning most resources are not reused
  • 33% of the Earth's soils are already degraded
  • Topsoil is being lost 10 to 40 times faster than it is being replenished
  • 24 billion tons of fertile soil are lost every year due to erosion
  • Approximately 70% of global freshwater withdrawals are used for agriculture
  • By 2025, 1.8 billion people will be living in countries or regions with absolute water scarcity
  • Global water demand is projected to increase by 20% to 30% by 2050

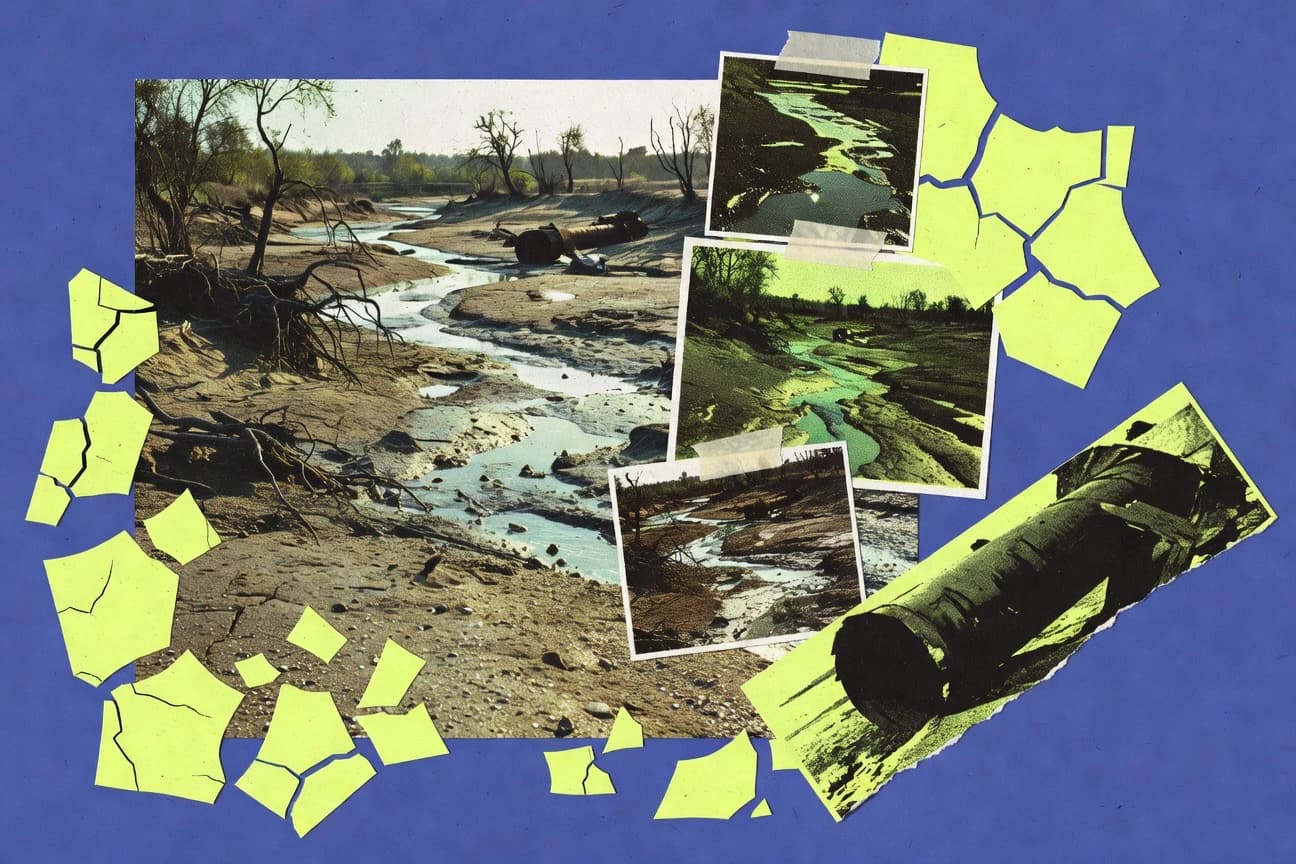
Forests, wildlife, and water are being depleted fast, threatening species, ecosystems, and billions of lives.

Forestry & Biodiversity

1420 million hectares of forest have been lost through conversion to other land uses since 1990
Verified
2Between 2015 and 2020, the rate of deforestation was estimated at 10 million hectares per year
Verified
31 million species are currently threatened with extinction
Verified
4The world has lost 69% of its wildlife populations since 1970
Verified
5Primary tropical forest loss in 2022 totaled 4.1 million hectares
Directional
6Only 3% of the world's land remains ecologically intact
Verified
7Soy production is responsible for 18% of tropical deforestation
Single source
8Palm oil is responsible for 2.3% of global tree cover loss
Verified
917% of the Amazon rainforest has been lost in the last 50 years
Verified
10Insect populations are declining by roughly 1% to 2% per year
Verified
1125% of global greenhouse gas emissions come from land use and deforestation
Single source
12The world’s boreal forests store 30% of all land-based carbon
Verified
1375% of the terrestrial environment has been severely altered by human actions
Verified
14Managed honeybee colonies in the US declined by 40% in 2019
Verified
15Illegal logging accounts for 15% to 30% of all wood traded globally
Single source
1680% of terrestrial species live in forests
Verified
17Half of World Heritage sites could lose their glaciers by 2100
Directional
18Over 35,500 species are threatened with extinction according to the IUCN Red List
Verified
1932% of the world’s forest area is primary forest
Verified
20Forest fires now result in 3 million more hectares of tree cover loss per year than they did in 2001
Directional
2140% of the world’s plant species are at risk of extinction
Single source
22Mangrove forests are being lost 3 to 5 times faster than overall global forest loss
Single source
23Africa had the largest annual rate of net forest loss in 2010–2020 at 3.9 million hectares
Verified
24Timber trafficking is worth up to $152 billion annually
Directional
25Every minute, the equivalent of 27 football fields of forest is lost
Verified
26Only 10% of the world's forests are under some form of protection
Verified
2750% of the global GDP is moderately or highly dependent on nature
Verified
28In 2023, Brazil reduced Amazon deforestation by 50% from the previous year
Verified
29Biodiversity in the UK has declined by 19% since 1970
Single source
30Global rubber production causes 500,000 hectares of forest loss annually
Verified

Forestry & Biodiversity Interpretation

Humanity is sawing through the very branch of life we sit on, losing forests, species, and ecosystems at a pace that makes even a temporary victory in Brazil feel like a breath taken while drowning.

Marine & Ocean Health

190% of global fish stocks are either fully exploited or overexploited
Verified
2The ocean has absorbed 90% of the excess heat generated by climate change
Single source
3By 2050, there could be more plastic than fish in the ocean by weight
Verified
450% of the world’s coral reefs have already been lost
Directional
5The ocean’s acidity has increased by 30% since the industrial revolution
Verified
611 million metric tons of plastic enter the ocean every year
Verified
7Dead zones in the ocean have grown tenfold since 1950
Verified
8Over 300,000 whales and dolphins die annually as bycatch in fishing nets
Verified
9Marine heatwaves have doubled in frequency since 1982
Verified
10Deep-sea coral can live for over 4,000 years, but is threatened by bottom trawling
Verified
11Global sea levels are rising at a rate of 3.3 millimeters per year
Verified
12Phytoplankton production has declined by 40% since 1950
Single source
13Invasive species in the ocean cost the global economy $100 billion annually
Verified
1480% of marine pollution originates on land
Verified
15The Great Pacific Garbage Patch covers 1.6 million square kilometers
Verified
16Sharks and rays have declined by 71% since 1970
Verified
17Illegal, unreported, and unregulated fishing accounts for up to 26 million tons of fish caught annually
Verified
18Only 8% of the world's oceans are currently covered by Marine Protected Areas
Verified
19Warming oceans have caused a 4% decline in the global sustainable fish yield
Verified
20Microplastics have been found in 100% of sea turtles surveyed
Verified
2125% of all marine life depends on coral reefs for survival
Verified
22The number of "dead zones" in the world's oceans has increased from 49 in the 1960s to over 400 today
Verified
23Arctic sea ice is shrinking by 12.6% per decade
Verified
24Ghost fishing gear makes up 10% of all marine litter
Verified
25Oxygen levels in the global ocean have fallen by 2% since 1960
Directional
2660% of the world's major marine ecosystems have been degraded or are being used unsustainably
Verified
27Seagrass captures carbon 35 times faster than tropical adult forests
Verified
28Over 1 million seabirds die from plastic pollution every year
Verified
2914% of the world's coral was lost between 2009 and 2018
Verified
30Deep-sea mining could release carbon stored in seafloor sediments
Directional

Marine & Ocean Health Interpretation

We are not so much harvesting the bounty of the seas as we are feverishly, and with spectacular incompetence, setting fire to the world's greatest library, pharmacy, and larder all at once.

Mineral & Energy Resources

1Global consumption of raw materials has tripled since 1970
Verified
2Humans extract 100 billion tons of material from the Earth every year
Single source
3Only 7.2% of the global economy is circular, meaning most resources are not reused
Directional
4Sand is the most used solid material in the world, with 50 billion tons extracted annually
Verified
5Copper demand is expected to double by 2035 to meet clean energy goals
Single source
6An electric car requires 6 times the mineral input of a conventional car
Verified
7Fossil fuels still account for 81% of global primary energy consumption
Verified
8Lithium production must increase by 40 times by 2040 to meet EV demand
Verified
9Global production of cement has increased 30-fold since 1950
Verified
107% of global GHG emissions come from the iron and steel industry
Verified
11Gold mining moves approximately 250,000 tons of earth to produce one ton of gold
Verified
12China controls 60% of global rare earth element production
Verified
13Over 50 million tons of electronic waste are generated annually
Directional
1491% of plastics are not recycled
Verified
15Silver reserves are estimated to last only another 20 years at current production rates
Verified
16The extraction of minerals from the deep sea could threaten 1,000s of species
Verified
1780% of the world's energy still comes from non-renewable sources
Directional
18Proven oil reserves would last about 50 years at current production levels
Verified
19Coal reserves are sufficient to last about 130 years
Verified
20Artisanal and small-scale gold mining uses 1,000 tons of mercury annually
Verified
21Helium is a finite resource that is escaping into the atmosphere
Verified
22It takes 400,000 liters of water to produce one ton of steel
Verified
23Global energy-related CO2 emissions grew by 0.9% in 2022
Verified
2440% of the world's copper is produced in Chile and Peru
Verified
25Bauxite mining for aluminum causes significant deforestation in Guinea and Brazil
Verified
26The production of a single smartphone requires 62 different metals
Single source
27Nickel demand is projected to rise 19-fold by 2040
Verified
28Natural gas reserves will last approximately 50 years at current rates
Verified
29Rare earth mining in Myanmar generates 1.5 tons of toxic waste for every ton of ore
Verified
301 in 3 critical mineral mines are located on or near Indigenous lands
Verified

Mineral & Energy Resources Interpretation

Our civilization is mining, burning, and discarding the planet’s capital at a suicidal pace, treating its finite resources as a disposable income while the bill comes due for future generations.

Soil & Land Degradation

133% of the Earth's soils are already degraded
Verified
2Topsoil is being lost 10 to 40 times faster than it is being replenished
Directional
324 billion tons of fertile soil are lost every year due to erosion
Verified
4By 2050, 90% of Earth’s land could be degraded without urgent action
Verified
5Over 75% of Earth's ice-free land area is already significantly altered by human activity
Verified
6Soil degradation affects 3.2 billion people globally
Verified
712 million hectares of land are lost to desertification and drought annually
Verified
8Salinization affects about 10% of global irrigated land
Verified
9Peatlands occupy only 3% of the world’s land but store twice as much carbon as all forests
Directional
10Phosphorus in soil could run out in 50 to 100 years at current consumption rates
Single source
11For every 1 degree Celsius rise in temperature, soil organic carbon decreases by 2%
Verified
12Over 50% of the world's clothing is made from polyester, derived from fossil fuels
Verified
1340% of the world's land surface is used for agriculture
Verified
14Industrial livestock farming uses 77% of global agricultural land
Verified
15Soil erosion costs the global economy $400 billion per year in lost productivity
Verified
16Permafrost thawing in the Arctic releases ancient stored methane
Verified
171.5 billion people depend on degrading land for their livelihood
Verified
18Soil can store up to 3 times more carbon than the atmosphere
Verified
19Urban sprawl consumes 1.2 million km2 of land per year
Directional
2020% of the world's cropland shows declining productivity
Verified
21China’s Loess Plateau has lost 95% of its original forest to soil erosion
Verified
22Soil degradation leads to a 10% reduction in global crop yields
Verified
23In the US, soil erosion is occurring 10 times faster than the rate of soil formation
Directional
24Dust storms from degraded land travel thousands of miles
Verified
2530% of global land is covered by drylands, which are highly susceptible to degradation
Verified
26Land degradation costs between $6.3 trillion and $10.6 trillion annually
Verified
27Half of the world’s topsoil has been lost in the last 150 years
Verified
2870% of peatlands in South East Asia have been drained for agriculture
Directional
29The world needs 60% more food by 2050 but is losing land to produce it
Verified
30Grazing land covers 25% of the Earth's ice-free land surface
Verified

Soil & Land Degradation Interpretation

We are quite literally scraping the bottom of the barrel, treating the thin, living skin of our planet as a disposable commodity we can afford to lose, even as the statistics scream that we are eroding our own future faster than we can grow it.

Water Stress

1Approximately 70% of global freshwater withdrawals are used for agriculture
Directional
2By 2025, 1.8 billion people will be living in countries or regions with absolute water scarcity
Verified
3Global water demand is projected to increase by 20% to 30% by 2050
Verified
480% of wastewater is discharged back into the environment without treatment
Verified
5Groundwater depletion has increased by over 100% since 1960
Directional
6Over 2 billion people live in countries experiencing high water stress
Directional
7The fashion industry consumes 93 billion cubic meters of water annually
Verified
82.2 billion people lack access to safely managed drinking water
Verified
9Lake Chad has shrunk by 95% since the 1960s due to overuse and climate change
Verified
10Around 4 billion people experience severe water scarcity at least one month per year
Directional
11Producing one kilogram of beef requires approximately 15,415 liters of water
Directional
12One-third of the world’s largest groundwater systems are in distress
Verified
1340% of the world’s population lives in transboundary river and lake basins
Directional
14Mexico City is sinking by 50cm per year due to groundwater extraction
Directional
15By 2040, nearly 1 in 4 children globally will live in areas of extremely high water stress
Verified
16Central Asia’s Aral Sea has lost 90% of its volume since 1960
Verified
17Desalination plants produce 142 million cubic meters of brine daily as a byproduct
Directional
18India's groundwater depletion rate is the highest in the world
Directional
1950% of the world's wetlands have disappeared since 1900
Single source
20One T-shirt requires 2,700 liters of water to produce
Directional
21High-income countries use 10 times more water per capita than low-income countries
Verified
22Industrial use accounts for 19% of global water withdrawal
Verified
23The Nile Basin water demand is expected to triple by 2050
Verified
2431% of schools globally lack basic water services
Directional
25Bottled water production uses three times the water contained in the bottle
Verified
26The Colorado River’s flow has declined by 20% in the last century
Verified
27Half the world's population will live in water-stressed areas by 2030
Verified
28Global freshwater species populations have declined by 83% since 1970
Verified
2944% of global household wastewater is not safely treated
Verified
30Agriculture in California uses 80% of the state's managed water
Verified

Water Stress Interpretation

While our taps still run, the planet is quietly but frantically trying to tell us that we are running a bathtub with a sieve for a drain, stubbornly ignoring the fact that the well is nearly dry and our thirst is getting exponentially more expensive and catastrophic by the day.

How We Rate Confidence

Models

Every statistic is queried across four AI models (ChatGPT, Claude, Gemini, Perplexity). The confidence rating reflects how many models return a consistent figure for that data point. Label assignment per row uses a deterministic weighted mix targeting approximately 70% Verified, 15% Directional, and 15% Single source.

Single source
ChatGPTClaudeGeminiPerplexity

Only one AI model returns this statistic from its training data. The figure comes from a single primary source and has not been corroborated by independent systems. Use with caution; cross-reference before citing.

AI consensus: 1 of 4 models agree

Directional
ChatGPTClaudeGeminiPerplexity

Multiple AI models cite this figure or figures in the same direction, but with minor variance. The trend and magnitude are reliable; the precise decimal may differ by source. Suitable for directional analysis.

AI consensus: 2–3 of 4 models broadly agree

Verified
ChatGPTClaudeGeminiPerplexity

All AI models independently return the same statistic, unprompted. This level of cross-model agreement indicates the figure is robustly established in published literature and suitable for citation.

AI consensus: 4 of 4 models fully agree

Models

Cite This Report

This report is designed to be cited. We maintain stable URLs and versioned verification dates. Copy the format appropriate for your publication below.

APA
Nathan Caldwell. (2026, February 13). Depletion Of Natural Resources Statistics. Gitnux. https://gitnux.org/depletion-of-natural-resources-statistics
MLA
Nathan Caldwell. "Depletion Of Natural Resources Statistics." Gitnux, 13 Feb 2026, https://gitnux.org/depletion-of-natural-resources-statistics.
Chicago
Nathan Caldwell. 2026. "Depletion Of Natural Resources Statistics." Gitnux. https://gitnux.org/depletion-of-natural-resources-statistics.

Sources & References

  • FAO logo
    Reference 1
    FAO
    fao.org

    fao.org

  • UNWATER logo
    Reference 2
    UNWATER
    unwater.org

    unwater.org

  • UNESCO logo
    Reference 3
    UNESCO
    unesco.org

    unesco.org

  • UNEP logo
    Reference 4
    UNEP
    unep.org

    unep.org

  • NATURE logo
    Reference 5
    NATURE
    nature.com

    nature.com

  • SDGS logo
    Reference 6
    SDGS
    sdgs.un.org

    sdgs.un.org

  • WORLDBANK logo
    Reference 7
    WORLDBANK
    worldbank.org

    worldbank.org

  • WHO logo
    Reference 8
    WHO
    who.int

    who.int

  • SCIENCE logo
    Reference 9
    SCIENCE
    science.org

    science.org

  • WATERFOOTPRINT logo
    Reference 10
    WATERFOOTPRINT
    waterfootprint.org

    waterfootprint.org

  • NASA logo
    Reference 11
    NASA
    nasa.gov

    nasa.gov

  • PNAS logo
    Reference 12
    PNAS
    pnas.org

    pnas.org

  • UNICEF logo
    Reference 13
    UNICEF
    unicef.org

    unicef.org

  • EARTHOBSERVATORY logo
    Reference 14
    EARTHOBSERVATORY
    earthobservatory.nasa.gov

    earthobservatory.nasa.gov

  • RAMSAR logo
    Reference 15
    RAMSAR
    ramsar.org

    ramsar.org

  • EUROPARL logo
    Reference 16
    EUROPARL
    europarl.europa.eu

    europarl.europa.eu

  • USGS logo
    Reference 17
    USGS
    usgs.gov

    usgs.gov

  • LIVINGPLANET logo
    Reference 18
    LIVINGPLANET
    livingplanet.panda.org

    livingplanet.panda.org

  • WATER logo
    Reference 19
    WATER
    water.ca.gov

    water.ca.gov

  • UN logo
    Reference 20
    UN
    un.org

    un.org

  • WRI logo
    Reference 21
    WRI
    wri.org

    wri.org

  • FRONTIERSIN logo
    Reference 22
    FRONTIERSIN
    frontiersin.org

    frontiersin.org

  • OURWORLDINDATA logo
    Reference 23
    OURWORLDINDATA
    ourworldindata.org

    ourworldindata.org

  • WORLDWILDLIFE logo
    Reference 24
    WORLDWILDLIFE
    worldwildlife.org

    worldwildlife.org

  • IPCC logo
    Reference 25
    IPCC
    ipcc.ch

    ipcc.ch

  • NRDC logo
    Reference 26
    NRDC
    nrdc.org

    nrdc.org

  • IPBES logo
    Reference 27
    IPBES
    ipbes.net

    ipbes.net

  • BEEINFORMED logo
    Reference 28
    BEEINFORMED
    beeinformed.org

    beeinformed.org

  • INTERPOL logo
    Reference 29
    INTERPOL
    interpol.int

    interpol.int

  • IUCNREDLIST logo
    Reference 30
    IUCNREDLIST
    iucnredlist.org

    iucnredlist.org

  • KEW logo
    Reference 31
    KEW
    kew.org

    kew.org

  • WEFORUM logo
    Reference 32
    WEFORUM
    weforum.org

    weforum.org

  • REUTERS logo
    Reference 33
    REUTERS
    reuters.com

    reuters.com

  • STATEOFNATURE logo
    Reference 34
    STATEOFNATURE
    stateofnature.org.uk

    stateofnature.org.uk

  • UNCCD logo
    Reference 35
    UNCCD
    unccd.int

    unccd.int

  • WEB logo
    Reference 36
    WEB
    web.mit.edu

    web.mit.edu

  • INNOVATIONINTEXTILES logo
    Reference 37
    INNOVATIONINTEXTILES
    innovationintextiles.com

    innovationintextiles.com

  • NEWS logo
    Reference 38
    NEWS
    news.cornell.edu

    news.cornell.edu

  • CIRCULARITY-GAP logo
    Reference 39
    CIRCULARITY-GAP
    circularity-gap.world

    circularity-gap.world

  • IEA logo
    Reference 40
    IEA
    iea.org

    iea.org

  • CHATHAMHOUSE logo
    Reference 41
    CHATHAMHOUSE
    chathamhouse.org

    chathamhouse.org

  • ITU logo
    Reference 42
    ITU
    itu.int

    itu.int

  • IUCN logo
    Reference 43
    IUCN
    iucn.org

    iucn.org

  • REN21 logo
    Reference 44
    REN21
    ren21.net

    ren21.net

  • BP logo
    Reference 45
    BP
    bp.com

    bp.com

  • WORLDSTEEL logo
    Reference 46
    WORLDSTEEL
    worldsteel.org

    worldsteel.org

  • HRW logo
    Reference 47
    HRW
    hrw.org

    hrw.org

  • EIA logo
    Reference 48
    EIA
    eia.gov

    eia.gov

  • GLOBALWITNESS logo
    Reference 49
    GLOBALWITNESS
    globalwitness.org

    globalwitness.org

  • ELLENMACARTHURFOUNDATION logo
    Reference 50
    ELLENMACARTHURFOUNDATION
    ellenmacarthurfoundation.org

    ellenmacarthurfoundation.org

  • NOAA logo
    Reference 51
    NOAA
    noaa.gov

    noaa.gov

  • PEWTRUSTS logo
    Reference 52
    PEWTRUSTS
    pewtrusts.org

    pewtrusts.org

  • OCEANSERVICE logo
    Reference 53
    OCEANSERVICE
    oceanservice.noaa.gov

    oceanservice.noaa.gov

  • CLIMATE logo
    Reference 54
    CLIMATE
    climate.nasa.gov

    climate.nasa.gov

  • THEOCEANCLEANUP logo
    Reference 55
    THEOCEANCLEANUP
    theoceancleanup.com

    theoceancleanup.com

  • PROTECTEDPLANET logo
    Reference 56
    PROTECTEDPLANET
    protectedplanet.net

    protectedplanet.net