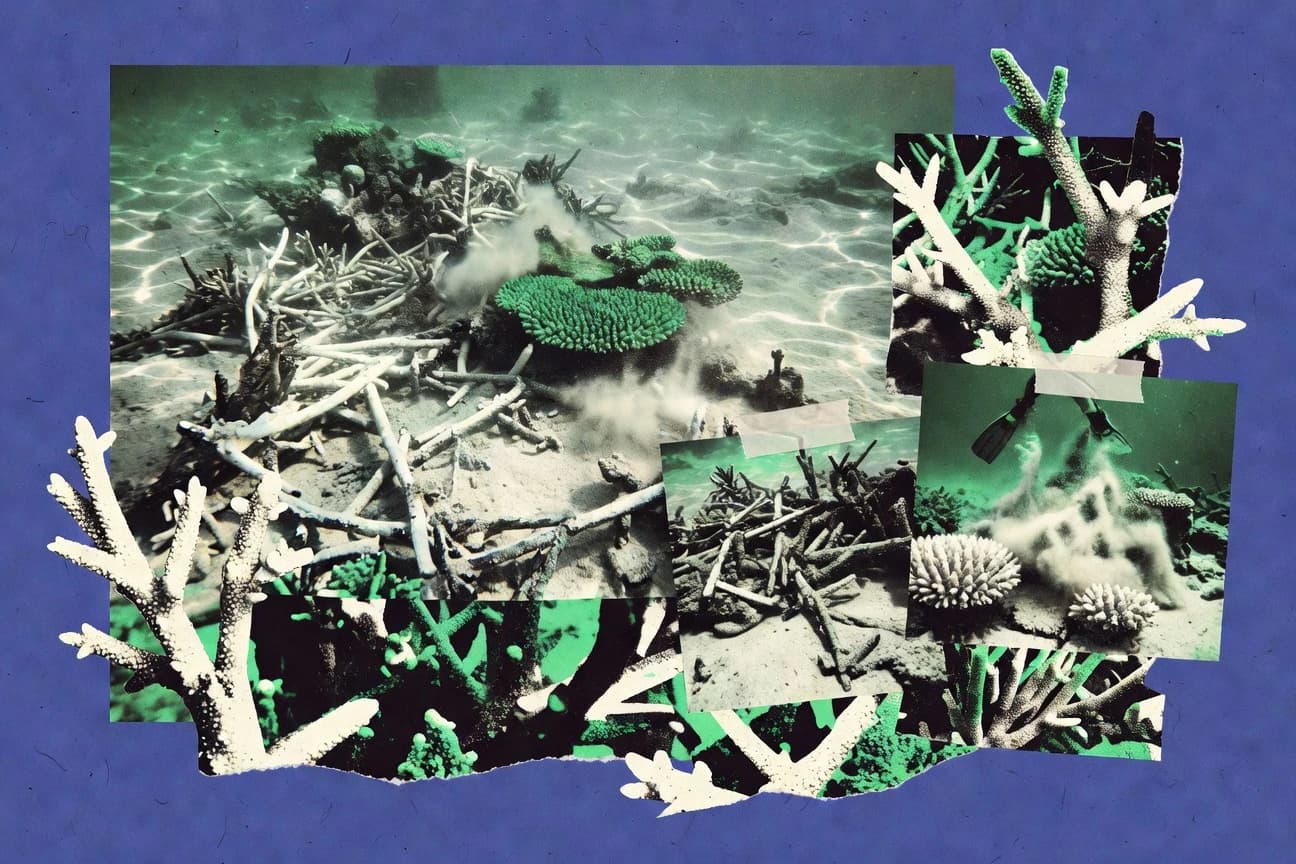

Human activities have degraded 84 percent of the world’s coral reef area through overfishing, pollution, and development. Warming has placed 75 percent of reefs under threat, with risks rising sharply once global mean temperatures reach 1.6 degrees Celsius. These pressures have already produced mass bleaching in 41 percent of reefs and now threaten over 400 coral species plus at least 1,000 reef-associated fish.
Key Takeaways
- 75% of the world’s coral reefs are estimated to be threatened by climate change and other human activities
- 1.6°C is the approximate global mean warming threshold above which coral reefs face substantially elevated long-term risks
- Between 1998 and 2017, mass bleaching events occurred in 41% of reefs globally (as summarized by a global inventory study)
- The IPCC AR6 assesses that coral reefs are particularly vulnerable to heatwaves and that 1.5°C will expose most reefs to frequent severe bleaching
- 45% of reef-building coral species assessed are expected to decline substantially under ongoing warming scenarios in a large-scale modeling synthesis
- Over 400 coral reef species are listed under CITES Appendices for protection, reflecting high conservation concern across taxa associated with reefs
- At least 1,000 species of reef-associated fish are estimated to be at risk if reefs continue to decline
- 84% of the world’s coral reef area has been degraded by human impacts (e.g., overfishing, pollution, and development) based on a global synthesis of reef status
- 80% of reef areas receiving runoff exceed ecological thresholds for at least one land-based stressor (nutrients, sediment, or pollution) in a global modeling study
- Approximately 60% of coral reef regions are within 100 km of river basins experiencing substantial nutrient and sediment export (global land-ocean assessment)
- NOAA reports that the 2023 Caribbean and Atlantic marine heatwave contributed to elevated Degree Heating Weeks and bleaching risk outlooks for coral regions
- Between 1990 and 2020, global warming has increased the frequency and intensity of marine heatwaves that drive coral bleaching (NOAA climate report metrics on ocean heat content and marine heatwaves)
- The International Coral Reef Initiative (ICRI) launched in 2008 coordinates reef conservation; it operates with country commitments including targets for reducing threats
- In the Caribbean, reefs suffered major coral loss; one widely cited assessment estimated that live coral cover dropped by ~80% since the 1970s/1980s
- Between 2008 and 2018, the Great Barrier Reef experienced multiple mass bleaching events, with severe impacts observed in several summers; 2016 and 2017 showed large-scale losses in surveys
Most coral reefs are already degraded and face escalating heat stress, with heavy risks to biodiversity and coastal livelihoods.
Related reading
01 · Category
Reef Extent2 stats
01
75% of the world’s coral reefs are estimated to be threatened by climate change and other human activitieshttps://science.sciencemag.org/content/359/6374/78
02
1.6°C is the approximate global mean warming threshold above which coral reefs face substantially elevated long-term riskshttps://www.ipcc.ch/srccl/chapter/summary-for-policymakers/
Interpretation
Reef Extent Interpretation
From the Reef Extent perspective, about 75% of the world’s coral reefs are already estimated to be threatened by climate change and human activities, and the risk sharply rises once global warming reaches around 1.6°C.
02 · Category
Heat & Bleaching4 stats
01
Between 1998 and 2017, mass bleaching events occurred in 41% of reefs globally (as summarized by a global inventory study)https://www.pnas.org/doi/10.1073/pnas.2010600117
02
The IPCC AR6 assesses that coral reefs are particularly vulnerable to heatwaves and that 1.5°C will expose most reefs to frequent severe bleachinghttps://www.ipcc.ch/report/ar6/wg1/chapter/chapter-5/
03
45% of reef-building coral species assessed are expected to decline substantially under ongoing warming scenarios in a large-scale modeling synthesishttps://science.org/doi/10.1126/science.1207714
04
Coral reef thermal stress exposures are projected to increase substantially; one global study projected that by 2100, most reefs will experience severe heat stress more than once per decade under high-emission scenarioshttps://www.nature.com/articles/ncomms12768
Interpretation
Heat & Bleaching Interpretation
Heat and bleaching are driving widespread reef loss, with mass bleaching affecting 41% of reefs globally between 1998 and 2017 and projections showing that under ongoing warming scenarios up to 45% of reef building coral species are expected to decline substantially.
03 · Category
Biodiversity Loss2 stats
01
Over 400 coral reef species are listed under CITES Appendices for protection, reflecting high conservation concern across taxa associated with reefshttps://cites.org/sites/default/files/2022-11/CoP19_Inf-xx.pdf
02
At least 1,000 species of reef-associated fish are estimated to be at risk if reefs continue to declinehttps://www.pnas.org/doi/10.1073/pnas.1710839115
Interpretation
Biodiversity Loss Interpretation
The Biodiversity Loss angle is starkly clear because over 400 coral reef species are on CITES Appendices and at least 1,000 reef-associated fish species could be at risk as reefs keep declining.
04 · Category
Human Drivers3 stats
01
84% of the world’s coral reef area has been degraded by human impacts (e.g., overfishing, pollution, and development) based on a global synthesis of reef statushttps://www.cell.com/oneearth/fulltext/S2590-3322(20)30209-7
02
80% of reef areas receiving runoff exceed ecological thresholds for at least one land-based stressor (nutrients, sediment, or pollution) in a global modeling studyhttps://www.science.org/doi/10.1126/science.aal4023
03
Approximately 60% of coral reef regions are within 100 km of river basins experiencing substantial nutrient and sediment export (global land-ocean assessment)https://agupubs.onlinelibrary.wiley.com/doi/10.1029/2019GB006347
Interpretation
Human Drivers Interpretation
Human drivers are already devastating reefs at scale, with 84% of the world’s coral reef area degraded by human impacts and about 80% of reef areas receiving runoff exceeding ecological thresholds for at least one land-based stressor.
05 · Category
Policy & Monitoring5 stats
01
NOAA reports that the 2023 Caribbean and Atlantic marine heatwave contributed to elevated Degree Heating Weeks and bleaching risk outlooks for coral regionshttps://www.noaa.gov/news/2023-marine-heatwave-and-coral-reef-bleaching-impacts
02
Between 1990 and 2020, global warming has increased the frequency and intensity of marine heatwaves that drive coral bleaching (NOAA climate report metrics on ocean heat content and marine heatwaves)https://www.noaa.gov/news/marine-heatwaves
03
The International Coral Reef Initiative (ICRI) launched in 2008 coordinates reef conservation; it operates with country commitments including targets for reducing threatshttps://www.icriforum.org/icri/
04
The IPBES 2019 global assessment states that 14% of reefs are critically endangered and provides a quantified threat outlook for reef ecosystemshttps://ipbes.net/global-assessment
05
The Global Mangrove Alliance and Reef restoration funding: The IUCN report on coral restoration indicates that billions are required; it quantifies the scale of restoration efforts underwayhttps://portals.iucn.org/library/sites/library/files/documents/2021-011-En.pdf
Interpretation
Policy & Monitoring Interpretation
Policy and monitoring efforts need to match accelerating heatwave driven bleaching, since NOAA links marine heatwaves to higher Degree Heating Weeks and bleaching risk while the IPBES 2019 assessment shows 14% of reefs are critically endangered, signaling that existing conservation coordination and funding gaps are not keeping pace with the scale of the threat.
06 · Category
Recovery & Decline4 stats
01
In the Caribbean, reefs suffered major coral loss; one widely cited assessment estimated that live coral cover dropped by ~80% since the 1970s/1980shttps://www.science.org/doi/10.1126/science.1165953
02
Between 2008 and 2018, the Great Barrier Reef experienced multiple mass bleaching events, with severe impacts observed in several summers; 2016 and 2017 showed large-scale losses in surveyshttps://www.nature.com/articles/s41586-019-1609-1
03
In the central Pacific, coral cover declines of 20–50% have been documented in areas experiencing chronic stress and repeated bleaching according to observational trend datasetshttps://www.pnas.org/doi/10.1073/pnas.1901334116
04
Most reefs show limited capacity to recover if heat stress recurs within short intervals, with studies reporting reduced regrowth rates under frequent bleachinghttps://www.science.org/doi/10.1126/science.1207714
Interpretation
Recovery & Decline Interpretation
For the Recovery and Decline angle, the evidence shows coral recovery is struggling to keep up with repeated stress, as live coral cover in the Caribbean dropped by about 80% since the 19th century and the Great Barrier Reef endured multiple mass bleaching events from 2008 to 2018 alongside documented 20 to 50% coral declines in the central Pacific.
08 · Category
Environmental Drivers3 stats
01
25% of reef-building corals are threatened with extinction, indicating a high risk of coral population loss that undermines reef structurehttps://iucnredlist.org/resources/summary-statistics
02
58% of the global ocean is impacted by human activities, contributing to multiple stressors (e.g., pollution, overfishing, habitat alteration) that also affect coral reefshttps://www.nature.com/articles/s41467-020-17749-6
03
3.5°C of warming by 2100 is projected under a high-emissions scenario (SSP5-8.5), which implies severe and frequent heat stress well beyond levels that cause major mass bleachinghttps://www.ipcc.ch/report/ar6/wg1/
Interpretation
Environmental Drivers Interpretation
Environmental drivers are intensifying as 25% of reef-building corals face extinction risk while 58% of the global ocean is already affected by human activity and projected warming reaches 3.5°C by 2100, creating overlapping stress that can rapidly weaken reef ecosystems.
09 · Category
Impact Magnitude2 stats
01
0.4–0.7°C increases in sea-surface temperature anomalies during marine heatwaves can exceed thresholds for coral bleaching, based on observed distributions used to estimate bleaching likelihood in global analyseshttps://agupubs.onlinelibrary.wiley.com/doi/10.1029/2019GL082373
02
0.8°C–1.0°C of reef-appropriate seasonal warming can trigger widespread bleaching depending on local acclimatization, as summarized in a global synthesis of coral thermal stress thresholdshttps://www.sciencedirect.com/science/article/pii/S0169534721000707
Interpretation
Impact Magnitude Interpretation
Under the Impact Magnitude framing, marine heatwaves with just 0.4°C to 0.7°C above normal can push sea-surface temperatures past coral bleaching thresholds, and a slightly higher 0.8°C to 1.0°C of seasonal warming can drive widespread bleaching depending on how well local corals have acclimatized.
10 · Category
Economic Costs2 stats
01
$4.7 billion to $9.2 billion per year in coastal protection benefits is estimated for coral reefs globally, representing the economic value of wave attenuation that declines with reef degradationhttps://www.nature.com/articles/nature12759
02
0.3–0.5% of global gross domestic product (GDP) exposure to coastal hazards can be attributable to reefs in some global risk modeling frameworks when reef protection is removedhttps://www.pnas.org/doi/10.1073/pnas.1510515112
Interpretation
Economic Costs Interpretation
From an Economic Costs perspective, coral reefs are estimated to deliver $4.7 billion to $9.2 billion per year in coastal protection benefits worldwide, and in some global risk models 0.3 to 0.5% of GDP exposure to coastal hazards can be attributable to reefs, underscoring how their degradation would translate into sizable and measurable economic harm.
11 · Category
Biodiversity & Fisheries4 stats
01
21% of assessed reef-fish species are threatened in the IUCN Red List assessments compiled for reef biodiversity monitoring (threatened categories include Vulnerable, Endangered, and Critically Endangered)https://portals.iucn.org/library/node/50868
02
1.9 million metric tons of reef-associated reef fisheries production are estimated to be at risk globally under scenario-based reef decline pathways in a global fisheries modeling synthesishttps://www.fao.org/3/i5263e/i5263e.pdf
03
3,000 km² of coral reef habitat is estimated to have been lost in Indonesia from 1980–2000 based on national remote-sensing and change-detection studies summarized in peer-reviewed literaturehttps://www.sciencedirect.com/science/article/pii/S0048969718322990
04
2.6x higher juvenile fish mortality is observed on degraded reef habitat compared with healthy reef habitat in experimental/field comparisons summarized in reef ecology meta-analyseshttps://onlinelibrary.wiley.com/doi/10.1111/gcb.14790
Interpretation
Biodiversity & Fisheries Interpretation
For Biodiversity and Fisheries, the evidence shows a clear decline in reef health with 21% of assessed reef-fish species threatened and an estimated 1.9 million metric tons of reef-associated fisheries production at risk globally, while habitat loss in Indonesia (3,000 km² from 1980 to 2000) and higher juvenile fish mortality on degraded reefs (2.6 times) further threaten future fish stocks.
report visual · Comparison
Coral Reef Destruction: How Widespread It Is
A majority of reefs are threatened or degraded by human impacts, with major shares of reefs also experiencing mass bleaching and critical endangerment.
84% of the world’s coral reef area has been degraded by human impacts (e.g., overfishing, pollution, and development) ba84%
75% of the world’s coral reefs are estimated to be threatened by climate change and other human activities
75%
Between 1998 and 2017, mass bleaching events occurred in 41% of reefs globally (as summarized by a global inventory stud
41%
The IPBES 2019 global assessment states that 14% of reefs are critically endangered and provides a quantified threat out
14%
source-verifiedscience.sciencemag.org · cell.com · pnas.org · ipbes.net2019
Reference
Cite This Report
This report is designed to be cited. We maintain stable URLs and versioned verification dates. Copy the format appropriate for your publication below.
APA
David Kowalski. (2026, February 13). Coral Reef Destruction Statistics. Gitnux. https://gitnux.org/coral-reef-destruction-statistics
MLA
David Kowalski. "Coral Reef Destruction Statistics." Gitnux, 13 Feb 2026, https://gitnux.org/coral-reef-destruction-statistics.
Chicago
David Kowalski. 2026. "Coral Reef Destruction Statistics." Gitnux. https://gitnux.org/coral-reef-destruction-statistics.
Sources & references
35 datasets cited across this report
+18 additional datasets cited (not shown individually)