GITNUX MARKETDATA
Browse Our Category
Environmental Ecological
Latest update:


Microplastics Statistics
One square kilometer can receive about 470,000 microplastic particles every day into Lake Erie’s western basin, while the atmosphere from a typical wardrobe is modeled to add 1.1 million particles per day. The page also brings the lab to the home with drinking water ranges up to 0.04 to 1.2 particles per mL and policy pressure points like the EU single use plastics ban starting 1 July 2021, so you can connect measured exposure, detection limits, and what gets regulated next.

Rainforest Deforestation Statistics
Primary forest loss hit 2.3 million hectares in the most recent 12-month period tracked by Global Forest Watch, while the Brazilian Legal Amazon cleared 13,038 km² of forest in 2021. See how the same drivers that accelerate clearing through cattle and roads also intensify health and climate risks, turning forest loss into a measurable, ongoing pressure on biodiversity.

Microplastic Pollution Statistics
From a Mediterranean estimate of 1.7 trillion microplastic particles in surface waters to wastewater effluent where almost 70% are fibers, this page connects the particle counts to the pathways that keep them moving, including up to 92% of seawater samples and high detection rates in human placentas, bottled water, and table salt. You will also see the regulatory and removal tension behind the figures, from up to 90% treatment system reductions to modeled road wear sources of 10^13 particles per year, plus what that means for ecosystems and costs now.

Amazon Deforestation Statistics
Amazon Defororestation is surging in ways the public often misses, with 2025 figures showing how fast forest loss can swing between regions and seasons rather than trending steadily downward. This page pulls the latest measurements together so you can see exactly what is driving the change and where the pressure is building next.

Vegan Environmental Statistics
Only 1.0% of U.S. adults identify as vegan yet plant-based market revenues hit $17.2 billion for meat and $14.0 billion for vegan leather in 2023, while dietary change can cut emissions by up to about 50%. This page pulls together the clearest environmental evidence on food choices and labels, plus what consumers are buying now, so you can see where impact is shifting and what still needs to catch up.

Fashion Industry Waste Statistics
See how fashion waste keeps compounding even as better collection and recycling targets arrive, with 2025 figures showing material loss is still larger than most brands publicly account for. Fashion Industry Waste puts the newest statistics side by side with the uncomfortable gap between where garments end up and what the industry says it is doing next.

Textile Waste Statistics
Textile Waste statistics reveal how the amount of textile waste generated is still climbing, even as a growing share of clothing is being diverted away from landfill. The tension is in the details, where what gets collected and what actually gets reused or recycled do not move at the same speed.

Air Pollution Statistics
Air pollution still drives 3.6 million premature deaths from outdoor pollution worldwide in 2019, yet the page also shows how targeted interventions can save millions over time and often deliver benefits that outweigh costs. It pairs that health burden with policy clarity, from 24 hour SO2 limits to PM2.5 monitoring coverage reaching 90% of the global population by 2023, so you can see exactly what changes air for people.

Sustainable Packaging Statistics
Packaging sustainability looks like a numbers game until you see the split reality behind it, from 45% plastics separate collection in the EU to the U.S. still recycling only 8.7% of plastic waste. This page connects policy targets and market momentum, including a 7.5% global forecast CAGR for sustainable packaging through 2030, to the practical shifts that decide whether materials end up recycled, composted, or landfill-bound.
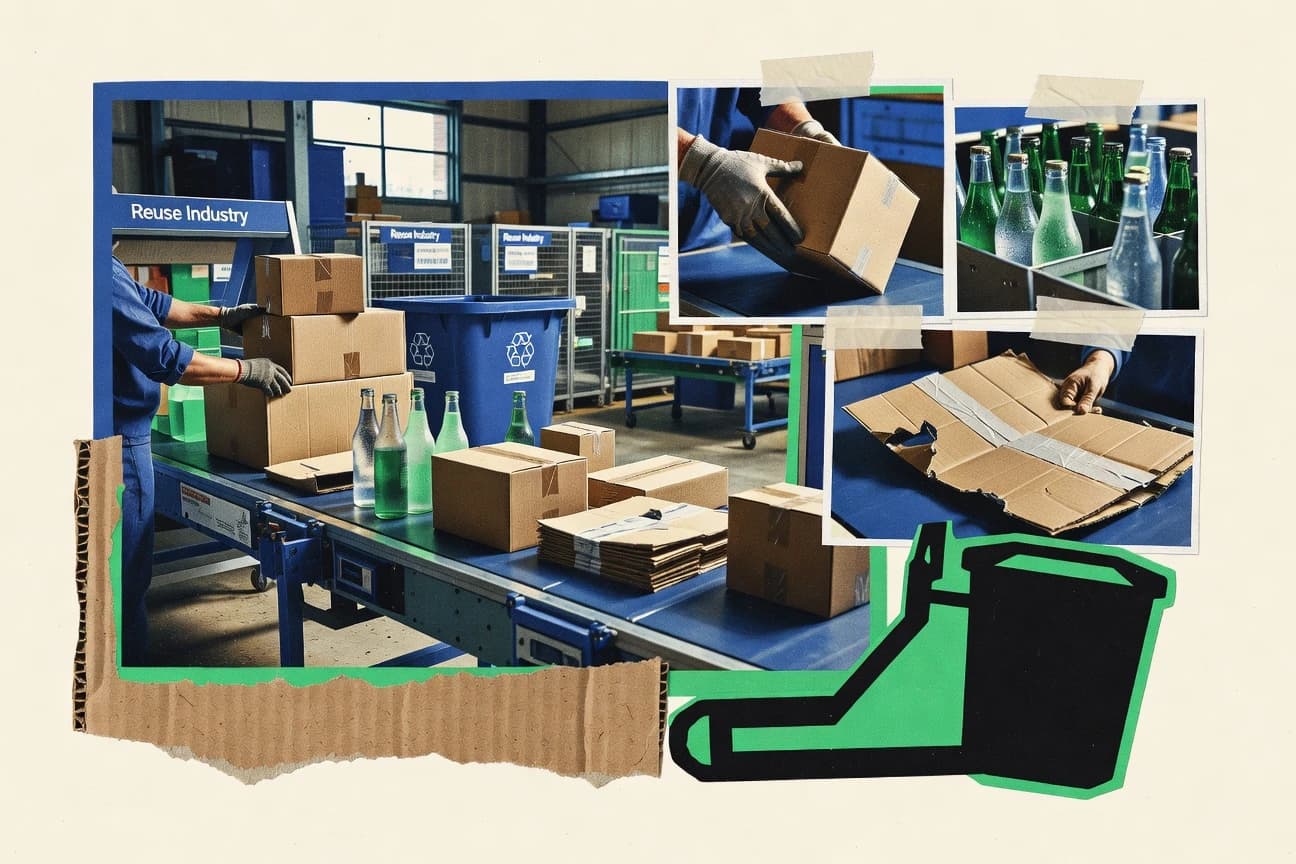
Reuse Industry Statistics
Reuse Industry statistics are showing a sharp shift in how materials are kept in circulation, with 2025 data pointing to reuse systems doing more than just diverting waste. From verified reuse rates to the latest recovery and market signals, the page makes it clear where the real momentum is building and where it still stalls.
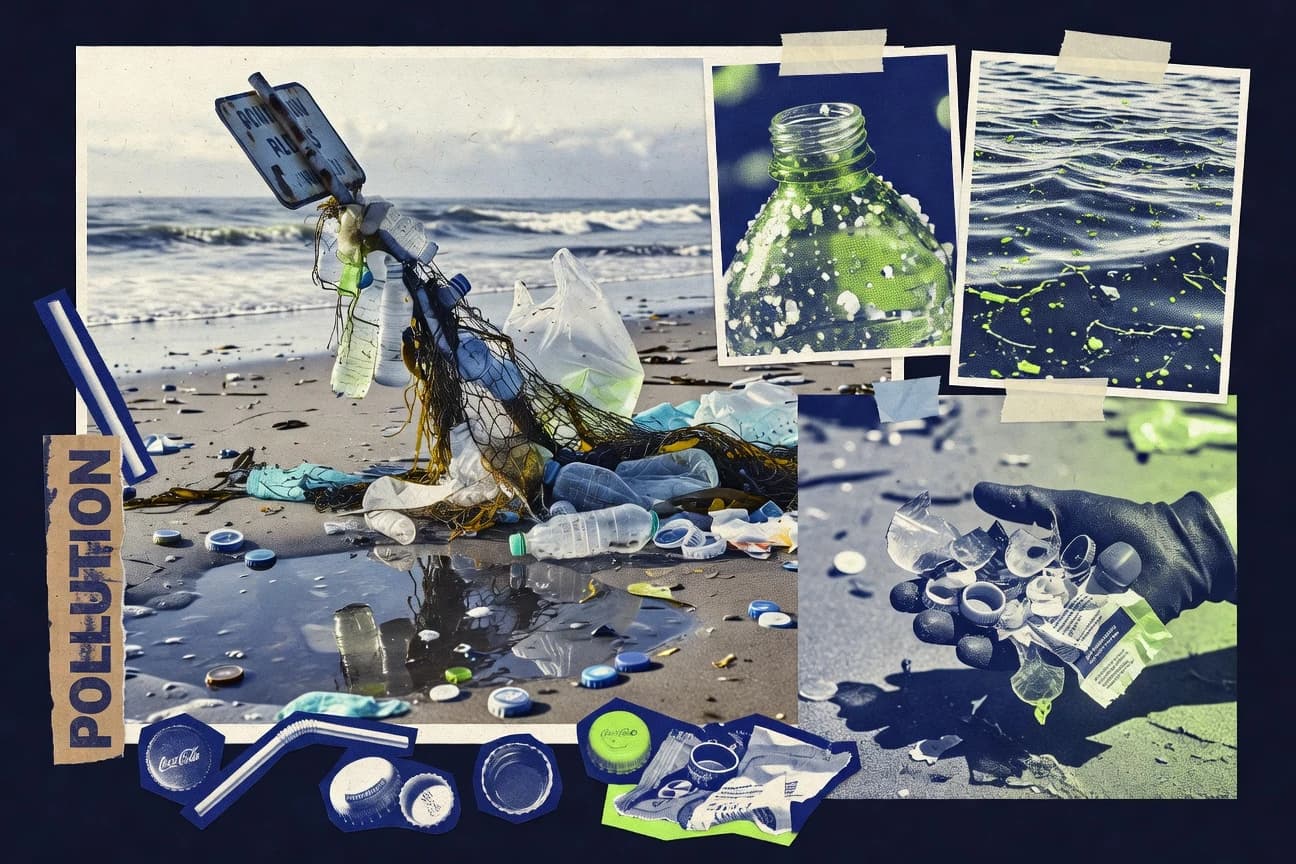
Trash Pollution Statistics
Plastic leakage is still hitting the sea at scale, with an updated estimate of 19 to 23 million tonnes entering the ocean in 2020, while 79% of all plastic generated since 1950 has already piled up as waste instead of being recycled or incinerated. See where the damage concentrates from coasts and shipping to fishing gear and lost containers, and how marine life, tourism, and fisheries are being priced in as costs that add up to billions each year.

Environmental Issues Statistics
Fresh 2025 evidence lays bare how uneven environmental pressures have become, with key indicators shifting fast enough to redraw what “normal” looks like. This statistics page connects the latest trends to the real tradeoffs people face right now, so you can see where progress is real and where it is slipping.
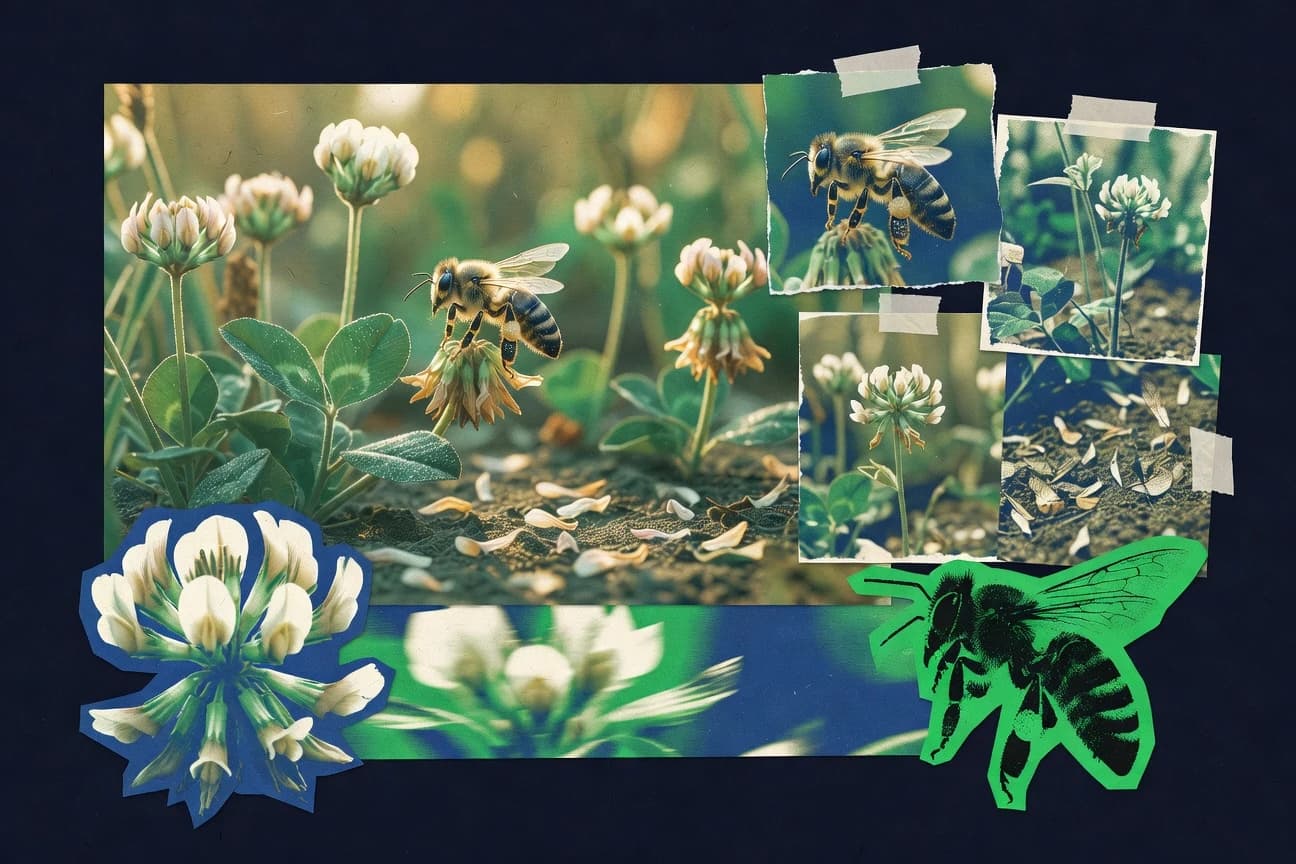
Bee Population Decline Statistics
From EU assessments that estimate 30 to 40% of native wild bees are threatened with extinction, to IUCN findings that over 20% of evaluated bee species are threatened and 2.2% are listed as Critically Endangered, the decline signal is already severe. Follow how drivers such as Varroa, nutrition gaps, and insecticide sublethal effects intersect with measurable losses in bumble bee richness and occupancy, and see which management tactics can still move outcomes in the opposite direction.
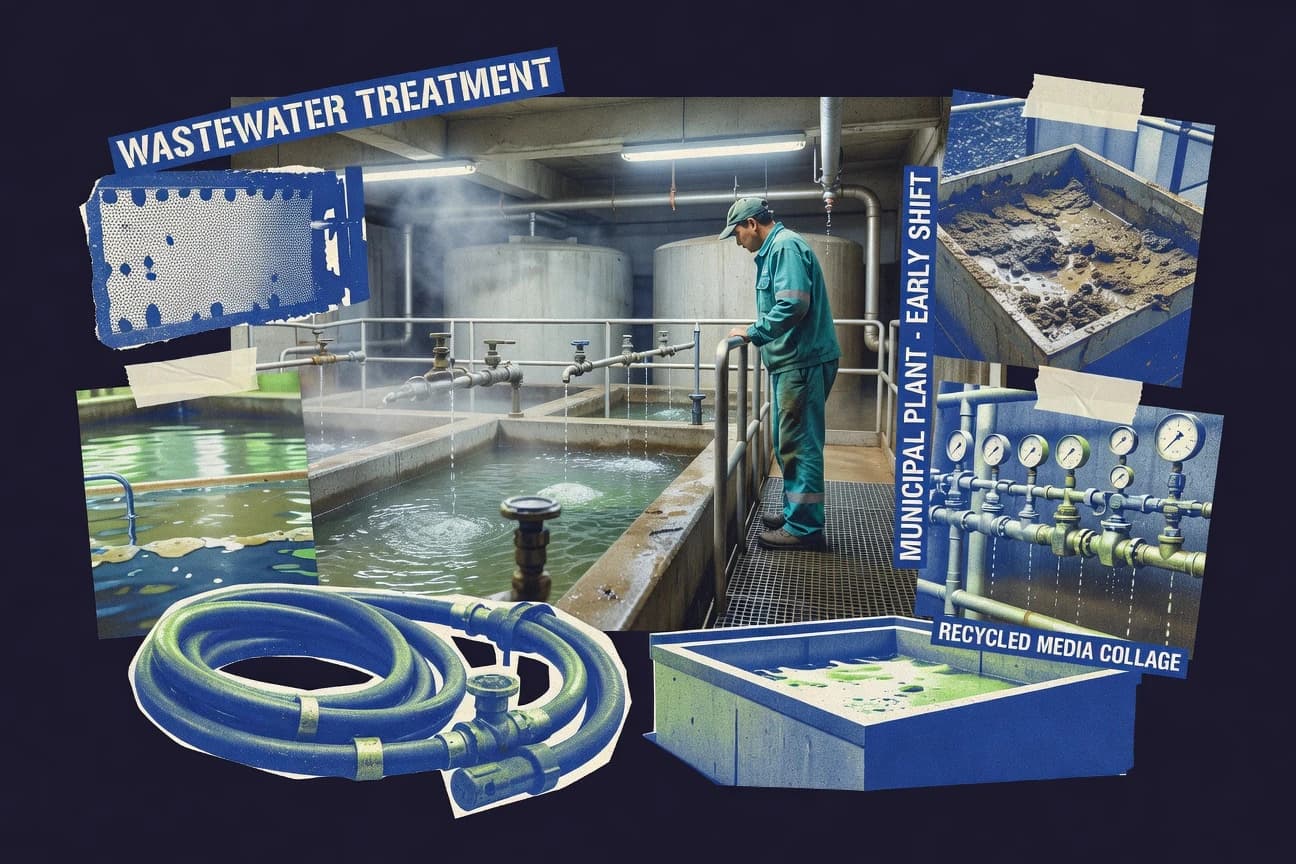
Wastewater Industry Statistics
Wastewater Industry statistics for 2026 show how treatment performance and compliance are tightening at the same time demand keeps rising, turning familiar benchmarks into real operational pressure. See which parts of the system are gaining momentum and which are falling behind, using the newest figures to separate industry progress from wishful thinking.

Forest Loss Statistics
Global primary forest loss reached 6.9 million hectares in 2023, yet the largest tropical signals shift fast across countries and drivers, from 9.8 million hectares of tree cover loss in Indonesia to 1.0 million hectares of forest destroyed in Brazil’s Legal Amazon in 2022. This page connects near real time satellite tracking and hotspot patterns to the policies and market rules that are meant to slow forest loss before it becomes irreversible.
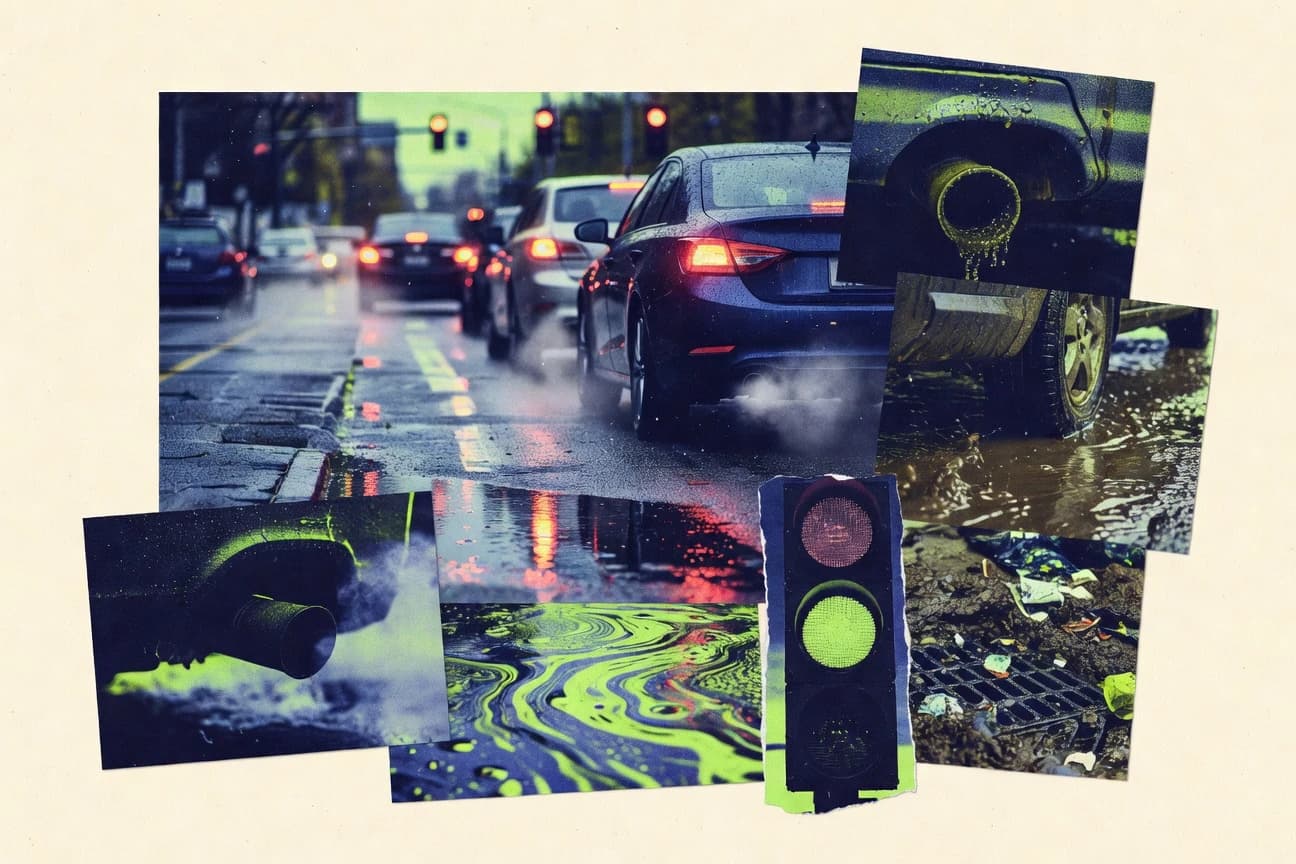
Car Pollution Statistics
From 6.7 million deaths tied to outdoor air pollution each year to a stark gap between rulebook NOx and what’s measured on roads, this page shows how transport turns tailpipe chemistry into public health costs, with road traffic a major driver of NOx, PM2.5, and CO2. It also tracks what is changing fast, including BEVs reaching 18% of new car sales globally in 2023 and diesel particulate filters cutting PM2.5 by about 60% to 90% depending on conditions.
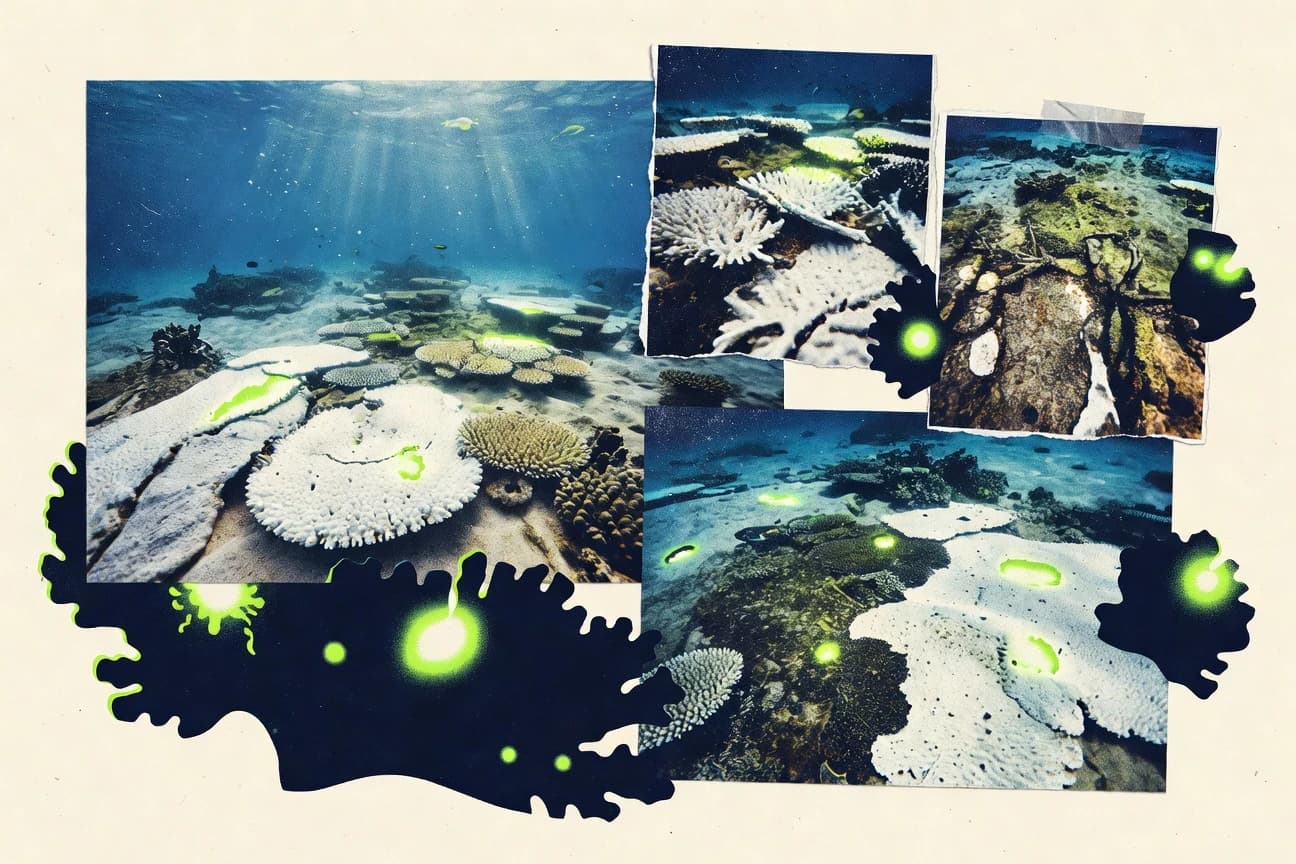
Coral Bleaching Statistics
Recent records show that coral bleaching is surging and recovery is getting harder, with 2023 setting a new high in heat driven losses. See how the latest projections for 2024 and beyond reveal a faster jump from stress to widespread bleaching than many ecosystems can bounce back from.
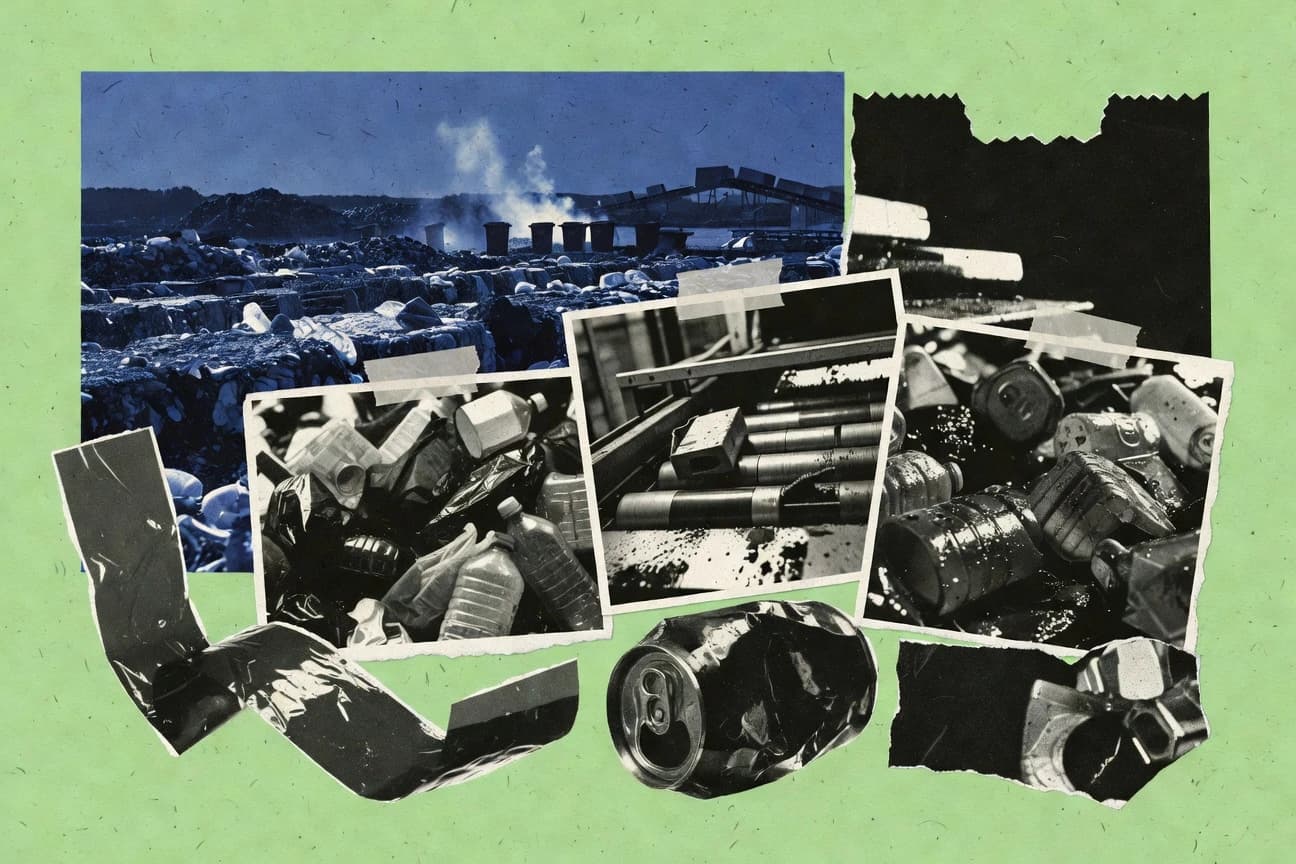
Global Waste Statistics
Municipal waste needs an estimated $37 billion per year in investment to close gaps across low and middle income countries, even as food waste makes up 33% of the problem and only about 10% of plastic gets recycled. See how global waste management markets are projected to climb toward $2.63 trillion by 2030 alongside major policy shifts in the EU and Basel Convention that aim to cut dumping, expand recycling, and tighten cross border waste flows.

Biodiversity Loss Statistics
Biodiversity is shrinking faster than many people expect, with 2025 figures showing steep declines in species populations and accelerating habitat loss. Read the numbers behind the downturn to understand how quickly ecosystems are being pushed past recovery.

Green Space Statistics
From a 0.8–1.3°C cooling boost from tree canopy to greener places lowering stress by 4.7 points and cutting depression risk by 11%, the page ties everyday wellbeing to measurable climate benefits. It also contrasts that promise with what cities need to act on fast, including that urban tree canopy in Great Britain sequesters about 1.8 million tonnes of CO2e each year and that LIFE funding and EU and city targets are now pushing nature based solutions into mainstream urban planning.