GITNUX MARKETDATA
Browse Our Category
Environmental Ecological
Latest update:


Poaching In Africa Statistics
Elephants are still being killed at an average pace of 31,000+ per year in the late 2010s, yet the page pinpoints what makes poaching worse and what actually shrinks it, from where enforcement gaps open and cost protected areas $150–$250 million annually to why more patrol days and better ranger support can cut losses by measurable margins. You also get hard logistics and forensics, including how 1 in 5 major seizures looks linked to poached wildlife, what it costs to intercept shipments on a key corridor, and how DNA, drones, and community patrols change the odds for traffickers.
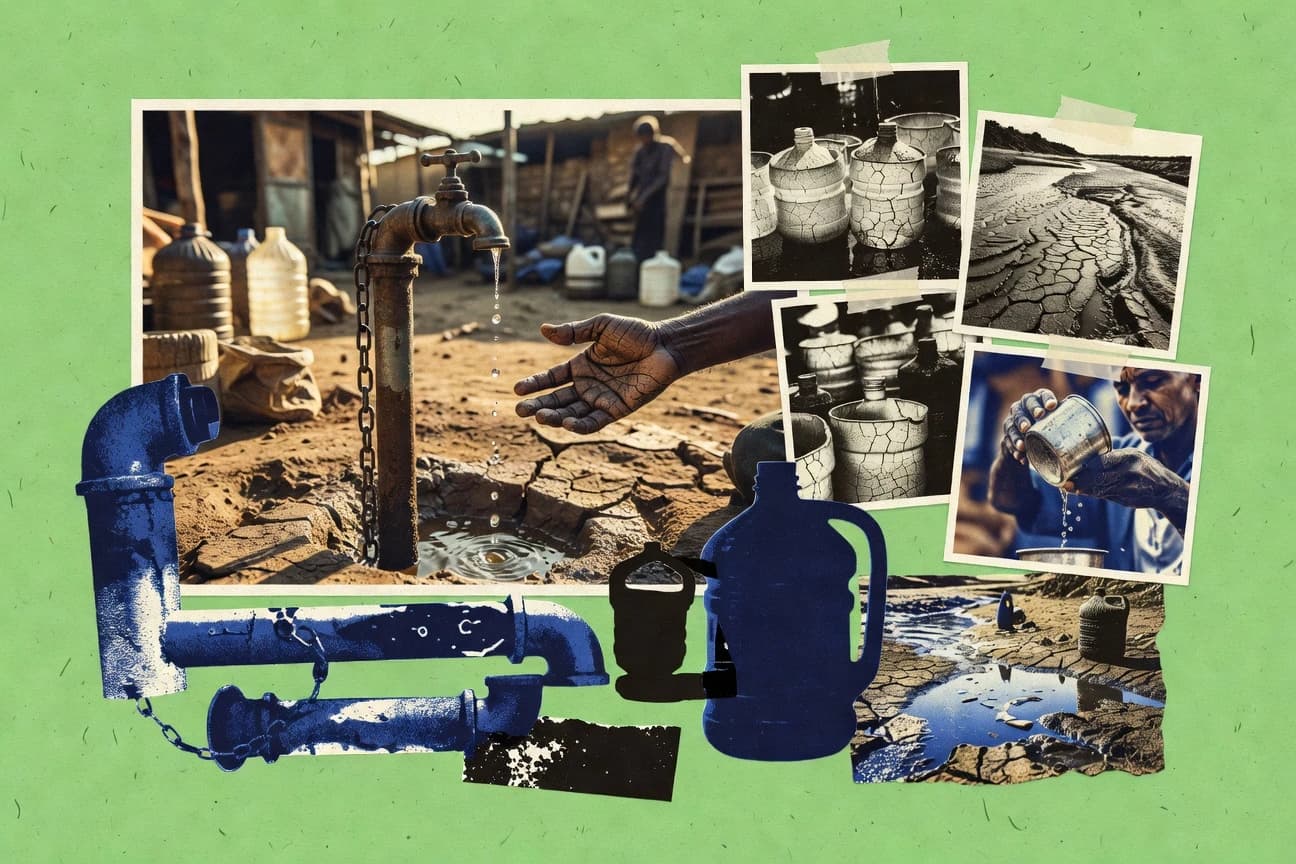
Global Water Crisis Statistics
Even when the world has clean water on paper, millions are still shut out of basic safety. This page pairs 2020 figures like 785 million people lacking basic drinking water and 23% living in water stressed countries with the cost side of the crisis so you can see how shortages, flooding risk, and untreated wastewater translate into health, schools, and economies.

Gas Emissions Statistics
Methane cuts can reach a 70% reduction for coal mine VAM when oxidation systems perform as quantified by the IPCC, yet the emissions race still shows a projected 2.9 GtCO₂e gap in the pathways needed for 2°C. Follow how CO₂ still dominates at 54% of 2019 greenhouse gas emissions, while agriculture accounts for 29% of methane, and see what MRV, monitoring, and targeted investments are buying in real abatement.

Palm Oil Deforestation Statistics
Oil palm growth keeps reshaping forests and peat, with 2019 showing 86% of new Brazilian Amazon expansion concentrated in deforestation hotspots and 31% of impacts driven by indirect land use change. Track how commitments, certification, and rising biodiesel demand collide with measurable habitat and carbon pressure, from Malaysia and Indonesia’s 8,000 km² forest conversion to peat disturbance across Indonesia’s millions of hectares.

Recycling Statistics
Even with packaging directives pushing higher targets, only 5.6% of U.S. plastics waste was recovered in 2019, while the EU reached a 46.6% municipal waste recycling rate in 2022 and some packaging streams hit 89% in 2022. This page tracks what gets recycled across plastics, paper, glass, and steel and ties it to climate impact, funding, and market growth so you can see why recovery rates matter far beyond the bin.

Lotus Statistics
See why 57% of organizations reported a critical spreadsheet error in the last 12 months while spreadsheet and collaboration spend keeps accelerating toward cloud and governance driven automation, including a forecast USD 15.3 billion global spend in 2026 and 45% of enterprise software shifting to cloud delivery by 2025. The page ties spreadsheet risk, data breach costs up to USD 4.71 million on average, and governance behaviors like 58% adopting data governance into clear takeaways for anyone trying to protect shared work without slowing teams.

Cats Killing Birds Statistics
Cats are responsible for a staggering 2.4 billion birds killed each year, and that’s only the beginning of what the Cats Killing Birds numbers reveal about the scale and patterns of this impact. The stats tighten the gap between how many birds go missing and what really drives it, so you can see where action could matter most.

China Air Pollution Statistics
What explains China’s shift from worsening fine particle pollution toward stronger control is laid out with up to date signal points, from about 86.0% good air days and roughly 36,000 ground monitoring stations to an estimated 27% of global PM2.5 related premature deaths tied to East Asia including China. You get the policy and industry levers behind the change, including power sector near universal ultra low emission upgrades and fast VOC and smog response mechanisms that reshape exposure in measurable ways.
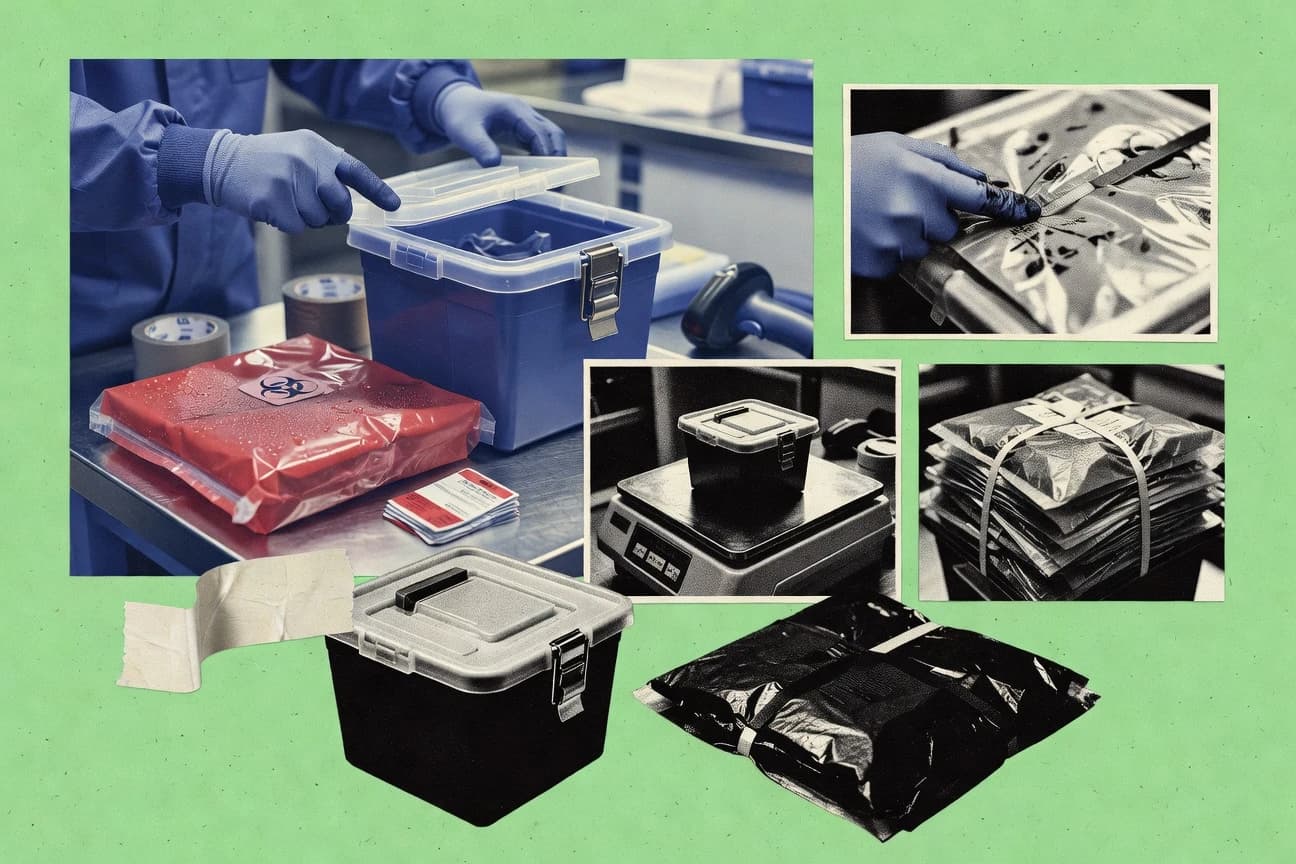
Medical Waste Industry Statistics
Medical Waste Industry statistics reveal how far regulation and disposal practices have come by 2025, yet they also expose where costs and handling still strain systems. See the 2026 focused benchmarks that separate compliant medical waste management from the operational risks that quietly add up.

Water Pollution Statistics
Water pollution kills millions each year and drives treatment and energy burdens that rarely get counted, from 5.5 million deaths tied to unsafe water, sanitation, and hygiene to an estimated 2,000 to 3,000 TWh per year needed to keep water and wastewater services running. This page connects nutrient dumps, toxic industrial effluent, and hypoxic dead zones to what modern treatment can realistically achieve, from membrane bioreactors and reverse osmosis to advanced oxidation and nutrient removal systems.

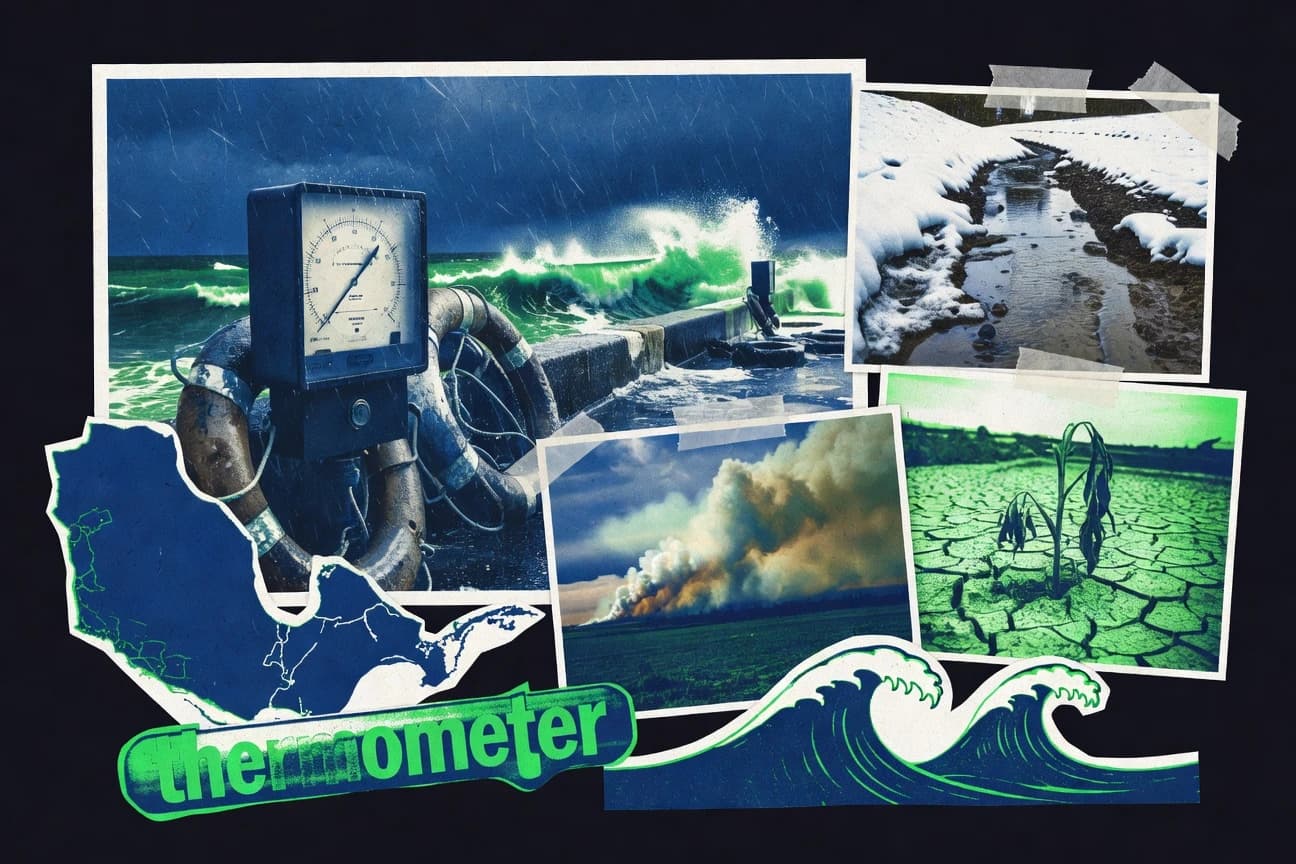
Global Climate Change Statistics
With 1.0°C of warming projected for 2030 to 2039 even under the lowest forcing scenario, this page puts the latest signals side by side with progress and risk, from 30% renewable electricity share in 2023 to methane cut potential of about 45% by 2030 and clean energy investment of about US$1.7 trillion in 2023. It also tracks the tightening carbon reality behind the scenes, including CO2 reaching 419.3 ppm in 2021 and oceans absorbing an extra 12.0 ± 0.2 ZJ of heat since 1960 while emissions growth and impacts like coral reef losses still pull in the opposite direction.

Fashion Industry Environmental Impact Statistics
Track how fast the fashion footprint is changing, from 2025 estimates of carbon emissions to the waste and water pressures that still follow every new collection. The contrast is sharp between what the industry promises and what the latest Environmental Impact statistics measure, so you can spot progress where it is real and red flags where it is not.
Climate Change Awareness Statistics
See how 2025 evidence sharpens the urgency, from rising heat and intensifying extreme weather to the costly pace of carbon emissions. These statistics make a simple point feel immediate and personal, showing what is changing now and what it will cost if we keep waiting.

Coral Reef Destruction Statistics
Nearly 75% of the world’s coral reefs are estimated to be threatened, and 84% of reef area has already been degraded by human impacts, yet the risk is accelerating as global warming pushes heat stress beyond what reefs can absorb. See how 1.6°C, more frequent severe bleaching, and rising thermal stress can translate into mass coral loss, threatened reef fish, and billions in coastal protection and tourism value at stake.
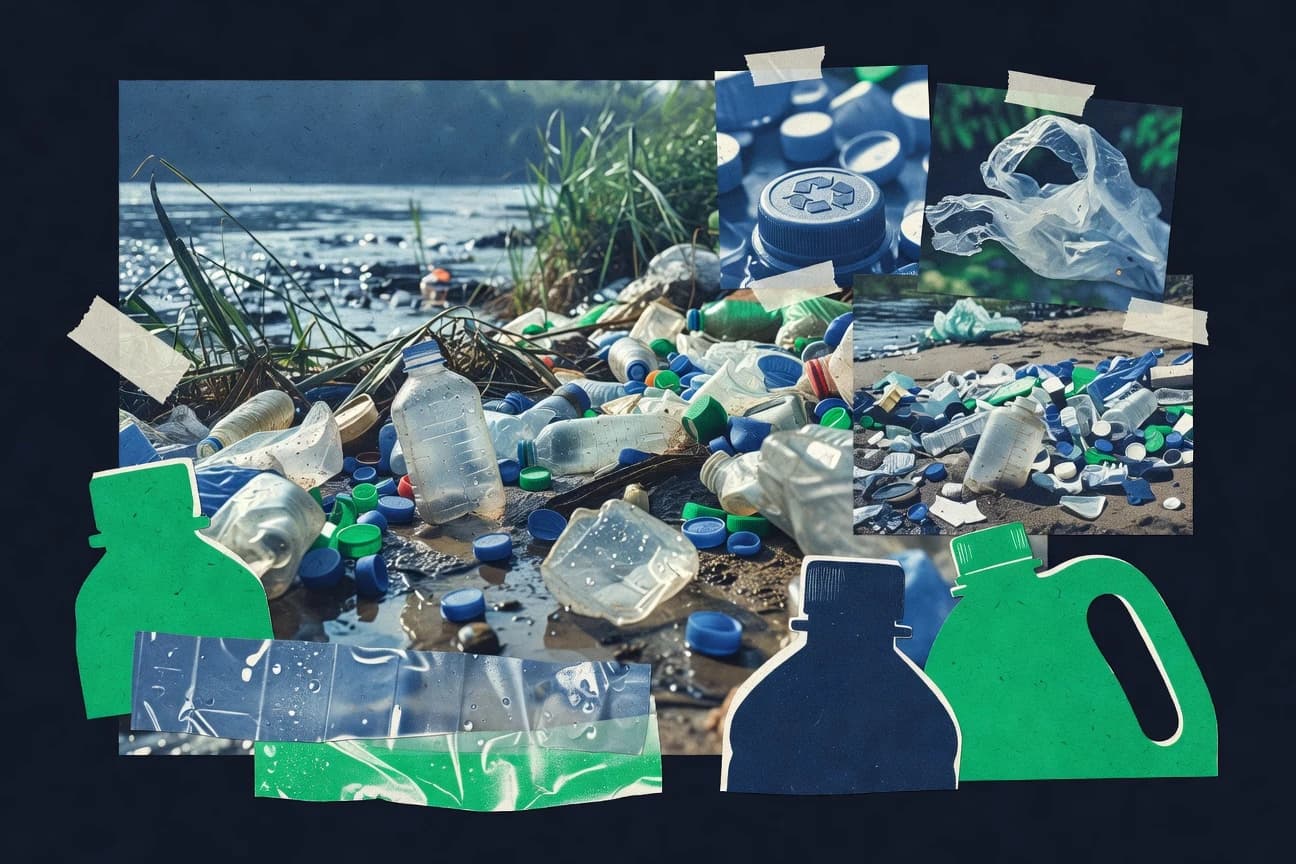
Plastic Waste Statistics
Plastic waste keeps piling up even as recycling is still not keeping pace, with 2025 figures showing how far current recovery rates lag behind what gets generated. You will see the sharp gap between what is collected and what actually ends up reprocessed, and why that difference matters for where pollution goes next.

Environment Statistics
By end of 2023 the world had 1,530 gigawatts of renewable power, yet air pollution still drives millions of deaths and only 9% of plastic packaging is recycled worldwide. This page connects the energy and climate transition with the impacts on health and materials so you can see where progress is fast, where it is stalled, and what is likely to follow.

Sea Level Rise Statistics
By 2025, sea levels are rising fast enough to reshuffle what “typical” coastal flooding looks like, turning rare surges into more routine trouble for homes and ports. This page lays out the latest measurements and the tipping point they point to so you can see where the shoreline is heading next.

Carbon Emissions Statistics
With 510 GW of renewable capacity added in 2023 and voluntary carbon credit prices averaging $4.11 per tCO2e, the page tracks how fast climate action is scaling even as global energy related CO2 emissions stay in a tight band around 36.8 to 37.4 GtCO2e. It connects sector pressure points and methane detail with signals like 0.42 tCO2 per MWh for electricity and 70% global LED penetration, so you see exactly where reductions are winning and where they are not.
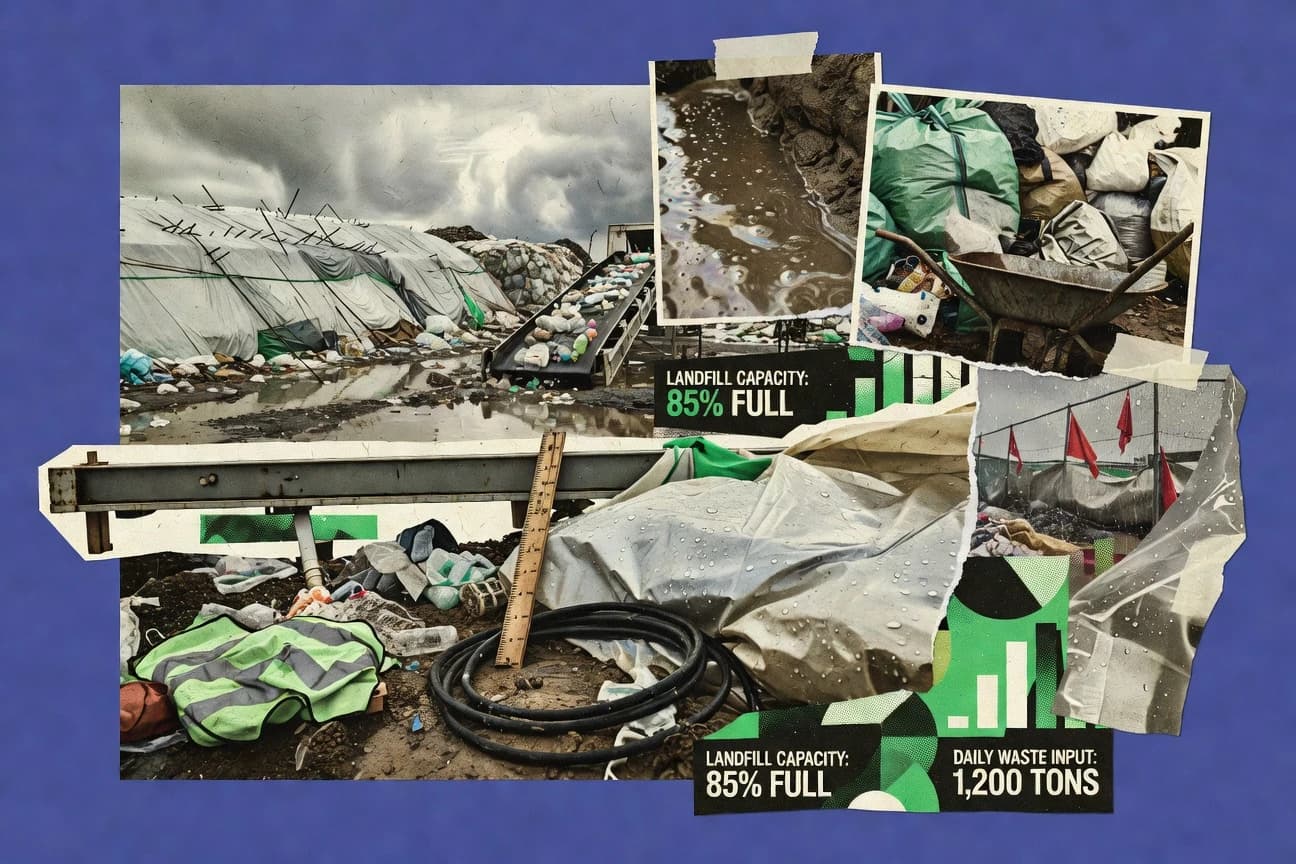
Landfill Statistics
Landfill numbers are shifting fast, with 2026 figures showing a clear change in what’s going into disposal and what’s being kept out. Get the key statistics behind the latest totals so you can see where the gains are real and where the system is still under strain.
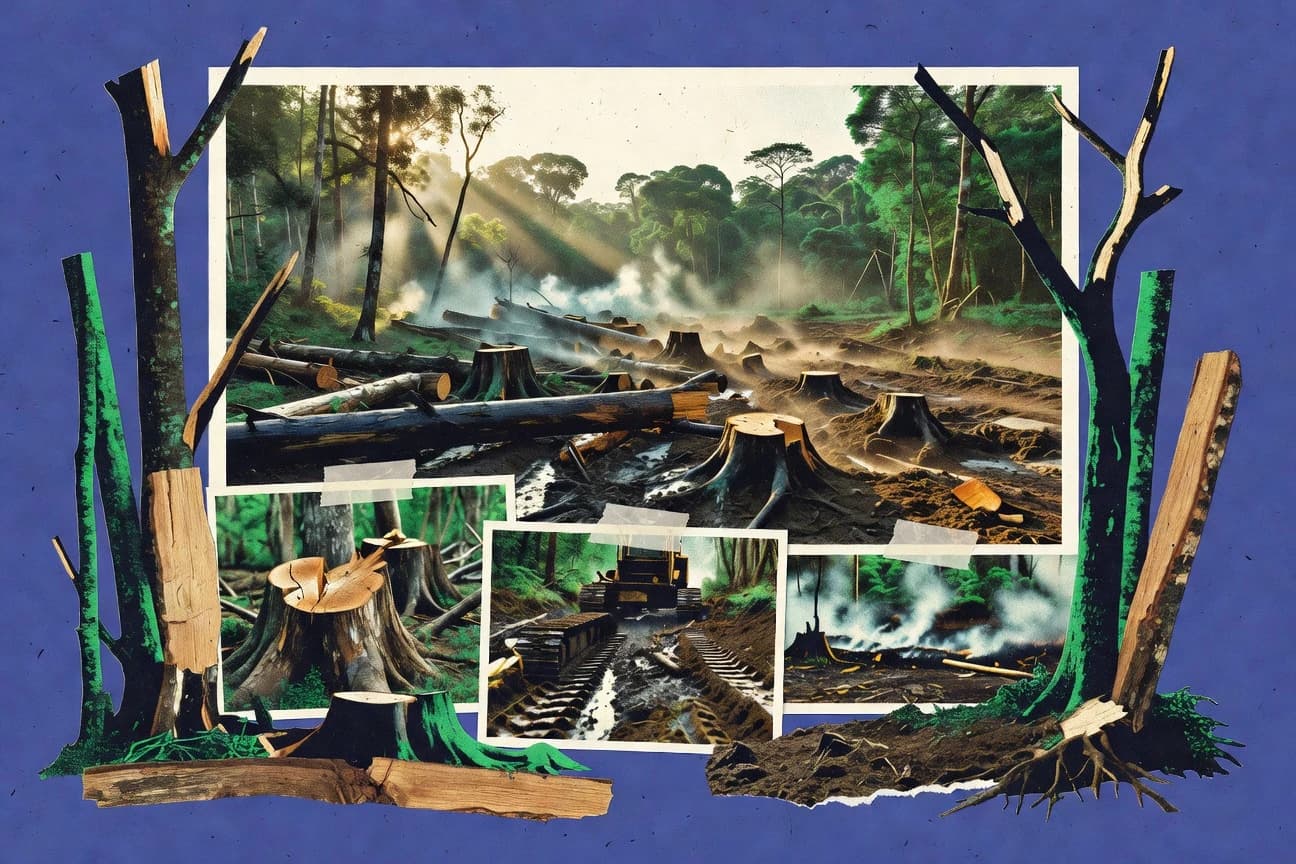
World Deforestation Statistics
Tree cover loss did not just continue, it shifted in 2025 as deforestation pressures pushed deeper into forests that once seemed harder to reach. This page lets you compare where the loss accelerates and who is most affected, so the next policy decision can be based on what changed rather than what was expected.