GITNUX MARKETDATA
Browse Our Category
Environmental Ecological
Latest update:

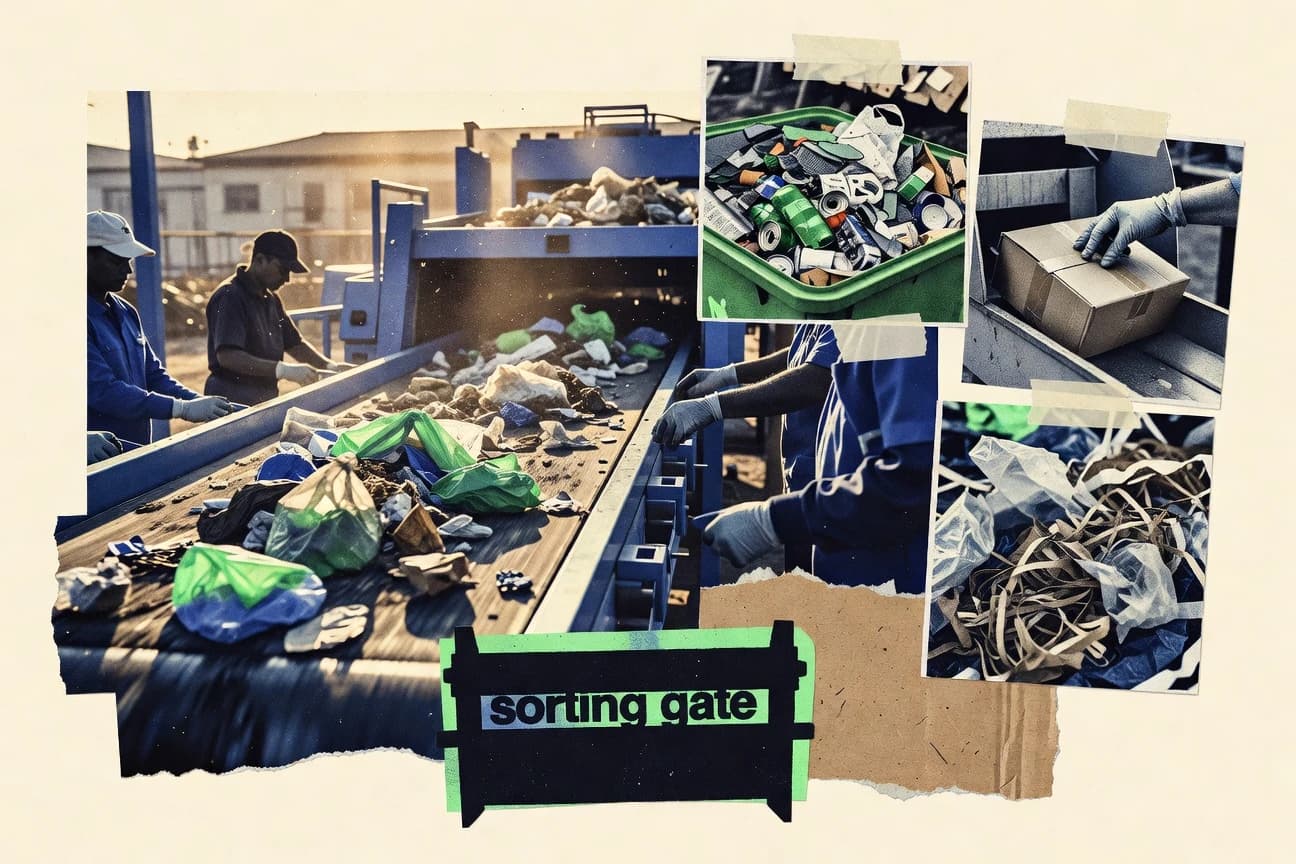
Waste Management Statistics
Food waste keeps showing up where you might least expect it, with 69% of U.S. households reporting they generate it at least weekly, while only a 5.9% U.S. composting rate turns that potential into soil instead of emissions. From 34% of methane tied to landfills to a global recycling and recovery gap that runs all the way to 65% EU recycling by 2035, this page connects the household bin to policy targets and market pressure.

Illegal Wildlife Trade Statistics
Global illicit wildlife trade is estimated at US$1.4 billion per year and 2.5 million illegally traded animals, yet enforcement support is scaling alongside the threat with INTERPOL backing 4,000+ wildlife crime investigations in 2021 and CITES Secretariat capacity building on 200+ activities since 2010. Track where seizures and tracing gaps happen, from ivory and pangolin scale busts to online purchase instructions, and see how smuggling routes and laundering risks turn illegal commerce into a direct driver of extinction and public health harm.

Habitat Loss Statistics
Habitat loss is the top threat to threatened species, and it shows up across taxa, even as the world converts land faster for agriculture and pasture than for any other purpose. See how shifting pressures are playing out now with 2023 Brazilian Amazon deforestation down to 13,235 km² after earlier peaks, while forests shrink and fragmentation, emissions, and extinction risk reinforce the same feedback loop.
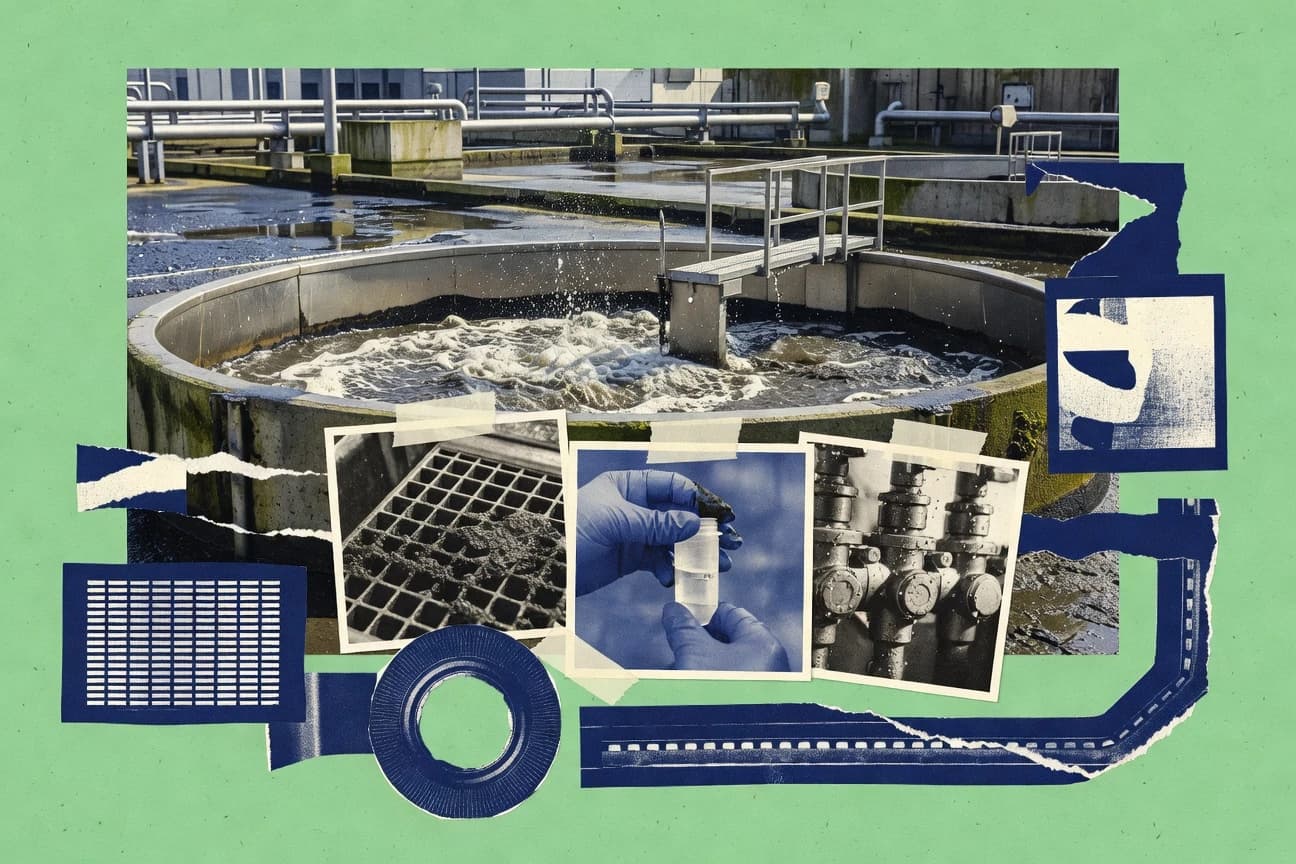
Wastewater Treatment Industry Statistics
The page puts a spotlight on 2023 cost and performance pressures, from U.S. household wastewater bills rising 4 percent to an average of $0.004 per gallon to global energy costs hitting $0.50 to $1.50 per m³ where electricity can dominate budgets. It also tracks the hard tradeoffs behind upgrades such as nutrient retrofits adding $1 to $3 million per MG per day while membrane and sludge realities shape lifetime expenses, plus the climate and compliance signals that can swing spending fast.

Cruise Ship Pollution Statistics
Cruise ships can pour 1.4 billion gallons of bilge water into the ocean every year while also belching nitrogen oxides and sulfur pollution that rivals or outstrips millions of cars, with one vessel burning up to 250 tons of fuel daily. The page connects air and water impacts from 80 million tons of CO2 in 2019 and runaway NOx growth through port air quality drops of 20 to 50 percent to the wildlife deaths and reef damage tied to cruise operations.
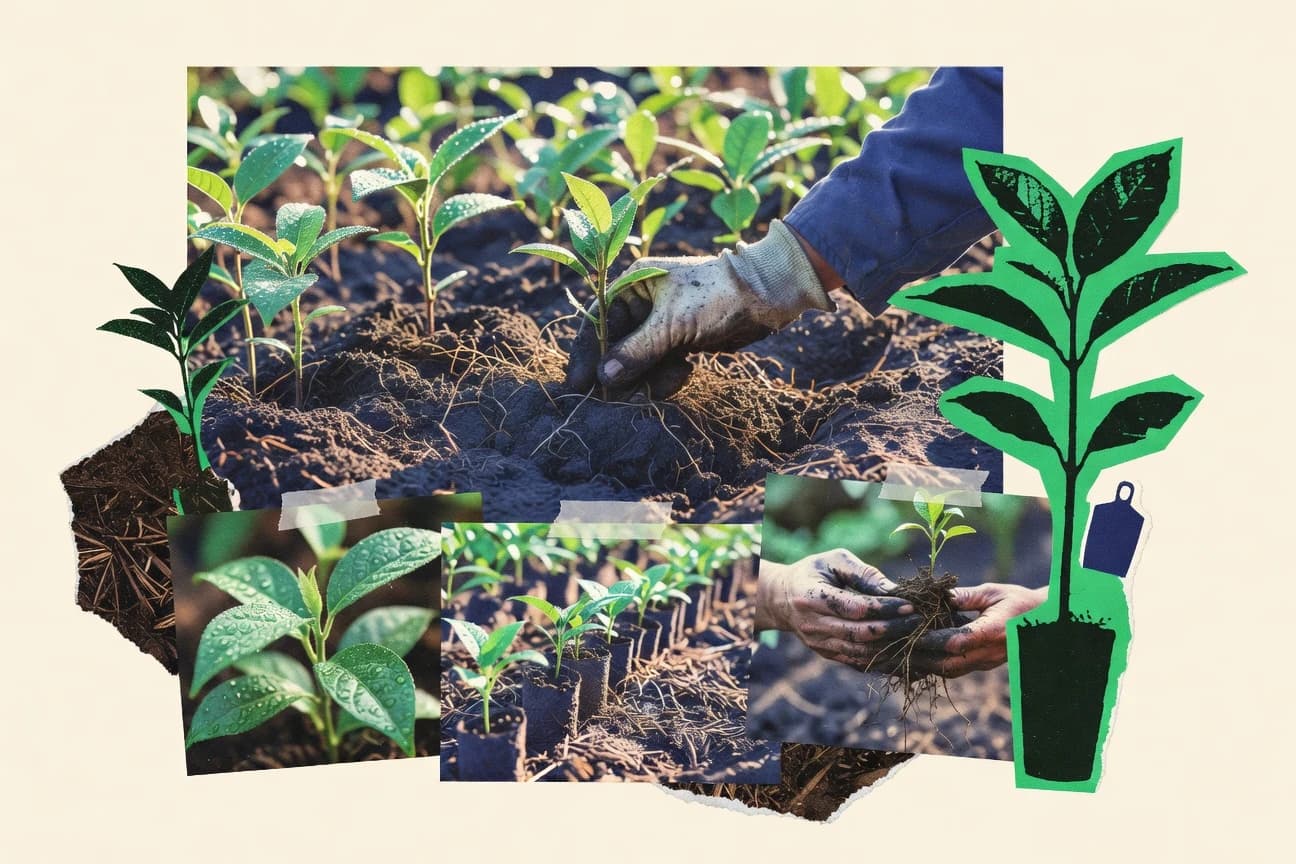
Reforestation Statistics
Reforestation success hinges on precision, because survival can sink below 50% after 5 years without monitoring and reforestation failure rates hit 20 to 50% from poor site selection and maintenance. This page also weighs what is actually at stake in 2025, from a $300 billion Bonn Challenge funding gap by 2030 to outcomes like drought stalling 40% of projects in semi arid zones and carbon accounting errors overestimating sinks by 20 to 50%.
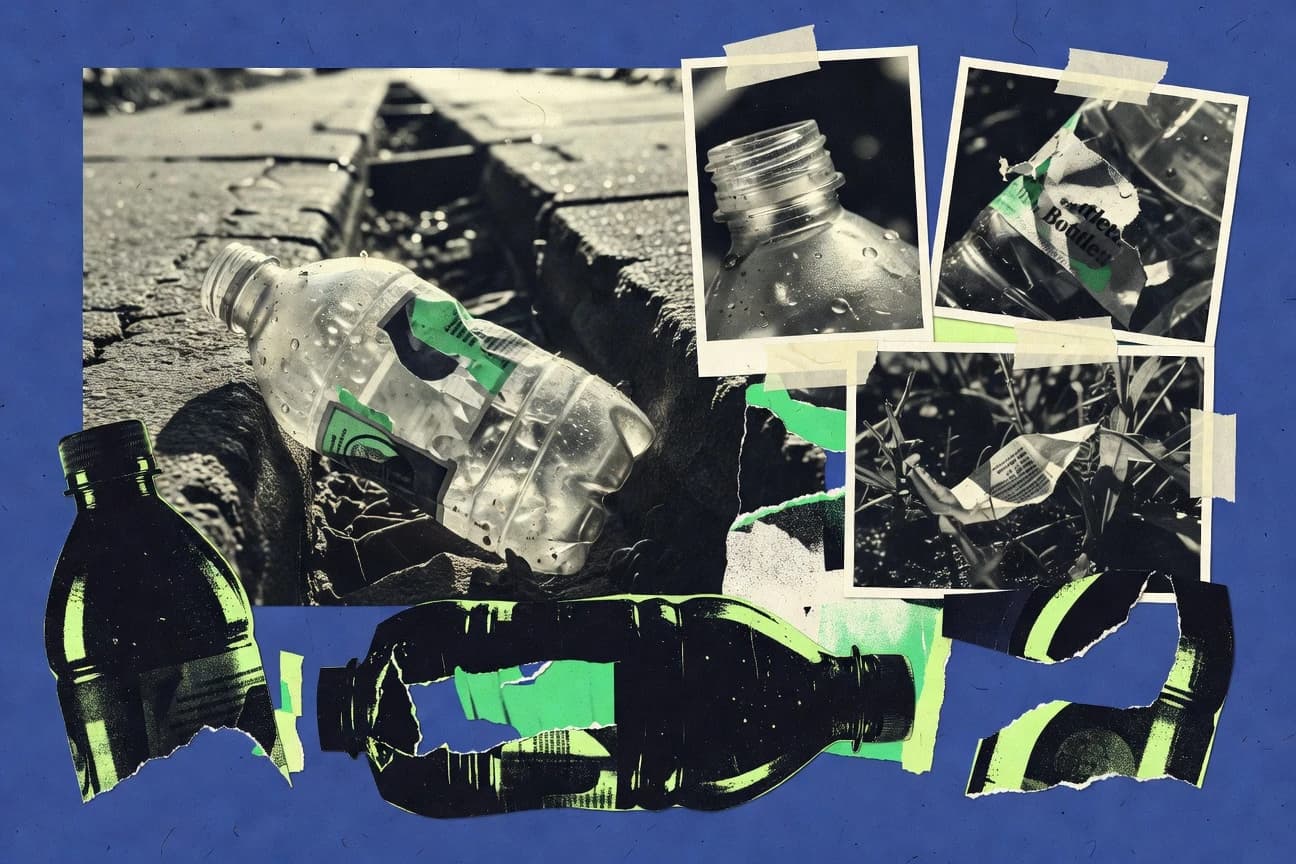
Plastic Bottle Statistics
Global PET water bottle demand is still staggering at 600+ billion single use bottles a year, with waste following just as relentlessly at 58 million tons of PET bottle trash annually and 90% not recycled. This page connects everyday buying patterns, $85 billion in 2022 sales revenue, and production and leakage impacts to show where change could actually matter.
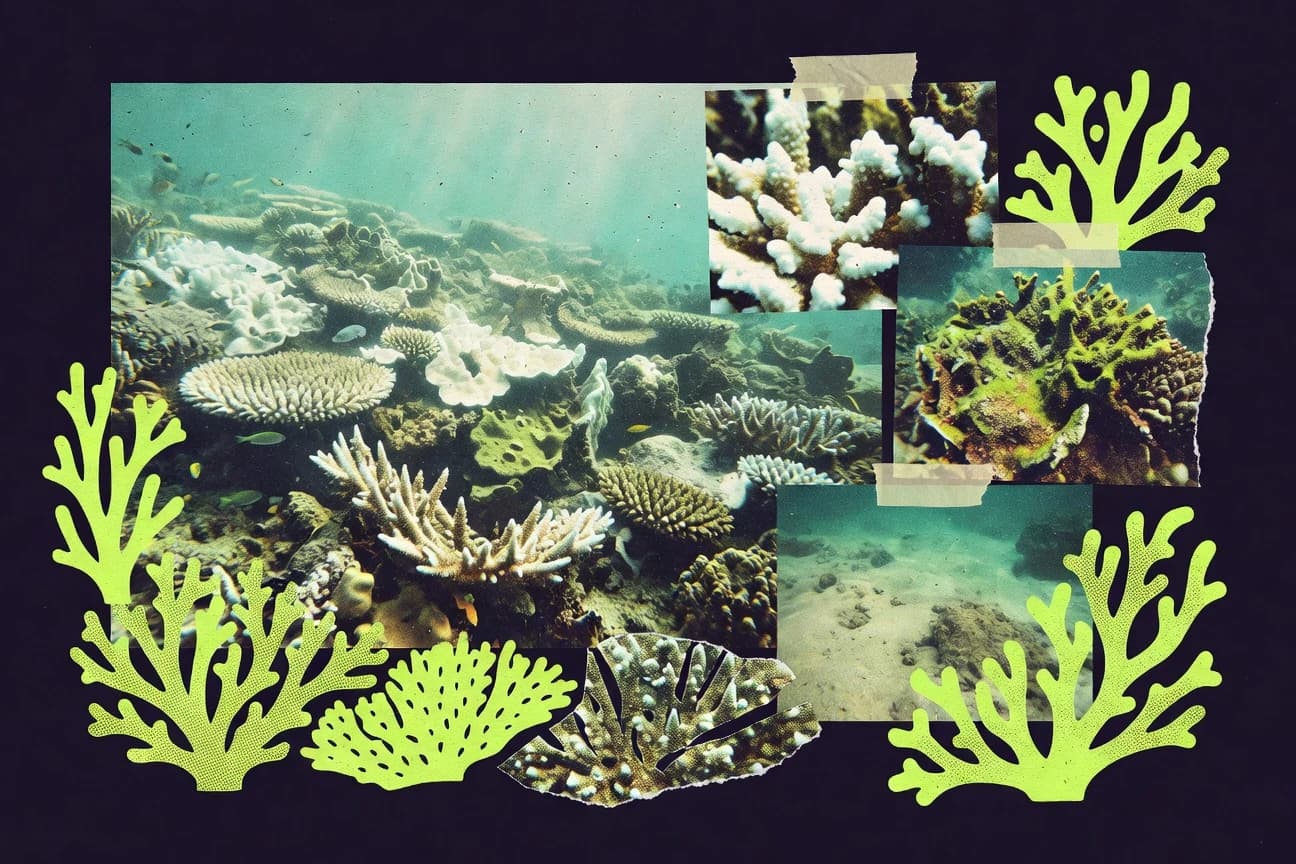
Coral Reef Decline Statistics
Coral Reef Decline tracks what climate stress and local pressures are already doing, where 32% of assessed reef species are threatened or extinct and warming of about 2.0°C is projected to drive near-total coral loss in many regions, backed by recent bleaching monitoring and long-term declines of roughly 20% in coral cover from 2009 to 2018. It also connects reef loss to real costs and risks, from up to $0.5 trillion per year in economic value at stake to the people and fisheries that depend on reefs for protection, food, and biodiversity.

Aluminum Recycling Statistics
Aluminum recycling is already generating major returns, with 2025 projections framed by recent results such as the US supporting $4.5 billion in economic activity in 2021 and global scrap recycling reaching $45 billion in market value in 2022. But the real jolt is impact per ton, where recycled aluminum can cut energy use by up to 95 percent and emissions by about 95 percent compared with primary production, alongside job gains and billions saved in landfill and energy costs worldwide.
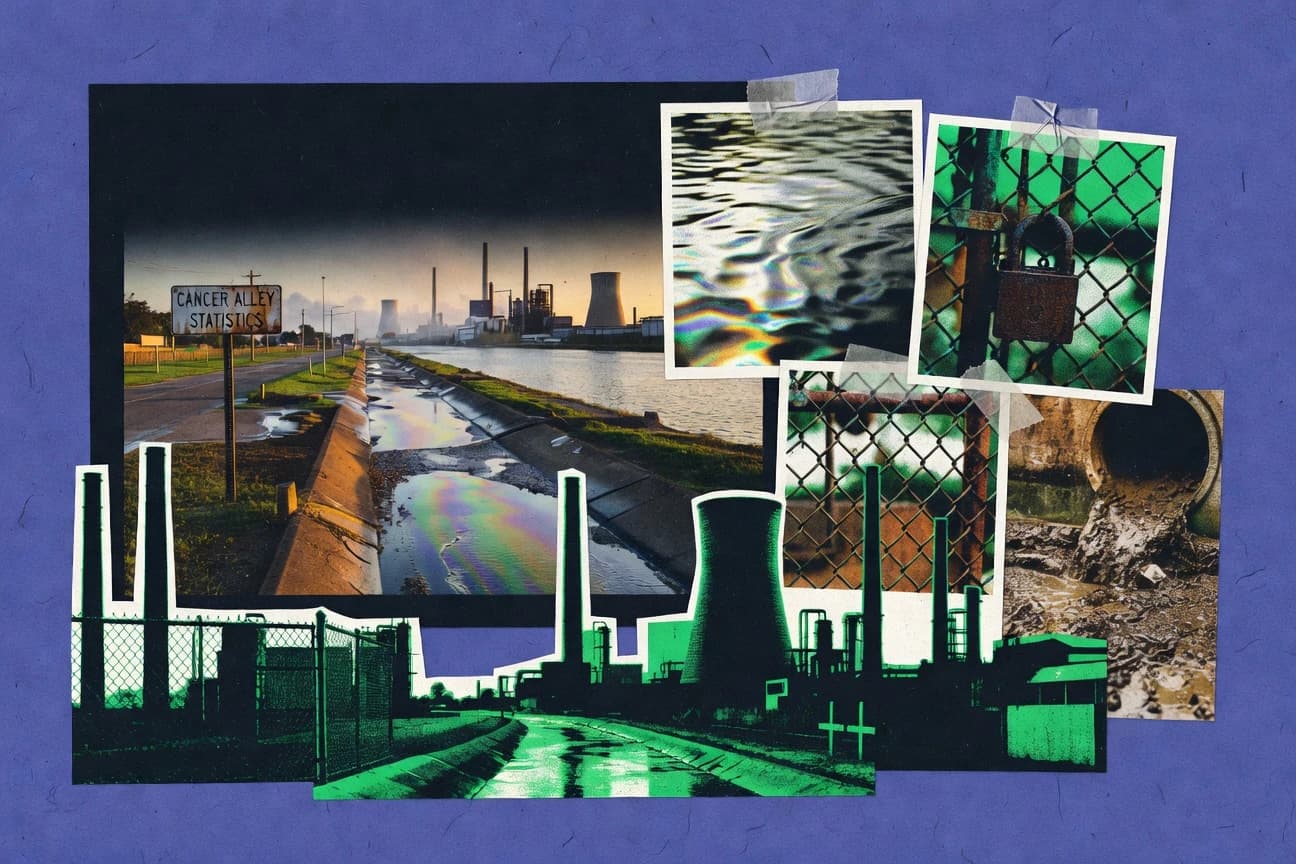
Cancer Alley Statistics
With US chemical investment surging on the Gulf Coast and expansion shares climbing through the 2023 to 2025 window, this Cancer Alley statistics page connects that momentum to health stakes, including 185 oil and gas–attributed occupational deaths in the four biggest producer states and a global air pollution burden that still drives 1.2 million premature deaths worldwide in 2019. It also zooms in on the exposure neighborhood reality, from millions living within a few miles of major hazardous air facilities to benzene and silica risk that stack up in petrochemical communities.
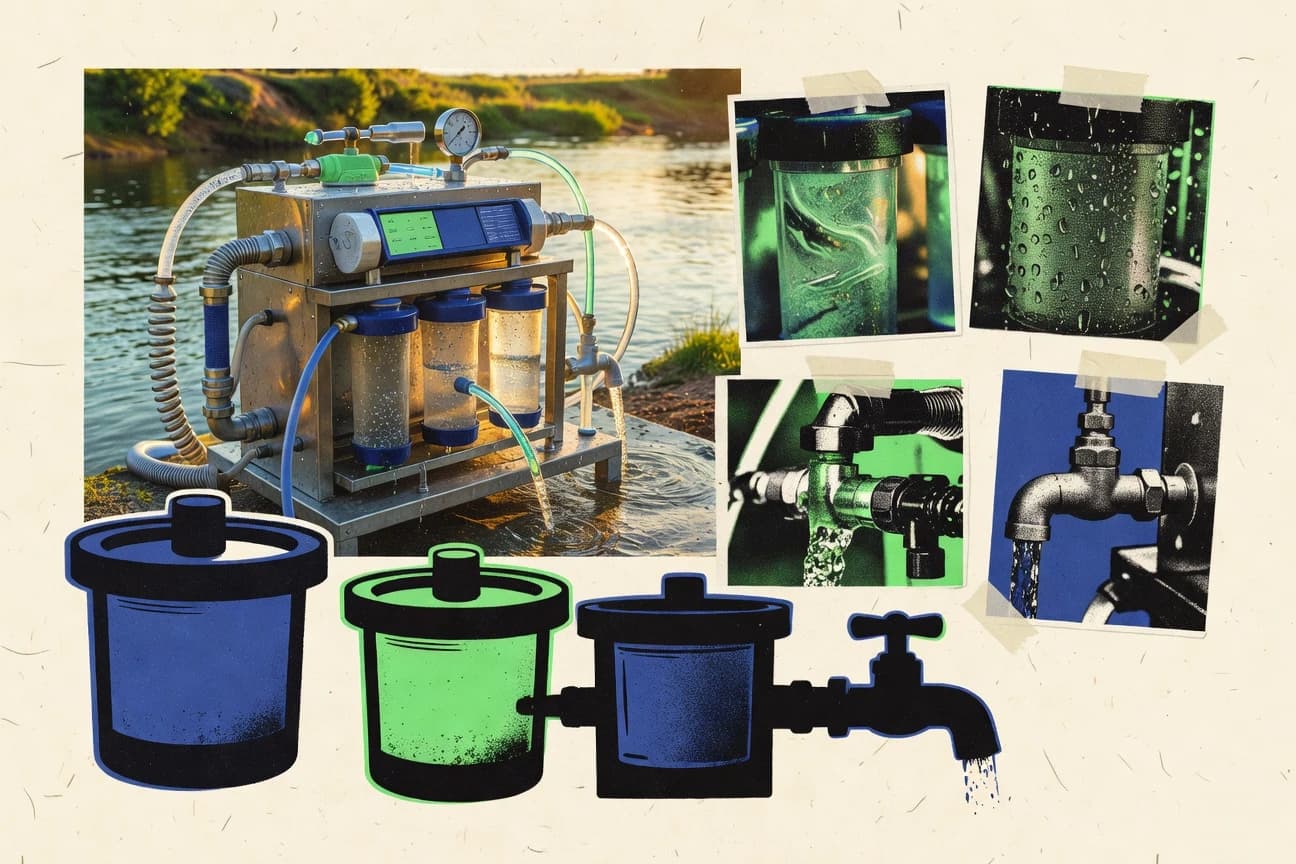
Water Purification Industry Statistics
With 1.6 billion people still lacking basic drinking water services and 0.5 to 2 NTU as the practical turbidity line utilities target for microbial safety, this page connects public health stakes to the treatment choices that make or break compliance. It also tracks today’s cost and capacity pressures, from a 2023 chemicals market worth USD 25.1 billion and a USD 472 billion 2011 to 2020 drinking water infrastructure gap to the PFAS, lead, and filtration metrics engineers use every day to defend performance.

Plastic Pollution Statistics
Plastic pollution is already measurable at a human scale, from 50 billion plastic water bottles consumed every year to single use plastics making up 40 percent of global consumption at 188 million tons annually. Get the current evidence behind the headlines, including plastics production projected to reach 1.1 billion tons by 2040 without intervention and a recycling rate of just 9 percent, so you can see exactly where the system fails and what can realistically change.
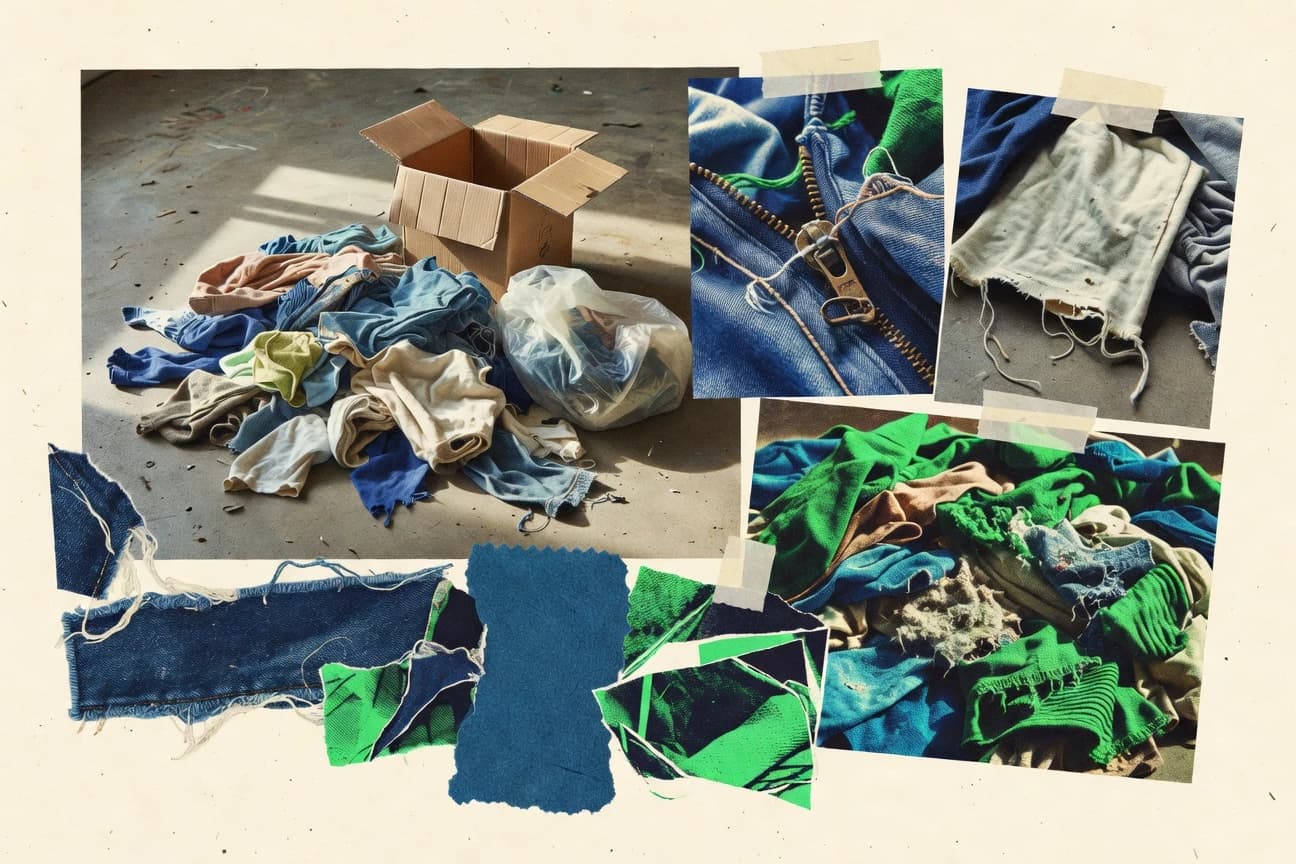
Clothing Waste Statistics
Americans now buy 5 times more clothing than in 1991, averaging 68 new items per person each year, yet only 12% of clothing waste is recycled globally and 73% still ends up in landfills or incinerators. This page connects why consumption keeps surging with what it costs, from 92 million tonnes of textile waste generated worldwide each year to the carbon, microplastics, and long decomposition timelines hidden behind everyday shopping.

Packaging Waste Statistics
Packaging waste policy is getting sharper just as public pressure grows, with EU landfill diversion now set to fall to 10% by 2035 and EU consumers reporting 55% concern about plastic waste in the 2019 Eurobarometer. But the gap between recycling promises and plastic reality is stark, since only 1 in 5 plastic bottles is recycled in Europe and EU packaging waste generated stands at 173.5 kg per person, making the page a practical snapshot of what is changing and what still is not.
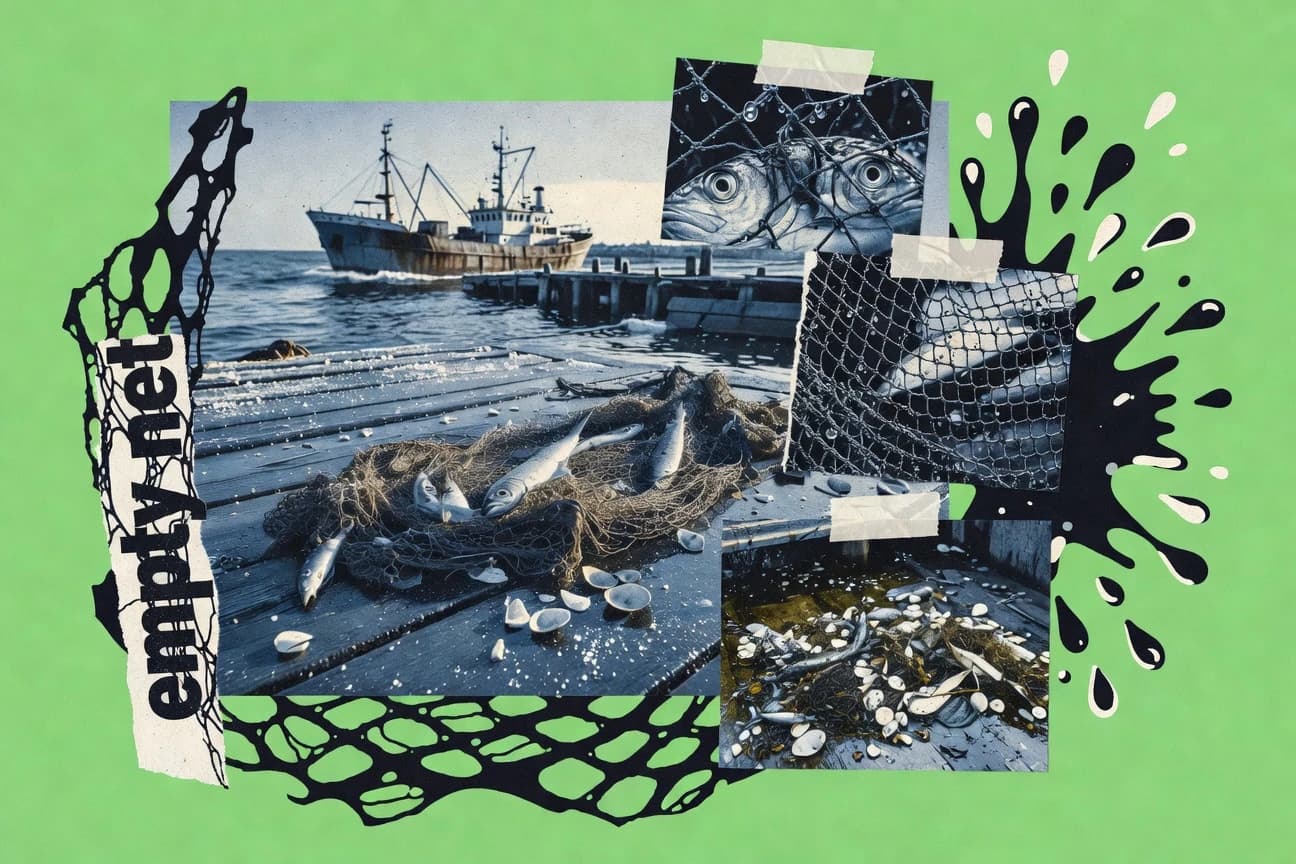
Overfishing Statistics
FAO’s most recent assessment says 33% of global fish stocks are overfished, a scale of overcapacity and overfishing pressure that is keeping many fisheries from rebuilding. The page connects how “fishing down the food web” lowers trophic levels, shows where declines are already severe, and quantifies what policy changes like cutting harmful subsidies and tightening enforcement could return for stocks, seafood supply, and profits.
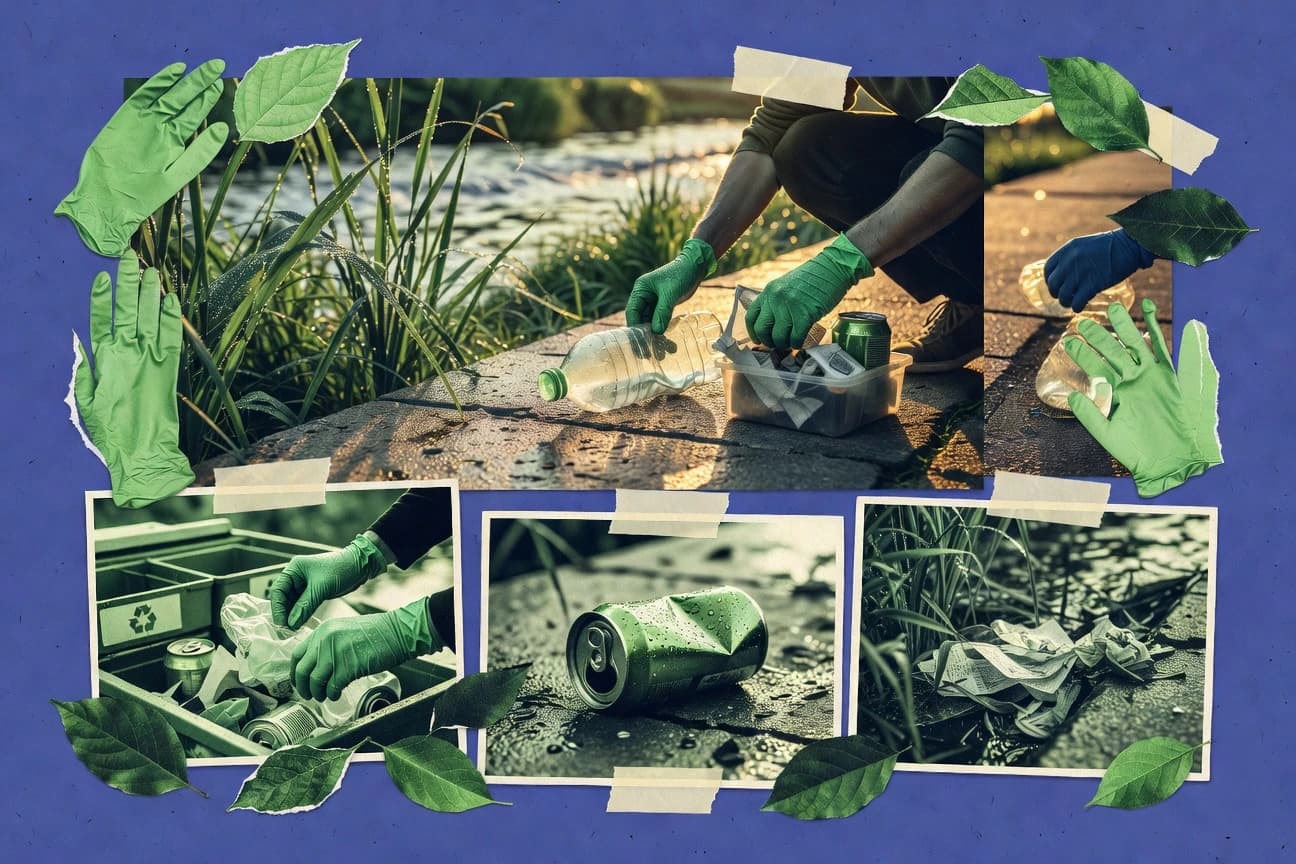
Environmental Awareness Statistics
Climate concern is no longer a niche topic with 61% of US consumers naming climate change a top priority and 42% of people in the US taking practical steps like using reusable bags most of the time. Yet the gap between awareness and action still shows up, from 32% of US household recycling to 48% of EU respondents changing purchases recently, making this page a useful reality check on where engagement is strengthening and where it stalls.
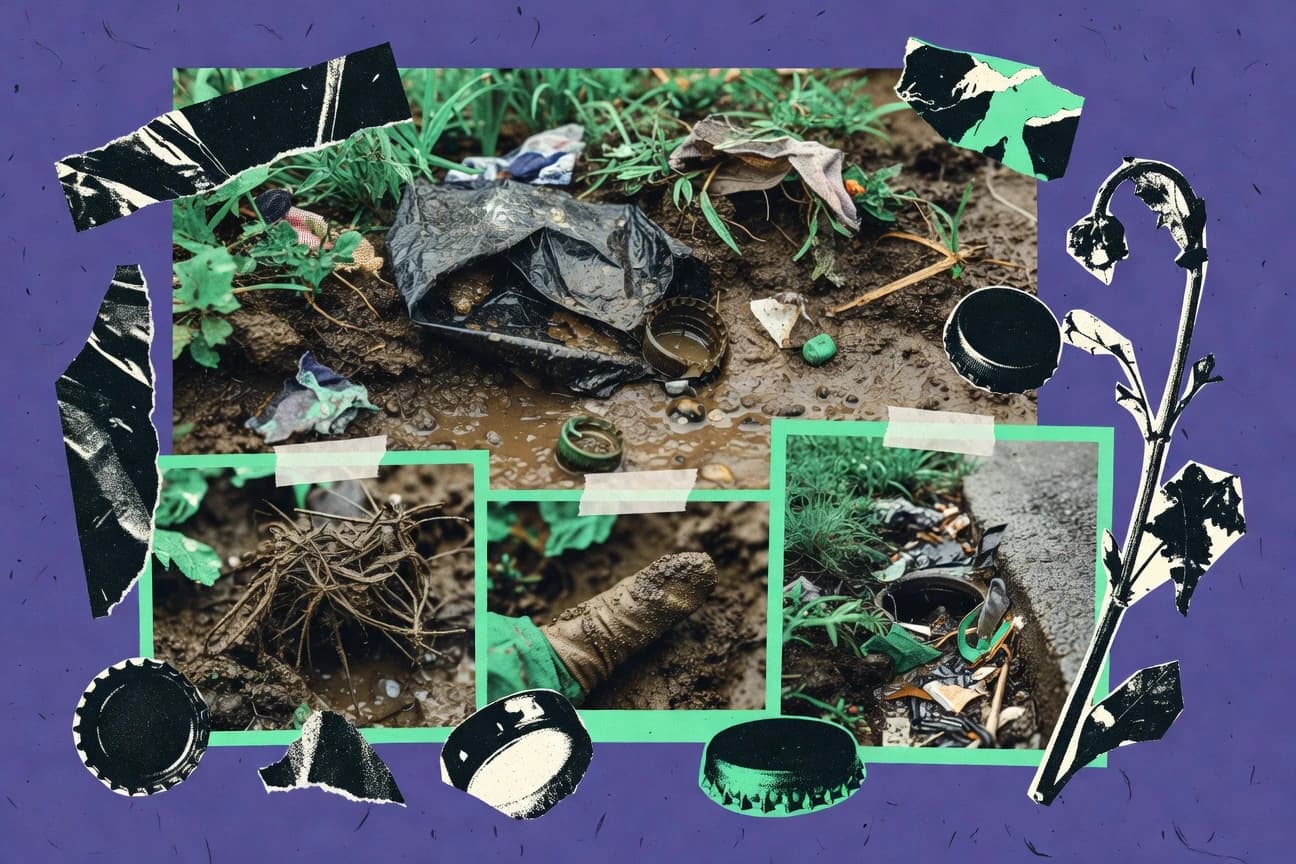
Land Pollution Statistics
Land pollution is hitting with fresh urgency as 2026 figures show how persistent waste and contaminated soils keep expanding, even as regulation tightens. Read the page to see the sharp gaps between where contamination is measured and where risk is actually felt, and what that mismatch means for communities.

Poaching In Africa Statistics
Elephants are still being killed at an average pace of 31,000+ per year in the late 2010s, yet the page pinpoints what makes poaching worse and what actually shrinks it, from where enforcement gaps open and cost protected areas $150–$250 million annually to why more patrol days and better ranger support can cut losses by measurable margins. You also get hard logistics and forensics, including how 1 in 5 major seizures looks linked to poached wildlife, what it costs to intercept shipments on a key corridor, and how DNA, drones, and community patrols change the odds for traffickers.
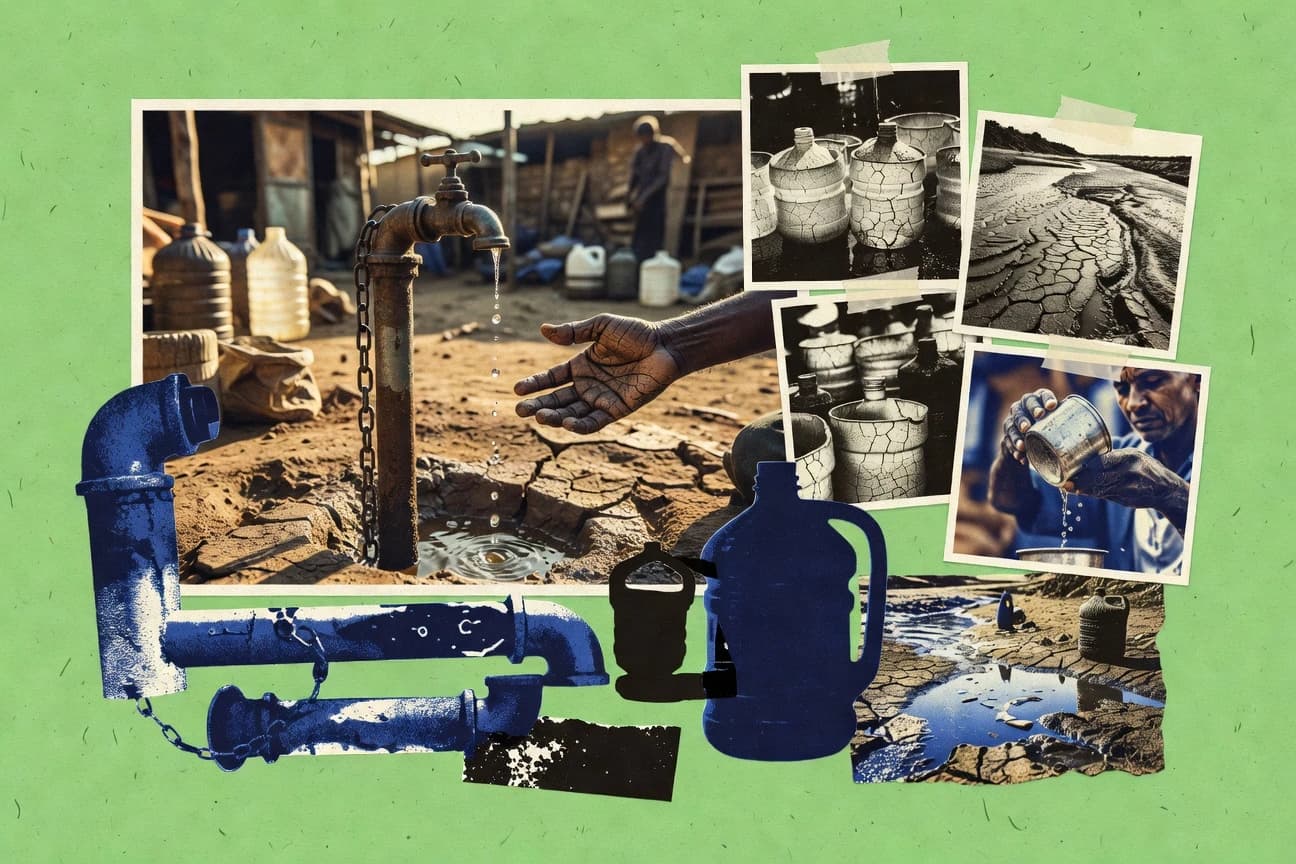
Global Water Crisis Statistics
Even when the world has clean water on paper, millions are still shut out of basic safety. This page pairs 2020 figures like 785 million people lacking basic drinking water and 23% living in water stressed countries with the cost side of the crisis so you can see how shortages, flooding risk, and untreated wastewater translate into health, schools, and economies.

Gas Emissions Statistics
Methane cuts can reach a 70% reduction for coal mine VAM when oxidation systems perform as quantified by the IPCC, yet the emissions race still shows a projected 2.9 GtCO₂e gap in the pathways needed for 2°C. Follow how CO₂ still dominates at 54% of 2019 greenhouse gas emissions, while agriculture accounts for 29% of methane, and see what MRV, monitoring, and targeted investments are buying in real abatement.