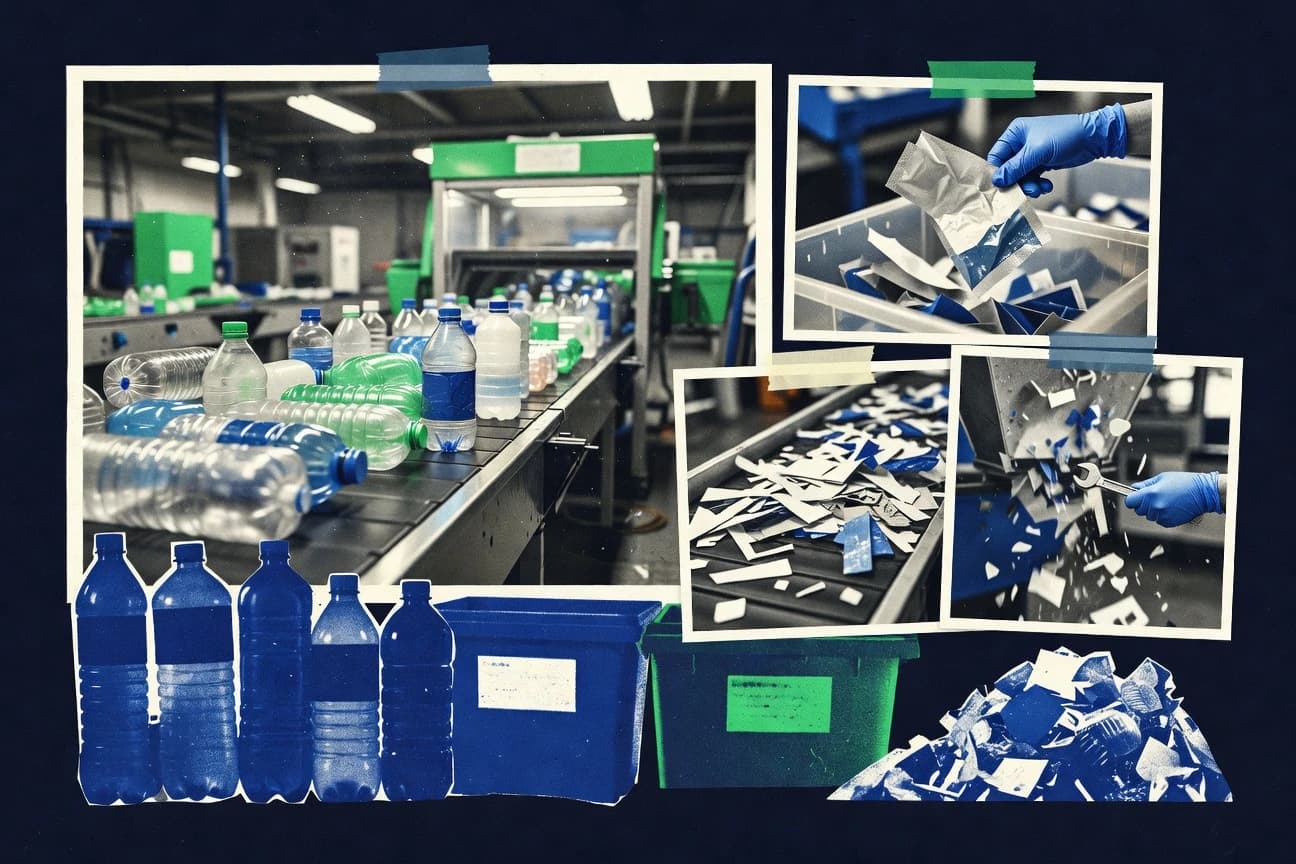

Advanced estimates put EU plastic recycling at between 1.2 and 1.9 million metric tons annually. Binding targets are pushing collection rates higher, but mechanical recycling yields typically only recover 70 to 90 percent of clean feedstock.
Key Takeaways
- 1.2–1.9 million metric tons per year of plastic were recycled in the EU (advanced estimates from 2016 baseline work), supporting demand for recyclates
- In the US, 32% of plastic was diverted from landfill in 2022 (recycling/composting share), determining available feed for recyclers
- In the US in 2018, 8.7 million metric tons of plastic packaging waste were generated, indicating a large supply of plastic that could be recovered
- EU member states had to reach a 50% municipal waste recycling target by 2020 (binding policy), influencing collection systems and plastic recycling inputs
- EU packaging recycling targets require 55% of plastic packaging waste to be recycled by 2030 (binding framework), increasing demand for plastic sorting and reprocessing
- The EU Single-Use Plastics Directive bans certain single-use plastic products (e.g., straws, cutlery) from 2021, reducing future recycling feedstock but improving waste prevention
- The global plastic recycling market was valued at $27.7 billion in 2023 and projected to reach $45.6 billion by 2030 (estimate), reflecting growth in reprocessing capacity and related services
- The global plastic recycling industry revenue was forecast to exceed $51 billion by 2031 (estimate), supporting trends in sorting, washing, and mechanical recycling
- The global waste management market is projected to reach $1.1 trillion by 2030 (estimate), providing tailwinds for recycling system build-out
- 8.3 million metric tons of plastic waste were generated in the United Kingdom in 2022, supporting the available domestic feedstock for plastic recycling and exports.
- The United States generated 35.4 million metric tons of total plastic waste in 2019, a baseline for how much plastic could be collected for recycling.
- About 79% of plastic waste is disposed via landfilling or incineration (global), indicating the dominant fate that limits recyclate supply.
- Spain recycled 35% of municipal waste in 2022, showing a lower baseline that can constrain plastic recycling system throughput.
- Mechanical recycling yields vary widely by polymer and process; a plastics recycling process review reports typical mechanical recycling yield ranges of roughly 70–90% for clean, sorted streams.
- Plastic recycling infrastructure is constrained by contamination: a peer-reviewed review reports contamination as a key technical barrier to recycling rates and recyclate quality for post-consumer plastics.
EU and US plastic recycling is rising, but targets, contamination, and market economics are the bottlenecks.
Related reading
01 · Category
Waste & Leakage4 stats
01
1.2–1.9 million metric tons per year of plastic were recycled in the EU (advanced estimates from 2016 baseline work), supporting demand for recyclates
02
In the US, 32% of plastic was diverted from landfill in 2022 (recycling/composting share), determining available feed for recyclers
03
In the US in 2018, 8.7 million metric tons of plastic packaging waste were generated, indicating a large supply of plastic that could be recovered
04
In 2019, the US recycled about 8.7% of plastic waste (national estimate), reflecting limited end-market demand and contamination
Interpretation
Waste & Leakage Interpretation
Across Waste and Leakage, the EU recycled about 1.2 to 1.9 million metric tons of plastic per year while the US generated 8.7 million metric tons of plastic packaging waste in 2018 but recycled only about 8.7% in 2019, showing that most plastic remains unrecovered and thus continues to pose leakage risk.
02 · Category
Policy & Regulation4 stats
01
EU member states had to reach a 50% municipal waste recycling target by 2020 (binding policy), influencing collection systems and plastic recycling inputs
02
EU packaging recycling targets require 55% of plastic packaging waste to be recycled by 2030 (binding framework), increasing demand for plastic sorting and reprocessing
03
The EU Single-Use Plastics Directive bans certain single-use plastic products (e.g., straws, cutlery) from 2021, reducing future recycling feedstock but improving waste prevention
04
EU plastic packaging demand for recycled plastics is projected to reach 10.3 million metric tons by 2030, reflecting expected system-wide scaling of recycling inputs.
Interpretation
Policy & Regulation Interpretation
Policy in the EU is tightening recycling rules fast, with member states required to hit a 50% municipal waste recycling target by 2020 and packaging now aiming for 55% of plastic waste recycled by 2030, while the Single Use Plastics Directive starting in 2021 and the expected 10.3 million metric tons of recycled plastic demand by 2030 push collection and recycling systems to scale.
03 · Category
Market Size4 stats
01
The global plastic recycling market was valued at $27.7 billion in 2023 and projected to reach $45.6 billion by 2030 (estimate), reflecting growth in reprocessing capacity and related services
02
The global plastic recycling industry revenue was forecast to exceed $51 billion by 2031 (estimate), supporting trends in sorting, washing, and mechanical recycling
03
The global waste management market is projected to reach $1.1 trillion by 2030 (estimate), providing tailwinds for recycling system build-out
04
The global market for plastic waste management services reached about $120 billion in 2023, illustrating the spending ecosystem that funds sorting, collection, and recycling operations.
Interpretation
Market Size Interpretation
For the market size angle, the plastic recycling sector is expanding fast, growing from $27.7 billion in 2023 to a projected $45.6 billion by 2030 and with industry revenue forecasts topping $51 billion by 2031, signaling large and accelerating investment demand.
04 · Category
Feedstock Supply2 stats
01
8.3 million metric tons of plastic waste were generated in the United Kingdom in 2022, supporting the available domestic feedstock for plastic recycling and exports.
02
The United States generated 35.4 million metric tons of total plastic waste in 2019, a baseline for how much plastic could be collected for recycling.
Interpretation
Feedstock Supply Interpretation
From a feedstock supply standpoint, the UK generated 8.3 million metric tons of plastic waste in 2022 while the US produced 35.4 million metric tons in 2019, underscoring that large volumes of available waste can underpin plastic recycling feedstock needs at a national scale.
More related reading
05 · Category
Performance Metrics3 stats
01
About 79% of plastic waste is disposed via landfilling or incineration (global), indicating the dominant fate that limits recyclate supply.
02
Spain recycled 35% of municipal waste in 2022, showing a lower baseline that can constrain plastic recycling system throughput.
03
Mechanical recycling yields vary widely by polymer and process; a plastics recycling process review reports typical mechanical recycling yield ranges of roughly 70–90% for clean, sorted streams.
Interpretation
Performance Metrics Interpretation
From a Performance Metrics perspective, the fact that about 79% of global plastic waste is landfilled or incinerated helps explain why municipal recycling rates lag, with Spain still recycling only 35% of municipal waste in 2022.
06 · Category
Cost Analysis3 stats
01
Plastic recycling infrastructure is constrained by contamination: a peer-reviewed review reports contamination as a key technical barrier to recycling rates and recyclate quality for post-consumer plastics.
02
A life-cycle assessment study of chemical recycling reported that energy use is a major contributor to environmental impacts, with heating and processing steps driving the footprint.
03
A peer-reviewed study reports that plastic recycling economics are sensitive to fossil fuel prices and gate fees, with profit margins compressing when virgin polymer prices fall relative to recyclate costs.
Interpretation
Cost Analysis Interpretation
Cost analysis of plastic recycling shows that profits and feasibility can swing sharply because contamination limits technical performance, energy intensive chemical recycling drives a large share of impacts, and recycling economics are especially sensitive to changes in fossil fuel prices and gate fees that directly affect profit margins.
07 · Category
Industry Trends3 stats
01
The OECD projects that, without additional action, global plastic recycling rates will not keep pace with waste growth, leaving a widening disposal gap.
02
Sorting capacity for plastic packaging in the EU is expanding: industry data reports that EU optical sorting capacity additions have increased by double-digit percentages since 2019, supporting better feedstock quality for recycling.
03
A 2021 report by the International Energy Agency (IEA) estimates that plastic production and waste could grow rapidly without stronger policies, increasing the future need for recycling and waste management investment.
Interpretation
Industry Trends Interpretation
Industry trends indicate that even with expanding EU optical sorting capacity, the OECD warns global plastic recycling rates are unlikely to keep pace with rising waste, and the IEA projects plastic production and waste could grow rapidly without stronger policies.
report visual · Key figures
Plastic recycling: feedstock, diversion, and policy targets
Recycling performance varies, but EU binding targets and expanding sorting capacity are driving higher demand and system scaling.
32%
In the US, 32% of plastic was diverted from landfill in 2022 (recycling/composting share), determining available feed fo
8.7%
In 2019, the US recycled about 8.7% of plastic waste (national estimate), reflecting limited end-market demand and conta
50%
EU member states had to reach a 50% municipal waste recycling target by 2020 (binding policy), influencing collection sy
55%
EU packaging recycling targets require 55% of plastic packaging waste to be recycled by 2030 (binding framework), increa
2019
Sorting capacity for plastic packaging in the EU is expanding: industry data reports that EU optical sorting capacity ad
source-verifiedepa.gov · eur-lex.europa.eu · fraunhofer.de2030
Reference
Cite This Report
This report is designed to be cited. We maintain stable URLs and versioned verification dates. Copy the format appropriate for your publication below.
APA
Elif Demirci. (2026, February 13). Plastic Recycling Statistics. Gitnux. https://gitnux.org/plastic-recycling-statistics
MLA
Elif Demirci. "Plastic Recycling Statistics." Gitnux, 13 Feb 2026, https://gitnux.org/plastic-recycling-statistics.
Chicago
Elif Demirci. 2026. "Plastic Recycling Statistics." Gitnux. https://gitnux.org/plastic-recycling-statistics.
Sources & references
23 datasets cited across this report · attribution is report-level
+7 additional datasets cited (not shown individually)