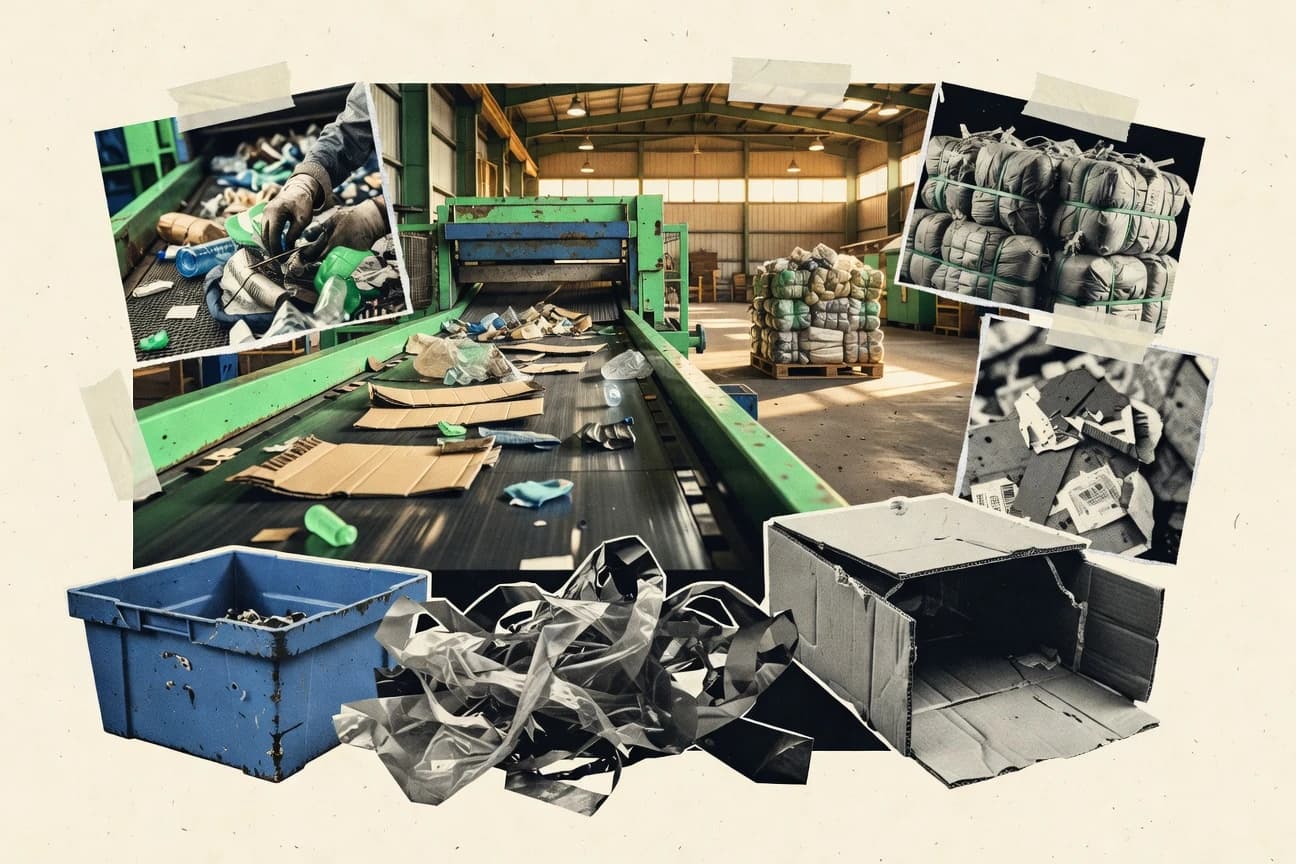

Recycling supply chains respond directly to measured differences in material recovery. The United States processes 69 percent of paper waste but only 24 percent of plastics from municipal solid waste. These rates coincide with a global recycling market size of 424 billion dollars.
Key Takeaways
- In 2018, the U.S. recycled 69% of paper and 24% of plastics generated as MSW (EPA), directly impacting operational volumes and sorting infrastructure planning
- 31% of companies in a logistics technology survey cited higher fuel efficiency benefits from telematics, relevant to recycling supply-chain transport costs
- In Germany, DPG/dual system data reported packaging recycling rates of 80%+ for several container streams in 2021 (as reported in the monitoring report), indicating strong operational performance in upstream recovery
- In 2021, the EU’s Packaging Waste Regulation supported a higher collection and recycling ambition, with targets leading toward at least 55% packaging waste recycled by 2030—driving long-term procurement and logistics planning
- The EU Landfill Directive target is to reduce landfilling to 10% of municipal waste by 2035, influencing diversion logistics for recyclables and recovered materials
- The European Commission reported that the circular economy could help reduce primary resource use by 28% by 2030—affecting long-run material supply needs for recycling systems
- $55.5 billion global secondary materials market size in 2021 (as reported by the source), relevant to the downstream value that drives collection and processing networks
- $424.0 billion global recycling market size forecast for 2030 (as reported by the source), indicating future supply-chain scale pressures
- $556.0 billion global waste management market size in 2023 (as reported by the source), reflecting the financial scope behind waste-to-recycling flows
- In a global review, material recovery from waste is often cost-competitive when commodity prices are above a threshold—reported as a sensitivity of economics to commodity price changes of around 20%–30% in the cited modeling
- Waste management costs in OECD countries averaged 1.7% of household expenditure in 2018 (as reported in OECD data/analysis), influencing residential-to-collection economics for recycling systems
- A study on plastic recycling economics reported that at current mixed-plastic prices, the cost of sorting and contamination can exceed revenue, with negative net margins under certain price scenarios (reported modeling ranges)
- In the OECD, global trade in waste faced disruptions with documented volatility during COVID-19; one report quantified international waste shipments dropping by around 20% in early 2020 for some waste categories (as reported in the study)
- China’s 2018 National Sword policy led to a substantial reduction in imported mixed paper and plastics; one OECD report quantified that imports declined by about 70% for some materials after the restrictions
- The Basel Convention reports that hazardous waste misclassification is an ongoing risk, with enforcement issues in transboundary shipments; in one analysis, illegal shipments accounted for a notable share (quantified in the report as a fraction of inspected consignments)
Supply chain success in recycling hinges on policy targets, feedstock quality, and volatile markets shaping collection, sorting, and costs.
Related reading
01 · Category
Operational Efficiency10 stats
01
In 2018, the U.S. recycled 69% of paper and 24% of plastics generated as MSW (EPA), directly impacting operational volumes and sorting infrastructure planning
02
31% of companies in a logistics technology survey cited higher fuel efficiency benefits from telematics, relevant to recycling supply-chain transport costs
03
In Germany, DPG/dual system data reported packaging recycling rates of 80%+ for several container streams in 2021 (as reported in the monitoring report), indicating strong operational performance in upstream recovery
04
Recycling of construction and demolition waste is reported to be 70% in the EU, reflecting processing throughput that shapes recycling supply chains
05
The EU’s Circular Economy Action Plan includes an objective to increase recycling and reduce landfill, which affects operational efficiency targets for sorting, collection, and processing (targeted policy schedule through 2030)
06
A life-cycle assessment study found that recycling aluminum saves about 95% of the energy compared with producing primary aluminum, guiding operational energy-efficiency economics in metal recycling supply chains
07
A life-cycle assessment study reported that recycling steel saves about 56% of energy versus primary production, affecting operational decisions in ferrous material chains
08
A 2021 study found that improving recycling collection to higher capture rates can reduce environmental impacts of plastics by up to 50% in modeled scenarios (reported in the study results)
09
Use of robots in waste sorting is increasing: a market/industry report projected that automated sorting systems would grow at a CAGR of around 10%–15% through the early 2020s, indicating uptake in recycling facilities
10
In China, waste sorting pilots reported that mechanical pre-sorting plus optical sorting can achieve 20%–40% reductions in contamination for certain streams (as measured in pilot evaluations reported by the source)
Interpretation
Operational Efficiency Interpretation
Operational efficiency in the recycling supply chain is being driven by strong diversion and energy performance, with the EU recycling 70% of construction and demolition waste and aluminum recycling cutting energy use by about 95% versus primary production.
02 · Category
Industry Trends3 stats
01
In 2021, the EU’s Packaging Waste Regulation supported a higher collection and recycling ambition, with targets leading toward at least 55% packaging waste recycled by 2030—driving long-term procurement and logistics planning
02
The EU Landfill Directive target is to reduce landfilling to 10% of municipal waste by 2035, influencing diversion logistics for recyclables and recovered materials
03
The European Commission reported that the circular economy could help reduce primary resource use by 28% by 2030—affecting long-run material supply needs for recycling systems
Interpretation
Industry Trends Interpretation
Industry trends in recycling are being accelerated by EU policy momentum, with targets pushing collection and recycling toward at least 55% under the Packaging Waste Regulation and aiming to cut landfilling to just 10% of municipal waste by 2035, while the circular economy is projected to reduce primary resource use by 28% by 2030.
03 · Category
Market Size5 stats
01
$55.5 billion global secondary materials market size in 2021 (as reported by the source), relevant to the downstream value that drives collection and processing networks
02
$424.0 billion global recycling market size forecast for 2030 (as reported by the source), indicating future supply-chain scale pressures
03
$556.0 billion global waste management market size in 2023 (as reported by the source), reflecting the financial scope behind waste-to-recycling flows
04
In 2022, U.S. overall recycling rate for all materials was 32.1% (as reported by the EPA’s national overview), which defines the recoverable supply pool
05
In 2022, the U.S. composted 60.2 million tons of MSW (as reported in EPA’s 2022 MSW facts and figures), relevant to organic material supply chains tied to recycling
Interpretation
Market Size Interpretation
The market size signals rapid scale-up and strong downstream pull in recycling supply chains, with the global secondary materials market reaching $55.5 billion in 2021 and the recycling market forecast to grow to $424.0 billion by 2030, while the broader waste management sector was valued at $556.0 billion in 2023.
More related reading
04 · Category
Cost Analysis5 stats
01
In a global review, material recovery from waste is often cost-competitive when commodity prices are above a threshold—reported as a sensitivity of economics to commodity price changes of around 20%–30% in the cited modeling
02
Waste management costs in OECD countries averaged 1.7% of household expenditure in 2018 (as reported in OECD data/analysis), influencing residential-to-collection economics for recycling systems
03
A study on plastic recycling economics reported that at current mixed-plastic prices, the cost of sorting and contamination can exceed revenue, with negative net margins under certain price scenarios (reported modeling ranges)
04
In 2019, North America’s prices for recycled PET varied by grade with major swings, affecting recycling margins; the reported index showed changes of more than 30% over the year
05
Commingled recycling contamination can reduce recovered material value by a multiple; a study reported that contamination levels can reduce recyclate quality and value by over 50% for some streams
Interpretation
Cost Analysis Interpretation
Cost analysis shows that recycling economics are highly sensitive to market conditions and contamination levels, with waste management averaging 1.7% of household expenditure in OECD countries in 2018 and with sorting and contamination costs for plastics sometimes exceeding potential revenues when prices are not high enough, squeezing margins across regions.
05 · Category
Supply Chain Risks9 stats
01
In the OECD, global trade in waste faced disruptions with documented volatility during COVID-19; one report quantified international waste shipments dropping by around 20% in early 2020 for some waste categories (as reported in the study)
02
China’s 2018 National Sword policy led to a substantial reduction in imported mixed paper and plastics; one OECD report quantified that imports declined by about 70% for some materials after the restrictions
03
The Basel Convention reports that hazardous waste misclassification is an ongoing risk, with enforcement issues in transboundary shipments; in one analysis, illegal shipments accounted for a notable share (quantified in the report as a fraction of inspected consignments)
04
The World Bank estimated that 2 billion people lack access to waste management services, creating unstable, often informal supply inputs for recycling systems
05
The Basel Convention’s 2022 report notes that plastic waste is one of the most problematic waste streams for illegal shipments (quantified by share in several case studies)
06
A peer-reviewed study reported that recycling supply risks include quality variability: feedstock contamination can cause up to a ~20% reduction in yield for recycled polymers under typical mixed-feed conditions
07
Commodity price volatility for scrap affects recycling output planning; one report documented that scrap prices can swing by more than 25% within a year, influencing supply-chain economics
08
Recycling sorting and contamination risks are material: a study measured that contamination in curbside recycling can range from 5% to 30% by weight, driving downstream yield loss
09
In the U.S., 18% of recycling is lost due to contamination or being landfilled/incinerated (reported in EPA materials characterization studies), affecting supply chain reliability
Interpretation
Supply Chain Risks Interpretation
Across the recycling supply chain, risks are being intensified by disruption and policy shocks, with COVID-19 causing documented volatility in global waste trade, China’s National Sword cutting imported mixed paper and plastics in 2018, and quality variability from contaminated feedstock cutting recycling output by up to about 20%, all of which feed directly into the “Supply Chain Risks” category.
report visual · Comparison
Where recycling capture and policy targets set supply-chain volume
Policy goals and measured recycling capture rates shape the volumes and quality requirements recycling supply chains must handle—from collection through sorting and processing.
In 2018, the U.S. recycled 69% of paper and 24% of plastics generated as MSW (EPA), directly impacting operational volum69%
In 2021, the EU’s Packaging Waste Regulation supported a higher collection and recycling ambition, with targets leading
55%
In 2022, U.S. overall recycling rate for all materials was 32.1% (as reported by the EPA’s national overview), which def
32.1%
In the U.S., 18% of recycling is lost due to contamination or being landfilled/incinerated (reported in EPA materials ch
18%
source-verifiedepa.gov · eur-lex.europa.eu2022
Reference
Cite This Report
This report is designed to be cited. We maintain stable URLs and versioned verification dates. Copy the format appropriate for your publication below.
APA
Samuel Norberg. (2026, February 13). Supply Chain In The Recycling Industry Statistics. Gitnux. https://gitnux.org/supply-chain-in-the-recycling-industry-statistics
MLA
Samuel Norberg. "Supply Chain In The Recycling Industry Statistics." Gitnux, 13 Feb 2026, https://gitnux.org/supply-chain-in-the-recycling-industry-statistics.
Chicago
Samuel Norberg. 2026. "Supply Chain In The Recycling Industry Statistics." Gitnux. https://gitnux.org/supply-chain-in-the-recycling-industry-statistics.
Sources & references
32 datasets cited across this report · attribution is report-level
+16 additional datasets cited (not shown individually)