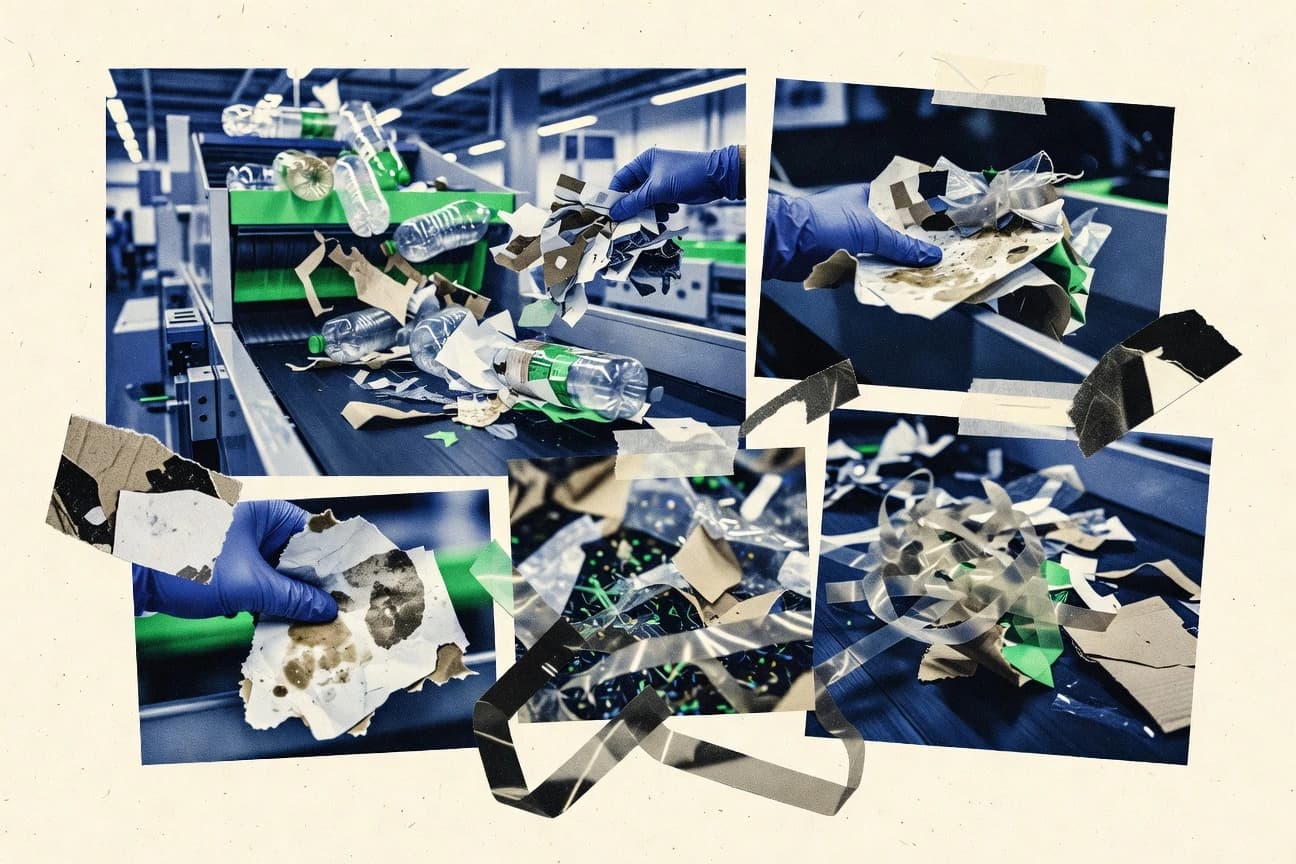

Municipal recycling programs report average contamination rates of 27.6 percent in single-stream systems. These rates generate annual processing and disposal costs exceeding one billion dollars in the United States alone. The statistics below identify the leading contaminants and measure their effects on operations and emissions.
Key Takeaways
- Food waste and residue contaminate 35% of paper and cardboard recyclables in US MRFs, per 2022 Carton Council study.
- In 2022, US municipal recycling programs reported an average contamination rate of 27.6% in single-stream systems, primarily due to improper sorting.
- Annual US recycling contamination costs municipalities $1.1 billion in processing and landfill fees, 2022 EPA.
- Contamination reduces US recycling rates by 10-15%, emitting extra 5M tons CO2 equivalent yearly, EPA 2022.
- Education campaigns reduce contamination by 15-20%, Seattle 2019-2023 data.
Many recyclables end up contaminated, causing more waste and less material to be successfully reused.
Related reading
01 · Category
Common Contaminants19 stats
01
Food waste and residue contaminate 35% of paper and cardboard recyclables in US MRFs, per 2022 Carton Council study.
02
Plastic bags comprise 16% of contaminants in US single-stream recycling, causing equipment jams, 2023 APR report.
03
In UK, 22% of recycling contamination from non-target plastics like films and bags, WRAP 2021.
04
Glass mixed with plastics accounts for 12% of contamination in California MRFs, 2022 CalRecycle.
05
Hazardous waste like batteries and electronics make up 4.5% of contaminants in residential recycling, EPA 2022.
06
Textiles and clothing contaminate 8.7% of recycling streams in NYC, 2023 DSNY audit.
07
Medical waste including sharps found in 2.1% of curbside recycling in Toronto 2022.
08
Polystyrene foam (Styrofoam) constitutes 9.3% of contaminants in Seattle recycling, 2023.
09
Organic waste residues on 28% of recyclables in Australian bins, APCO 2022.
10
Wishful thinking items like toys and utensils: 11.4% in Portland OR recycling, 2021.
11
Aluminum foil and scrap metal scraps: 6.2% contamination in EU paper streams, Eurostat 2022.
12
Diapers and sanitary products: 5.8% in Chicago multi-family recycling, 2022.
13
Contaminated pizza boxes: 19% of cardboard contamination nationally US, Pizza Box Recovery 2023.
14
Single-use coffee cups: 7.5% in Vancouver office recycling, 2023 Metro Vancouver.
15
Garden hoses and garden waste: 4.9% in Boston spring audits, 2022.
16
Shredded paper mixed with non-paper: 3.7% contamination issue in Germany, 2021.
17
Motor oil containers not rinsed: 2.8% in San Francisco audits, 2023.
18
Pet waste bags: 6.1% in Florida residential recycling, 2022.
19
Frozen food boxes with residue: 14.2% of paperboard contamination, IFCO 2021.
Interpretation
Common Contaminants Interpretation
Despite our best intentions, our recycling bins have become tragicomic cabinets of curiosity where yesterday's pizza box cozies up to a rogue battery, a petrified garden hose, and a single, stubborn spoon that collectively cripple the entire recovery process.
02 · Category
Contamination Rates20 stats
01
In 2022, US municipal recycling programs reported an average contamination rate of 27.6% in single-stream systems, primarily due to improper sorting.
02
A 2021 study in New York City found 23% of curbside recycling bins contained non-recyclable plastics, leading to 18% rejection at facilities.
03
UK's Waste and Resources Action Programme (WRAP) reported 12.4% contamination in kerbside recycling collections in England during 2020.
04
In California, 2023 audits showed 25.2% contamination rate in residential recycling, with food residue on 14% of paper items.
05
Seattle's 2022 recycling contamination averaged 19.8%, down from 24% in 2019 due to education campaigns.
06
Australia's National Plastics Summit 2021 data indicated 28% contamination in yellow-lid bins across major cities.
07
Toronto's 2023 blue bin audit revealed 21.5% contamination, mostly soft plastics at 11%.
08
In 2021, Portland Oregon recycling facilities rejected 22.3% of loads due to contamination exceeding 10% threshold.
09
EU average recycling contamination was 17.9% in 2022 per Eurostat, highest in Southern Europe at 23%.
10
Chicago's 2022 ward audits showed 26.1% contamination in multi-family recycling streams.
11
Vancouver Canada's 2023 report noted 18.7% contamination, with 9% from bagged recyclables.
12
Germany's 2021 dual system recycling had 14.2% contamination, lower than EU average due to deposit schemes.
13
Boston 2022 audits: 24.8% contamination rate, plastics films at 12.5%.
14
Japan's municipal recycling contamination stood at 15.6% in 2022, per Ministry of Environment.
15
San Francisco's zero waste program reported 16.3% contamination in 2023 audits.
16
Florida statewide average contamination 29.4% in 2021 MRF reports.
17
Sweden's 2022 recycling purity was 85.1%, implying 14.9% contamination.
18
Denver Colorado 2023: 20.5% contamination, glass breakage contributing 8%.
19
Netherlands 2021: 13.8% contamination in PMD fraction (plastics, metals, drinks cartons).
20
Atlanta Georgia 2022: 27.2% contamination rate in single-stream.
Interpretation
Contamination Rates Interpretation
Despite our good intentions, we are collectively treating recycling bins like magical closets where we hide our guilt, resulting in a quarter of our efforts being thrown away across the globe.
03 · Category
Economic Costs19 stats
01
Annual US recycling contamination costs municipalities $1.1 billion in processing and landfill fees, 2022 EPA.
02
Single-stream MRFs spend $50-100 per ton extra on contamination removal, NAC 2023.
03
UK recycling contamination leads to £300 million annual losses for local authorities, WRAP 2022.
04
California loses $200 million yearly rejecting contaminated loads to landfills, CalRecycle 2023.
05
Seattle haulers charge 15% premium on contaminated recycling routes, 2022 city report.
06
Toronto diverts 10% less recyclables due to contamination, costing $45M CAD annually, 2023.
07
National average: contamination adds $12per ton processing cost in US MRFs, 2021 RRS.
08
Portland OR landfill diversion fees rise 20% from rejected recycling, 2022 budget.
09
EU member states incur €2.5 billion in contamination-related waste management costs yearly, EEA 2022.
10
Chicago rejects 25% of recycling loads, costing $30M in disposal 2022.
11
Vancouver's contamination causes $15M extra sorting costs per year, 2023.
12
Germany's contamination rejects cost industry €400M annually, Duales System 2021.
13
Boston pays $8.5M extra for contamination disposal in FY2023.
14
Japan recycling contamination leads to ¥50 billion losses, MOE 2022.
15
San Francisco's Recology reports $25/ton contamination surcharge, 2023.
16
Florida counties spend $150M on landfill due to poor recycling quality, 2022.
17
Sweden's low contamination saves €100M yearly vs EU average, Avfall Sverige 2023.
18
Denver adds $10M to budget for contamination remediation, 2023.
19
Netherlands PMD contamination costs €250M in sorting, RVO 2022.
Interpretation
Economic Costs Interpretation
Our collective casualness at the bin is a staggeringly expensive global error, quietly siphoning billions from public coffers one misplaced pizza box at a time.
More related reading
04 · Category
Environmental Effects17 stats
01
Contamination reduces US recycling rates by 10-15%, emitting extra 5M tons CO2 equivalent yearly, EPA 2022.
02
Landfilled contaminated recyclables release 1.2 tons methane per ton paper equivalent, IPCC 2021.
03
UK's contaminated recycling contributes 2.5Mt CO2e annually, WRAP 2023.
04
California MRF rejections landfill 300k tons/year, equivalent to 200k cars emissions, 2022.
05
Seattle contamination leads to 50k tons extra landfill, 12k tons CO2, 2023.
06
Plastic bag contamination pollutes 1 in 5 bales exported, harming ocean via microplastics, 2022 APR.
07
Toronto's 21% contamination adds 100k tons GHG emissions yearly, 2023.
08
EU contamination causes 15Mt CO2e extra from incineration/landfill, 2022.
09
Chicago landfilled 150k tons contaminated recyclables, 80k tons CO2e, 2022.
10
Food residue contamination promotes methane in landfills at 25% higher rate, USDA 2021.
11
Vancouver contamination equates to 30k tons CO2, like 6k cars off road, 2023.
12
Germany's glass-paper mix contamination leaches toxins into soil, 5% higher leachate, 2022.
13
Boston's rejection rates add 40k tons landfill, polluting groundwater, 2023.
14
Polystyrene contamination releases 3x more toxins when landfilled vs recycled, EPA.
15
San Francisco avoids 1M tons GHG via low contamination, vs 2.5M if average, 2022.
16
Florida contamination contributes 200k tons CO2 from extra trucking/landfill, 2023.
17
Sweden's clean recycling saves 3Mt CO2e vs contaminated scenarios, 2022.
Interpretation
Environmental Effects Interpretation
From Seattle's extra landfill to Germany's toxic leachate, our sloppy recycling bins are not just a local eyesore but a global climate furnace, baking our planet with millions of avoidable tons of greenhouse gases because we can't seem to keep the greasy pizza box out of the blue cart.
05 · Category
Reduction Strategies18 stats
01
Education campaigns reduce contamination by 15-20%, Seattle 2019-2023 data.
02
Dual-stream systems lower contamination to 10% vs 25% single-stream, NAC study 2022.
03
Clear labeling on bins cuts contamination 12%, UK WRAP trial 2021.
04
Deposit return schemes reduce beverage container contamination by 95%, Germany 2023.
05
Camera audits and feedback to residents drop rates 18%, Toronto pilot 2022.
06
Pay-as-you-throw programs reduce contamination 22%, Portland OR 2021.
07
Automated sorting tech removes 30% more contaminants, MRF 2023 upgrades.
08
School education programs yield 25% contamination drop in family bins, California 2022.
09
App-based sorting guides reduce errors 16%, EU RecycleNation app data 2023.
10
Multi-family building audits cut contamination 28%, Chicago 2022 program.
11
Bagging bans for recyclables lower contamination 14%, Vancouver 2023.
12
AI optical sorters achieve 98% purity, reducing residue 40%, AMP Robotics 2022.
13
Community clean-up events boost awareness, 19% drop in next audit, Boston 2023.
14
Standardized national guidelines cut contamination variance 11%, proposed US 2023.
15
Pre-sort incentives for haulers reduce loads by 17%, San Francisco model.
16
Digital tracking of bins flags high contamination early, 23% improvement, Netherlands 2022.
17
Composting education diverts organics, cutting residue contamination 31%, Florida 2023.
18
Retailer take-back for films reduces bag contamination 20%, US pilot 2022.
Interpretation
Reduction Strategies Interpretation
When you compare the humble sticker on a bin to the cold gaze of an AI camera, the unvarnished truth is that from clear instructions to cash incentives, nearly every tool we wield—education, better sorting, and smarter policy—proves that humans can learn to stop trashing their own recycling if you make it clear, make it easy, or, frankly, make it costly not to.
Reference
Cite This Report
This report is designed to be cited. We maintain stable URLs and versioned verification dates. Copy the format appropriate for your publication below.
APA
Emilia Santos. (2026, February 13). Recycling Contamination Statistics. Gitnux. https://gitnux.org/recycling-contamination-statistics
MLA
Emilia Santos. "Recycling Contamination Statistics." Gitnux, 13 Feb 2026, https://gitnux.org/recycling-contamination-statistics.
Chicago
Emilia Santos. 2026. "Recycling Contamination Statistics." Gitnux. https://gitnux.org/recycling-contamination-statistics.
Sources & references
49 datasets cited across this report · attribution is report-level