
Global food waste totals 1.3 billion tonnes each year. Seventeen percent of EU discards occur at the processing stage and increase upstream packaging volumes. Plastic accounts for 28 percent of global packaging waste while 72 percent of plastic packaging goes unrecycled.
Key Takeaways
- 17% of all food discarded in the EU is lost during the processing stage (before retail), which drives upstream packaging needs
- 1.3 billion tonnes per year is the estimated global food waste (about one-third of all food produced)
- 8.6 million tonnes of municipal waste are generated annually in the EU from food waste (a key driver of food-packaging waste alongside food itself)
- A 2023 survey found 61% of consumers are concerned about plastic packaging waste, influencing purchasing and packaging redesign pressure
- The EU Packaging and Packaging Waste Directive 94/62/EC sets targets for packaging recovery and recycling, including packaging waste from food sectors
- EU Member States must ensure that 90% of packaging is collected for recycling by 2030 under revised packaging waste rules (implemented via national transposition)
- In the EU, packaging waste recycling targets are increased by the 2018 directive amendments: plastic packaging recycling target reaches 50% by 2025 in the EU target set
- The global food packaging market is projected to reach $410.6 billion by 2030, driven by growth in packaged food and evolving sustainability requirements
- The global flexible packaging market is projected to reach $264.4 billion by 2030, heavily used for food products such as snacks and fresh produce films
- PET has a widely used recyclable role: PET bottle recycling yields an average global mechanical recycling output of about 80% purity for bottle-to-bottle in leading systems
- Cellulose-based packaging alternatives can reduce greenhouse gas emissions by 30% to 60% in some life-cycle assessments versus fossil-based plastics (context-dependent across systems)
- Compostable bioplastics can reduce litter persistence but only under industrial composting; many systems require 58°C for effective composting performance (system-dependent)
- Global sustainable packaging market size was $17.3 billion in 2023, reflecting investment into recyclable/lower-waste packaging alternatives including for food
- The global packaging market was valued at $1.05 trillion in 2023, with food packaging among the largest end-use segments
- The global plastic packaging market is forecast to reach about $367 billion by 2030, indicating continued investment pressure on plastics recycling for food packaging
With food waste driving extra packaging upstream, EU and global recycling efforts must scale fast to cut plastic impact.
Related reading
01 · Category
Waste Generation9 stats
01
17% of all food discarded in the EU is lost during the processing stage (before retail), which drives upstream packaging needs
02
1.3 billion tonnes per year is the estimated global food waste (about one-third of all food produced)
03
8.6 million tonnes of municipal waste are generated annually in the EU from food waste (a key driver of food-packaging waste alongside food itself)
04
28% of global packaging waste is plastic packaging (driving a large share of food-packaging waste through food distribution channels)
05
46% of EU citizens report that they generate food waste at home, highlighting demand patterns that increase food-packaging quantities
06
17% of municipal solid waste in the United States is food waste (leading indicator for associated packaging waste)
07
0.8% of global food supply is wasted in processing across OECD countries (upstream waste affecting packaging demand)
08
10.5% of EU packaging is plastic (placing the majority of food packaging waste drivers in context)
09
72% of plastic packaging waste is not recycled globally, which includes a large portion from food packaging
Interpretation
Waste Generation Interpretation
With food waste driving packaging needs at every step, the data show that 17% of EU food is lost during processing and nearly a third of global food is wasted overall, making food-packaging waste a systemic problem that starts long before retail.
02 · Category
Policy & Regulation8 stats
01
A 2023 survey found 61% of consumers are concerned about plastic packaging waste, influencing purchasing and packaging redesign pressure
02
The EU Packaging and Packaging Waste Directive 94/62/EC sets targets for packaging recovery and recycling, including packaging waste from food sectors
03
EU Member States must ensure that 90% of packaging is collected for recycling by 2030 under revised packaging waste rules (implemented via national transposition)
04
The EU directive 2019/904 requires separate collection targets for certain plastic waste fractions to be improved by Member States
05
France’s anti-waste law requires organizations to donate unsold food meeting eligibility rules, affecting packaging waste prevention upstream
06
California’s SB 54 requires brands to provide labeling for single-use packaging by July 1, 2023 (including food packaging), promoting reduction and recycling behavior
07
The EU’s “Essential Requirements” for packaging (under the Packaging and Packaging Waste Directive framework) require that packaging is designed to minimize presence of harmful substances
08
As of 2024, the EU’s Packaging and Packaging Waste Regulation proposal (CR) targets 10% reuse for packaging by 2030 (food-service and shipping packaging included depending on scope)
Interpretation
Policy & Regulation Interpretation
Across key policy frameworks, governments are tightening plastic and packaging rules with measurable targets such as the EU’s 90% collection for recycling by 2030 and California’s July 1, 2023 single use labeling requirement, reflecting how regulation is increasingly driving packaging redesign and waste prevention.
03 · Category
Industry Trends7 stats
01
In the EU, packaging waste recycling targets are increased by the 2018 directive amendments: plastic packaging recycling target reaches 50% by 2025 in the EU target set
02
The global food packaging market is projected to reach $410.6 billion by 2030, driven by growth in packaged food and evolving sustainability requirements
03
The global flexible packaging market is projected to reach $264.4 billion by 2030, heavily used for food products such as snacks and fresh produce films
04
In the EU, packaging waste recovery targets reach 60% to 65% for various material streams depending on the directive framework (food packaging streams included)
05
The OECD projects that plastic waste generation could reach 600 million tonnes per year by 2040 without intervention (includes food packaging plastics)
06
Smart packaging pilots: RFID and IoT enabled packaging trials increased supply-chain visibility by 30% in early deployments (helps reduce spoilage and waste)
07
The global food waste value chain loss is estimated at about $1.0 trillion per year in costs globally (drives packaging waste through discarded packaged food)
Interpretation
Industry Trends Interpretation
Industry trends show that while the EU is pushing plastic packaging recycling to 50% by 2018 amendments and raising overall recovery targets to 60% to 65%, global markets are still expanding rapidly, with the food packaging market projected to reach $410.6 billion by 2030 and smart RFID and IoT pilots improving supply chain visibility by 30% to help tackle the rising waste challenge.
More related reading
04 · Category
Materials & Substitution6 stats
01
PET has a widely used recyclable role: PET bottle recycling yields an average global mechanical recycling output of about 80% purity for bottle-to-bottle in leading systems
02
Cellulose-based packaging alternatives can reduce greenhouse gas emissions by 30% to 60% in some life-cycle assessments versus fossil-based plastics (context-dependent across systems)
03
Compostable bioplastics can reduce litter persistence but only under industrial composting; many systems require 58°C for effective composting performance (system-dependent)
04
RPET production for new bottles in Europe typically uses 10% to 30% recycled content depending on brand requirements and supply (food packaging feedstock)
05
In a comparative LCA, reusable rigid packaging can reduce total environmental impacts by 20% to 50% if reuse cycles exceed a break-even number (context-specific)
06
Bio-based polyethylene (bio-PE) can have lower fossil carbon intensity; one peer-reviewed study reports up to ~50% lower fossil resource use for bio-PE versus fossil PE under typical assumptions
Interpretation
Materials & Substitution Interpretation
For the Materials and Substitution angle, the data suggests meaningful climate and waste benefits are possible when shifting packaging systems, such as achieving around 80% purity in PET mechanical recycling, cutting greenhouse gas impacts by 30% to 60% with cellulose alternatives, and realizing up to 20% to 50% lower impacts with reuse once break even cycles are reached.
05 · Category
Market & Economics7 stats
01
Global sustainable packaging market size was $17.3 billion in 2023, reflecting investment into recyclable/lower-waste packaging alternatives including for food
02
The global packaging market was valued at $1.05 trillion in 2023, with food packaging among the largest end-use segments
03
The global plastic packaging market is forecast to reach about $367 billion by 2030, indicating continued investment pressure on plastics recycling for food packaging
04
The Ellen MacArthur Foundation’s 2017 report estimated global economic benefit of $1 trillion per year from adopting circular economy models, including packaging reuse/recycling
05
The cost of mismanaged plastic waste to economies (waste management and cleanup) is estimated at $8 billion annually in some policy analyses (global range varies; includes packaging)
06
The global composting market size was valued at $3.7 billion in 2023 (supporting compostable food packaging where systems exist)
07
$2.1 billion is the 2024 projected market value for food waste management solutions, linked to packaging-related reduction via waste prevention
Interpretation
Market & Economics Interpretation
In Market & Economics terms, food packaging is becoming a major investment battleground as the sustainable packaging market hit $17.3 billion in 2023 and the overall packaging market reached $1.05 trillion that same year, while plastics remain heavily financed with the plastic packaging market forecast to climb to about $367 billion by 2030 despite mismanaged plastic waste costing economies around $8 billion annually.
06 · Category
Technology & Adoption12 stats
01
EU-wide, advanced recycling (chemical recycling) is expected to expand, with one IEA/industry analysis estimating a significant capacity increase by 2030 (for mixed plastics including packaging)
02
Packaging films with barrier coatings: plasma treatment can reduce oxygen permeability by up to 30% in some food packaging studies (applied to extend shelf life and reduce waste)
03
RFID-enabled smart packaging adoption in logistics pilots can reduce inventory errors by 30% (improves food distribution efficiency and reduces waste, indirectly reducing packaging impacts)
04
Modified Atmosphere Packaging (MAP) extends shelf life: in many studies, MAP for fresh produce can extend shelf life by 2 to 3 days versus air for common items
05
Vacuum packaging can reduce oxidation and extend shelf life of meat products by 50% to 100% in controlled studies (reducing food waste and thus packaging discard)
06
A review paper reports that antimicrobial coatings in packaging can reduce microbial growth by 1 to 3 log units on food surfaces during storage
07
Near-infrared (NIR) sorting systems have demonstrated >95% accuracy for certain plastic resin identifications in industrial studies, helping recycling of packaging plastics
08
Recycling rates improve when manufacturers use clear labeling: a study found that labeling increased correct sorting rates by 20 percentage points for participants in controlled sorting tests
09
Thermal depolymerization processes can achieve monomer recovery efficiencies around 70% to 90% in lab-to-pilot demonstrations for certain polymers (packaging plastics)
10
Enzymatic recycling can convert PET with reported conversion yields of 80%+ under optimized conditions in peer-reviewed experiments, supporting future food packaging recyclability
11
Biodegradable coatings in compostable packaging show disintegration within weeks under industrial conditions; one standard-compatible study reported complete disintegration in 4 to 6 weeks
12
Digital waste tracking and EPR reporting: the EU waste shipment regulation (Regulation (EC) No 1013/2006) requires electronic reporting for cross-border shipments in many flows, improving packaging waste traceability
Interpretation
Technology & Adoption Interpretation
Under the Technology & Adoption angle, innovations in packaging are already showing measurable impact, from RFID-enabled pilots cutting inventory errors by 30% to MAP extending shelf life by 2 to 3 days and vacuum packaging doubling meat shelf life by 50% to 100%.
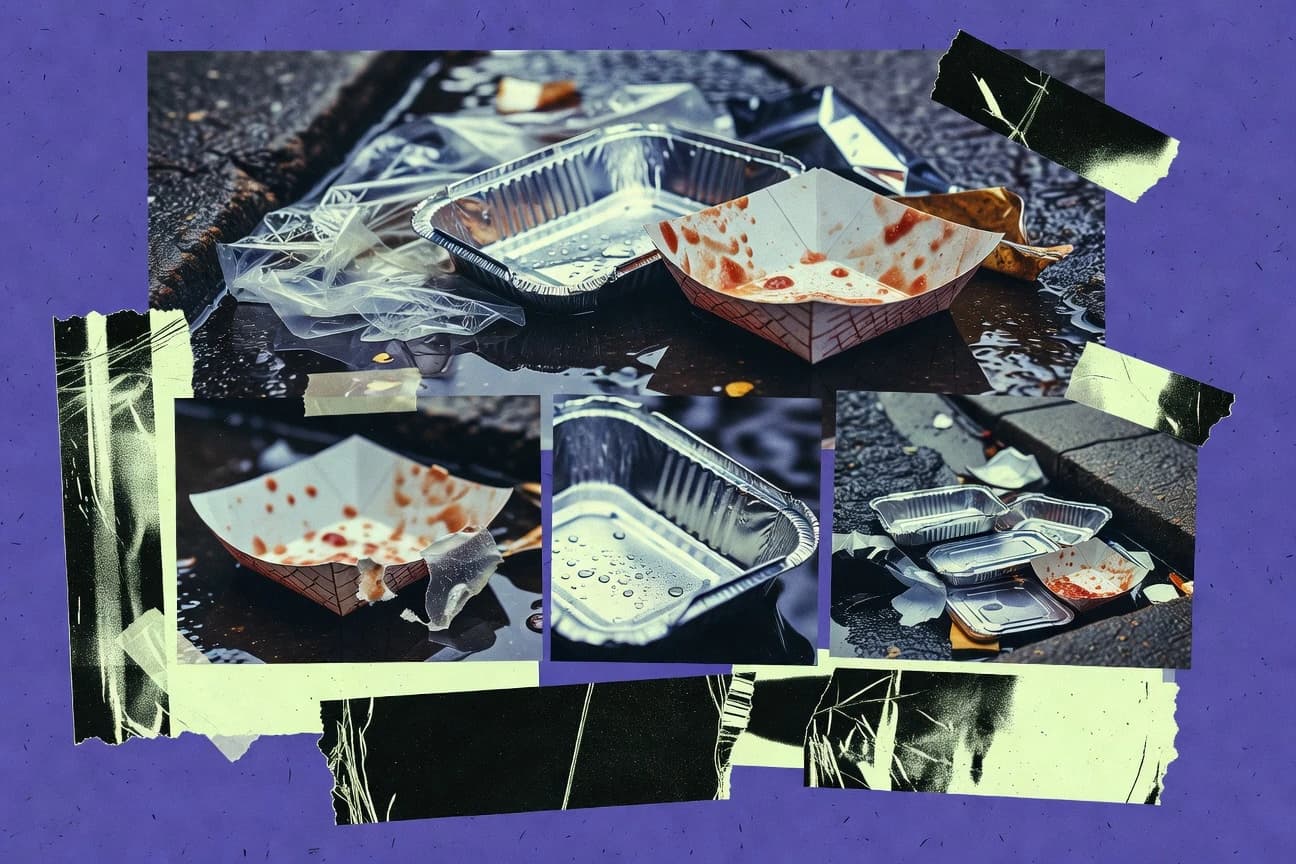
report visual · Breakdown
Where food waste becomes packaging pressure
Food loss upstream and plastic’s dominance in packaging waste combine to raise the demand for—while undermining the fate of—food packaging materials.
28%
28% of global packaging waste is plastic packaging (driving a large share of food-packaging waste through food distribut
72%
72% of plastic packaging waste is not recycled globally, which includes a large portion from food packaging
source-verifiedoecd.org
Reference
Cite This Report
This report is designed to be cited. We maintain stable URLs and versioned verification dates. Copy the format appropriate for your publication below.
APA
Marcus Afolabi. (2026, February 13). Food Packaging Waste Statistics. Gitnux. https://gitnux.org/food-packaging-waste-statistics
MLA
Marcus Afolabi. "Food Packaging Waste Statistics." Gitnux, 13 Feb 2026, https://gitnux.org/food-packaging-waste-statistics.
Chicago
Marcus Afolabi. 2026. "Food Packaging Waste Statistics." Gitnux. https://gitnux.org/food-packaging-waste-statistics.
Sources & references
49 datasets cited across this report · attribution is report-level
+22 additional datasets cited (not shown individually)