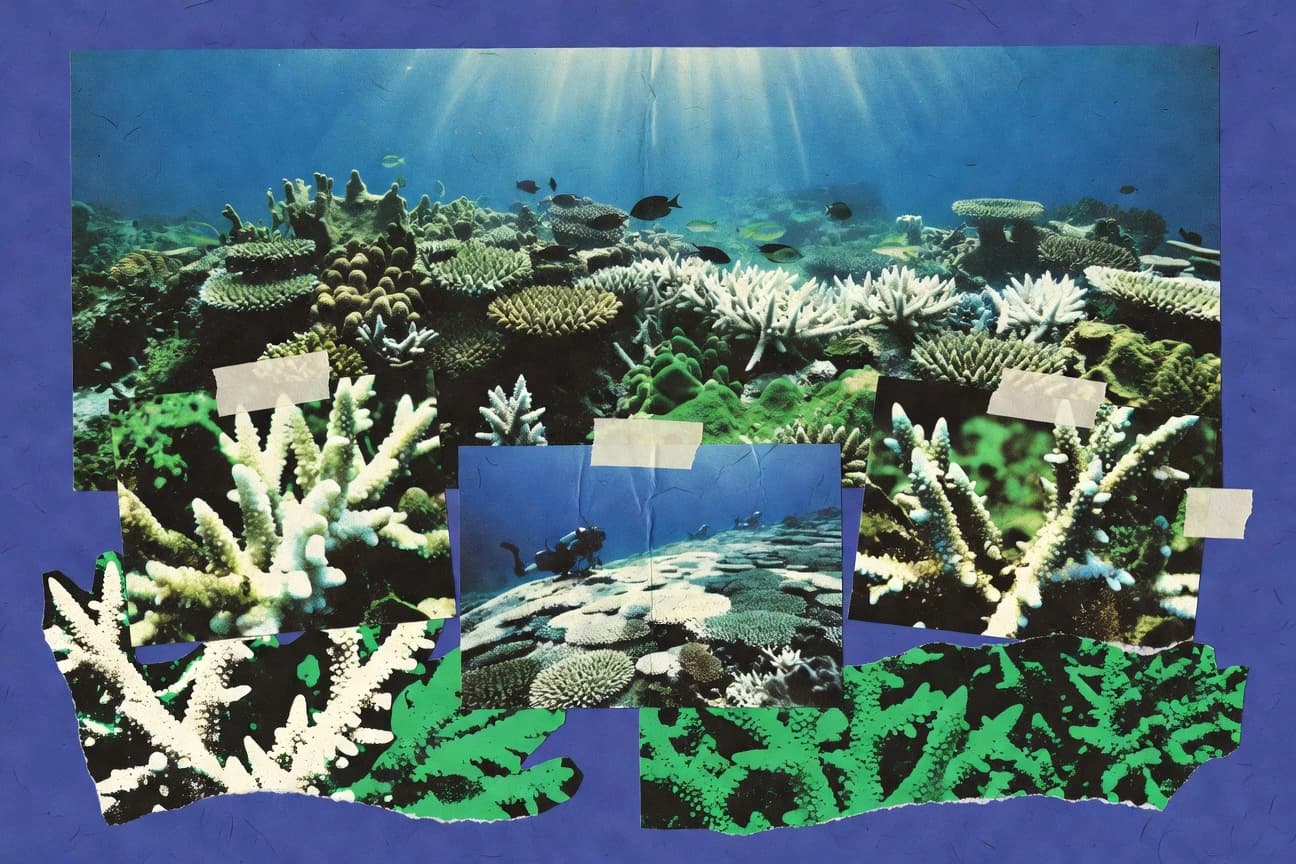

From January 2023 to March 2024, NOAA detected bleaching-level heat stress across 84% of surveyed reefs worldwide. The 2023 to 2024 event is now the fourth global bleaching on record, and it has already pushed major reef regions toward slower, incomplete recovery. Since 1980, global live coral cover has dropped from about 30% to 14% by 2019, leaving more reefs vulnerable to algal takeover after bleaching.
Key Takeaways
- Coral mortality reached 30-50% on GBR after 2016 bleaching
- Global live coral cover declined from 30% in 1980 to 14% in 2019
- Florida Keys lost 60% coral cover since 1980 due to bleaching
- The 2023-2024 global coral bleaching event is the fourth on record, with confirmed bleaching across over 84% of the world's reefs as of March 2024: June 2026
- From January 2023 to March 2024, NOAA detected bleaching-level heat stress in 84% of surveyed reefs globally, surpassing previous events
- Global coral bleaching events have occurred every 6 years on average since 1980, up from every 25-30 years previously
- GBR restoration efforts achieved 20% survival in transplanted corals post-bleaching
- Heat-hardened corals show 40% higher bleaching resistance
- 15% of bleached corals fully recover within 1 year globally
- Great Barrier Reef experienced its worst bleaching in 2024, with 81% of surveyed reefs affected
- In the Great Barrier Reef, 2022 bleaching affected 60% of reefs in the southern region
- Florida's reefs saw 90% bleaching in 2023, with over 1,000 km of reef impacted
- Sea surface temperatures exceeded 1°C above average during most bleaching events
- Degree Heating Weeks (DHW) >8 correlates with 50-100% coral mortality
- Marine heatwaves lasting >2 weeks cause widespread bleaching, occurring 50% more frequently since 2000
Across reefs worldwide, repeated marine heatwaves have driven major coral losses and mortality since 2016.
Related reading
01 · Category
Coral Mortality and Cover Loss24 stats
01
Coral mortality reached 30-50% on GBR after 2016 bleaching
02
Global live coral cover declined from 30% in 1980 to 14% in 2019
03
Florida Keys lost 60% coral cover since 1980 due to bleaching
04
Caribbean coral cover averaged 13% in 2019, down 50% since 1970s
05
Acropora corals declined 95% in Eastern Caribbean post-bleaching
06
Pacific reefs lost 50% cover between 2010-2020 from repeated bleaching
07
GBR northern sector lost 50% coral cover after 2016-2017 events
08
Hawaii lost 30% coral cover since 2014 bleaching
09
Maldives saw 70% mortality of tabular corals in 2016
10
Indian Ocean reefs lost 45% cover post-1998 bleaching
11
Bleached corals have 80% higher mortality if not recovering in 4 weeks
12
Branching corals mortality reached 90% at DHW>10
13
Global macroalgae cover increased 20% post-bleaching decline
14
USVI reefs lost 40% cover in 2024 bleaching
15
Seychelles mortality was 20-50% depth-dependent in 1998
16
Thailand Gulf reefs lost 60% cover since 2010
17
Micronesia outer reefs had 25% mortality in 2017
18
GBR central reefs lost 20-30% cover in 2022
19
Florida staghorn coral declined 98% since 1950s due to bleaching/disease
20
Pacific atolls lost 50-80% branching corals post-2015
21
Post-bleaching, 40% of corals fail to regain symbionts within months
22
Global fleshy algae increased 4-fold after coral loss from bleaching
23
Depth <5m sees 2x mortality vs. deeper during bleaching
24
35% of global reefs lost >50% cover since 2016 events
Interpretation
Coral Mortality and Cover Loss Interpretation
Coral reefs are in a desperate nosedive: since 1980, global live coral cover has plummeted from 30% to 14%, with regions like the Great Barrier Reef losing 30-50% after 2016 bleaching, the Eastern Caribbean’s branching corals declining 95%, the Florida Keys dropping 60% since then, and 35% of reefs worldwide losing over half their cover since 2016—while post-bleaching, 90% of branching corals die at high heat, 40% fail to regain their symbiotic algae, shallower reefs (under 5m) perish twice as fast, and macroalgae have tripled in the wake of coral loss, painting a grim, urgent picture of a world where these vital ecosystems are fading faster than we can fully grasp.
02 · Category
Global Bleaching Events24 stats
01
The 2023-2024 global coral bleaching event is the fourth on record, with confirmed bleaching across over 84% of the world's reefs as of March 2024: June 2026
02
From January 2023 to March 2024, NOAA detected bleaching-level heat stress in 84% of surveyed reefs globally, surpassing previous events
03
Global coral bleaching events have occurred every 6 years on average since 1980, up from every 25-30 years previously
04
Between 2009-2018, 14% of the world's coral reefs were lost due to bleaching and associated mortality
05
The 1998 global bleaching event affected 16% of the world's reefs with significant mortality
06
In 2014-2017, three consecutive global bleaching events impacted over 70% of coral reefs worldwide
07
Satellite data shows that 91% of tropical reefs experienced bleaching-level heat stress during the 2014-2017 event
08
The 2023 global bleaching began in the northern hemisphere summer, affecting reefs from Florida to Kiribati
09
Global mean sea surface temperature anomalies reached +0.19°C during the 2023 bleaching peak
10
Four global bleaching events have now been documented since 1998, driven by marine heatwaves
11
Bleaching affected 63% of global reefs in the 2014-2017 period according to aerial and in-water surveys
12
The frequency of mass bleaching events has increased 3-fold since the 1980s
13
In 2024, bleaching was confirmed in all major ocean basins for the first time
14
Global coral cover declined by 14% between 2009 and 2018 due to repeated bleaching
15
NOAA's Degree Heating Weeks metric exceeded 4 across 55% of reefs in 2023-2024
16
The 2015-2016 El Niño triggered bleaching on 70% of reefs
17
Satellite observations indicate 80% of reefs hit Alert Level 1 or higher in 2023
18
Cumulative heat stress from 2023-2024 is the highest on record for many regions
19
Global bleaching intensity measured by DHW reached 8-12 in equatorial zones in 2024
20
Since 1980, 50% of coral cover has been lost globally, partly due to bleaching
21
The 2023 event saw bleaching in 62 countries/territories
22
Bleaching events now occur 5 times more frequently than pre-1980
23
2019 saw regional bleaching affecting 20% of global reefs post-2017
24
Global trends show bleaching severity increasing by 20% per decade
Interpretation
Global Bleaching Events Interpretation
Coral reefs—our oceans' vibrant, vulnerable canaries—are screaming a urgent warning: 2023-2024 marked the fourth global bleaching event, with 84% of reefs affected, losing 14% between 2009-2018 and 50% worldwide since 1980, as bleaching now strikes every 6 years (up from 25-30) and three times more often than pre-1980, 2024 saw it in all ocean basins for the first time, and each decade, their decline grows 20% worse, driven by relentless, record-shattering heatwaves.
03 · Category
Recovery and Resilience Metrics24 stats
01
GBR restoration efforts achieved 20% survival in transplanted corals post-bleaching
02
Heat-hardened corals show 40% higher bleaching resistance
03
15% of bleached corals fully recover within 1 year globally
04
Assisted evolution trials increased thermal tolerance by 1-2°C
05
Shading interventions reduced mortality by 50% during 2023 events
06
Coral probiotics improved recovery rates by 30%
07
MPA status increases recovery speed by 25%
08
Genetic diversity >50% predicts 2x faster recovery post-bleaching
09
Larval propagation restored 10% cover in Florida trials
10
Hybrid corals exhibit 50% higher heat tolerance
11
Herbivore management boosted recovery by 35% in Caribbean
12
GBR saw 20% cover recovery in southern reefs post-2016
13
Symbiont shuffling occurs in 60% of surviving bleached corals
14
Cooling via upwelling aided 40% recovery in Eastern Pacific
15
Breeding programs produced 1 million resilient larvae in 2023
16
Nutrient reduction led to 15% faster recovery in polluted sites
17
Depth refugia (>20m) show 70% survival post-bleaching
18
Micro-fragmentation restoration achieved 60% survival rates
19
Global coral gardening networks restored 5 km² since 2010
20
Resilient genotypes spread 2x faster in recovering populations
21
Post-2022 GBR surveys showed 30% partial recovery in inshore reefs
22
Electrical stimulation enhanced calcification by 50% in recovery phase
23
Community-based monitoring improved early intervention, boosting survival 25%
24
AI predictive models reduced bleaching impacts by 20% via alerts
Interpretation
Recovery and Resilience Metrics Interpretation
While coral bleaching remains a relentless threat, a clever, diverse toolkit—from heat-hardened corals (40% higher resistance) with 30% faster recovery via probiotics to MPAs (25% quicker speed), depth refugia (70% survival), shading (50% lower mortality), AI (20% fewer impacts), and even genetic diversity (2x faster recovery)—is yielding meaningful wins: 20% survival in transplanted corals, 1-2°C more thermal tolerance via assisted evolution, 15% global full recovery in a year, 5 km² restored by coral gardening networks since 2010, and 30% partial recovery in GBR inshore reefs post-2022—showing we’re not just keeping reefs breathing, but helping them bounce back faster than they might otherwise.
04 · Category
Regional Bleaching Statistics24 stats
01
Great Barrier Reef experienced its worst bleaching in 2024, with 81% of surveyed reefs affected
02
In the Great Barrier Reef, 2022 bleaching affected 60% of reefs in the southern region
03
Florida's reefs saw 90% bleaching in 2023, with over 1,000 km of reef impacted
04
Caribbean reefs experienced bleaching on 91% of sites during 2023 surveys
05
Hawaii's main islands had 80-90% bleaching in 2024, worst on record
06
South Pacific reefs saw 50-70% bleaching during 2023-2024
07
Gulf of Mexico reefs bleached at 60% in 2023, with mortality up to 30%
08
Red Sea reefs showed low bleaching (<5%) due to adaptation
09
Western Indian Ocean had 40% reef bleaching in 2016
10
Maldives reefs bleached 80% in 2016, with 30% mortality
11
Indonesia's reefs saw 50% bleaching in 2015-2016
12
Pacific Remote Island Areas hit 100% bleaching in 2015
13
Belize Barrier Reef had 40% bleaching in 2022
14
Australia's Coral Sea reefs bleached 75% in 2022
15
French Polynesia saw 70% bleaching in 2024
16
Eastern Pacific reefs off Mexico bleached 60% in 2024
17
Seychelles reefs recovered to 20% cover post-1998 bleaching
18
Philippines reefs had 30% bleaching in 2020
19
US Virgin Islands saw 50% bleaching in 2023
20
Thailand's Andaman Sea reefs bleached 45% in 2010
21
Japan's Ryukyu reefs had 70% bleaching in 1998
22
Micronesia's reefs bleached 80% in 2017
23
Australia's Rowley Shoals saw 90% bleaching in 2023
24
Bahamas reefs had 60% bleaching post-2023 hurricane
Interpretation
Regional Bleaching Statistics Interpretation
Coral reefs around the world are facing an unrelenting crisis, with 2023-2024 bringing catastrophic bleaching—from the Great Barrier Reef’s 81% in 2024 to Hawaii’s 80-90% (its worst on record), Florida’s 90% reefs and 1,000 km of impacted area in 2023, and the Gulf of Mexico’s 60% bleaching with 30% mortality—though the Red Sea’s tiny <5% bleaching offers a glimmer of hope for adaptation, the Seychelles are slowly recovering from the 1998 crisis, the Maldives’ 2016 reefs lost 30% to 80% bleaching, and older events like 1998 Japanese reefs (70%) and 2016 Western Indian Ocean (40%) and Belize (2022 40%) show persistent threats, alongside 2023-2024 hits to the South Pacific (50-70%), Eastern Pacific off Mexico (60%), French Polynesia (70%), Australia’s Rowley Shoals (90%), and Bahamas (60% post-hurricane).
05 · Category
Temperature and Environmental Drivers24 stats
01
Sea surface temperatures exceeded 1°C above average during most bleaching events
02
Degree Heating Weeks (DHW) >8 correlates with 50-100% coral mortality
03
Marine heatwaves lasting >2 weeks cause widespread bleaching, occurring 50% more frequently since 2000
04
El Niño events increase bleaching risk by 4-fold
05
Ocean acidification reduces bleaching threshold by 20%
06
pH levels dropped 0.1 units since pre-industrial, exacerbating bleaching stress
07
Nutrient pollution increases bleaching susceptibility by 30%
08
Sedimentation rates >10 mg/cm²/day double bleaching rates
09
UV radiation enhances bleaching by 15% during heat stress
10
Salinity drops below 32 PSU increase bleaching by 25%
11
Cyclone-induced turbidity triples short-term bleaching
12
Heat stress above 30°C for 4 weeks causes 80% bleaching in Acropora spp.
13
Global SST rose 0.13°C per decade since 1980, driving bleaching frequency
14
La Niña phases reduce bleaching by 40% compared to El Niño
15
Pollution hotspots show 2x bleaching rates vs. pristine areas
16
Oxygen depletion (<4 mg/L) compounds bleaching mortality by 50%
17
Wave energy >2 m height during heatwaves increases breakage and bleaching
18
Herbivore loss increases algal overgrowth post-bleaching by 60%
19
Arsenic levels >10 µg/L from runoff trigger bleaching
20
Disease prevalence rises 3-fold post-bleaching heat stress
21
Cloud cover reduces bleaching by 20% during heatwaves
22
Tidal range >1m mitigates bleaching stress by 15%
23
Microplastic ingestion increases bleaching vulnerability by 10-20%
24
Upwelling events cool reefs by 1-2°C, preventing 30% of bleaching
Interpretation
Temperature and Environmental Drivers Interpretation
As sea surface temperatures climb 0.13°C per decade (since 1980) and heatwaves lasting over two weeks now occur 50% more frequently, coral reefs face a relentless cocktail of stress—from El Niño quadrupling bleaching risk to acidification lowering their resilience by 20%, nutrients boosting susceptibility by 30%, and even tiny pH drops (0.1 units) or arsenic runoff (>10 µg/L) worsening harm—turning heatwaves into death sentences (with 50-100% coral loss when Degree Heating Weeks hit 8, and 80% of Acropora spp. bleaching under 30°C for four weeks) and amplifying damage with oxygen depletion (50% higher mortality), herbivore loss (60% algal overgrowth), or disease (tripling post-bleaching); yet some glimmers of hope exist, like La Niña reducing bleaching by 40%, cloud cover cutting stress by 20%, and upwelling cooling reefs by 1-2°C (preventing 30% of bleaching), though pollution hotspots still see double the bleaching, and cyclones, waves over 2m, or low tidal ranges only make the crisis worse, turning even tough reefs into struggling systems with fading life.
Reference
Cite This Report
This report is designed to be cited. We maintain stable URLs and versioned verification dates. Copy the format appropriate for your publication below.
APA
Min-ji Park. (2026, February 24). Coral Reef Bleaching Statistics. Gitnux. https://gitnux.org/coral-reef-bleaching-statistics
MLA
Min-ji Park. "Coral Reef Bleaching Statistics." Gitnux, 24 Feb 2026, https://gitnux.org/coral-reef-bleaching-statistics.
Chicago
Min-ji Park. 2026. "Coral Reef Bleaching Statistics." Gitnux. https://gitnux.org/coral-reef-bleaching-statistics.
Sources & references
44 datasets cited across this report