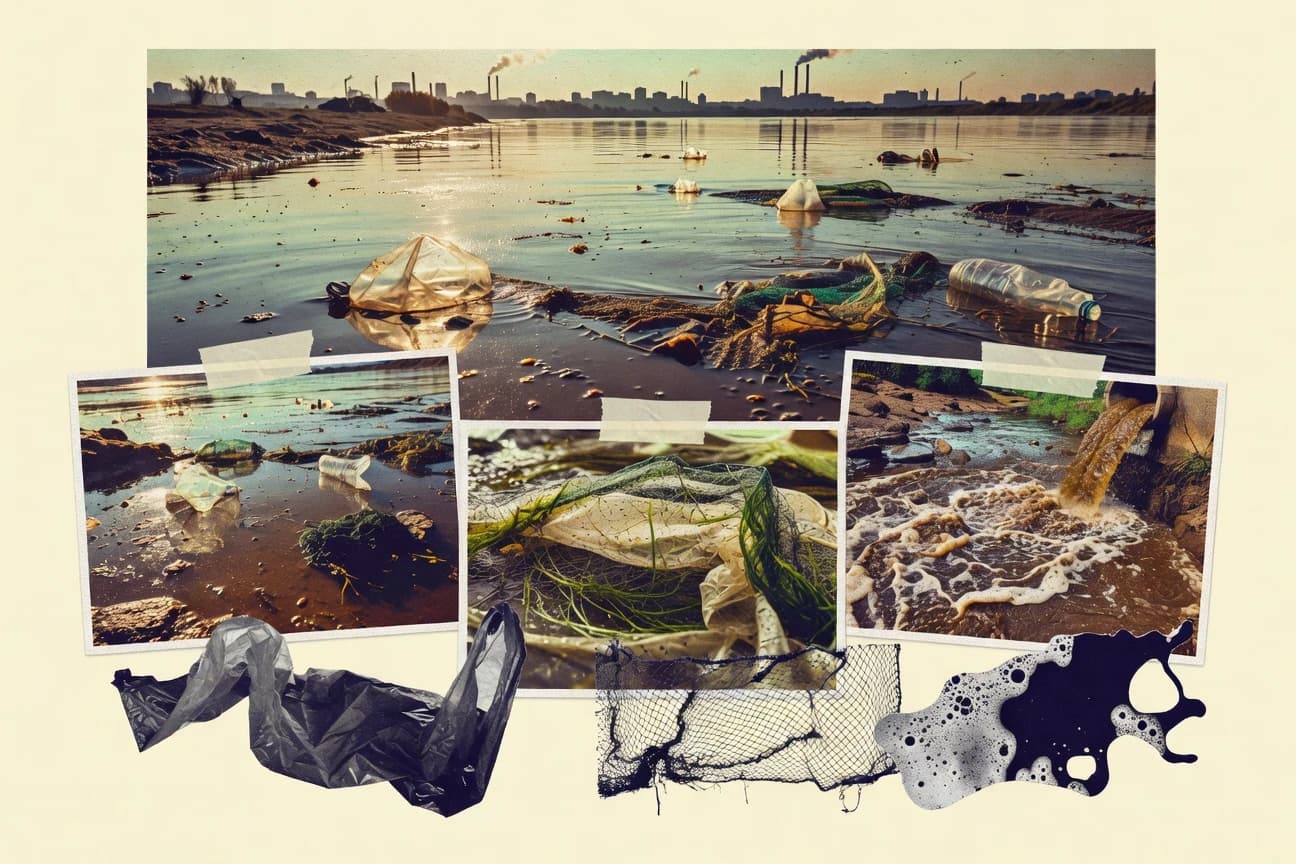

Sewage from 2.3 billion people without safely managed sanitation contaminates groundwater and drives fecal coliform levels above 10^6 CFU per 100 ml in affected areas. Only 20% of industrial wastewater is treated globally, while the rest flows into rivers, lakes, and oceans without removal of pollutants. Coral reefs absorb pollution runoff and lose about 14% of their global cover as ecosystems shift, food webs break, and public health burdens mount.
Key Takeaways
- Coral reefs suffer 14% global loss from pollution runoff, with 500 million people dependent on them for food
- Eutrophication creates 245,000 km² of marine dead zones, killing 1 billion fish equivalents yearly worldwide
- Plastic pollution ingested by 90% of seabirds, causing 1 million deaths annually across 300 species
- Water pollution costs global economy $260 billion yearly in health expenses alone
- Fisheries lose $50 billion annually from pollution-induced collapses in 20% of stocks worldwide
- Treatment of industrial wastewater costs $100 billion yearly for top 50 emitters
- Water pollution causes 1.8 million deaths annually from diarrhea alone, primarily in low-income countries
- 829,000 people die yearly from unsafe water-related diseases, with cholera outbreaks linked to polluted sources in 47 countries
- Heavy metal pollution in drinking water leads to 200,000 cancer cases per year worldwide, especially arsenic in Bangladesh affecting 20 million
- Only 20% of industrial wastewater treated globally, with 55% treatment rate in high-income countries vs 5% in low-income
- 52% of rivers in Latin America show improved water quality from 2010-2020 due to regulatory enforcement
- Investment in wastewater treatment reached $208 billion globally in 2019, up 7% from prior year
- Approximately 80% of the world's wastewater is released back into the environment without any form of treatment, leading to widespread contamination of rivers, lakes, and oceans globally
- Industrial discharges contribute about 20% of global water pollution, with heavy metals like mercury and lead entering waterways from factories in over 100 countries
- Agricultural runoff accounts for 70% of water pollution in terms of nutrient overload, with nitrogen and phosphorus from fertilizers causing eutrophication in 400,000 km² of inland waters annually
Pollution drives widespread marine and freshwater collapse, harming billions and costing the global economy hundreds of billions yearly.
Related reading
01 · Category
Ecological Impacts24 stats
01
Coral reefs suffer 14% global loss from pollution runoff, with 500 million people dependent on them for food
02
Eutrophication creates 245,000 km² of marine dead zones, killing 1 billion fish equivalents yearly worldwide
03
Plastic pollution ingested by 90% of seabirds, causing 1 million deaths annually across 300 species
04
Acid mine drainage wipes out 80% of macroinvertebrates in affected rivers, spanning 10,000 km globally
05
Microplastics reduce fish reproduction by 30-50% at concentrations >100 particles/m³ in oceans
06
Heavy metals bioaccumulate, reducing bird populations by 20% near polluted industrial rivers
07
Algal blooms from nutrients cover 25% of Lake Erie, collapsing food webs and fisheries worth $1B
08
Thermal pollution shifts species composition, losing 15-20% biodiversity in heated rivers globally
09
PFAS contamination eliminates amphibians from 30% of ponds in industrialized areas
10
Oil spills destroy mangrove ecosystems, taking 20-50 years to recover, affecting 40% of tropical coasts
11
Pesticides cause 40% decline in aquatic insects, base of food chain, in 50 countries
12
Sewage boosts pathogen loads, reducing shellfish populations by 60% in polluted estuaries
13
Mercury methylation in sediments poisons top predators, halving eagle populations near lakes
14
Sediment pollution buries coral larvae, reducing recruitment by 70% in turbid reefs
15
Nutrient overload acidifies soils and waters, dissolving shells of 50% of mollusk species tested
16
Invasive species via ballast water displace natives, altering 25% of coastal ecosystems
17
PCB pollution persists, causing 90% reproductive failure in seals from Baltic Sea
18
Urban runoff introduces metals, reducing plankton diversity by 35% in harbors
19
Cyanobacteria toxins kill 20% of fish in affected lakes yearly, cycling 100,000 tons biomass
20
Groundwater pollution salinizes aquifers, collapsing wetlands covering 1 million hectares
21
Endocrine disruptors feminize 80% of male fish in English rivers, crashing populations
22
Litter pollution entangles 300,000 whales, dolphins yearly
23
Thermal effluents shift migration, losing 10-15% salmon returns in Pacific rivers
24
Phosphate mining runoff creates dead zones in 5 Caribbean seas
Interpretation
Ecological Impacts Interpretation
Our planet's life support systems are hemorrhaging in a grotesque, multi-faceted chemical assault that is methodically dismantling the food, water, and natural stability upon which humanity itself depends.
02 · Category
Economic Impacts24 stats
01
Water pollution costs global economy $260 billion yearly in health expenses alone
02
Fisheries lose $50 billion annually from pollution-induced collapses in 20% of stocks worldwide
03
Treatment of industrial wastewater costs $100 billion yearly for top 50 emitters
04
Coral reef tourism declines 30% near polluted sites, costing $11 billion in Pacific economies
05
Dead zones reduce shrimp harvests by 20-50% in Gulf of Mexico, $2.8 billion loss over 30 years
06
Cleanup of oil spills averages $12 billion per major incident, with 10+ yearly globally
07
Agricultural yield drops 10-20% from polluted irrigation water in India, $15 billion annual hit
08
Drinking water violations cost US utilities $4.7 billion in infrastructure upgrades 2010-2019
09
PFAS remediation projected at $200 billion in US over 20 years for water systems
10
Wetland restoration from pollution costs $1-5 million per hectare globally
11
Industrial fines for water pollution exceed $10 billion yearly in China enforcement actions
12
Lost productivity from waterborne illness totals 1.5 trillion hours globally per year
13
Bottled water sales surge 50% in polluted areas, generating $300 billion industry revenue
14
River pollution halts navigation, costing $5 billion in dredging Asian waterways yearly
15
Algal bloom mitigation in lakes costs $1 billion annually in US recreational losses covered
16
Groundwater contamination delays construction, adding 20% costs to $1 trillion urban projects
17
Aquaculture losses from effluents reach $10 billion in Asia-Pacific farms yearly
18
Insurance payouts for pollution incidents average $50 million per event, 100+ yearly
19
Tourism revenue drops $20 billion in Mediterranean from beach pollution closures
20
Energy sector spends $50 billion on cooling water treatment to combat pollution intake
21
Microplastic cleanup tech R&D invests $2 billion yearly, with limited deployment
22
Property devaluation near polluted rivers averages 15-30% loss, $100 billion global asset hit
23
Sewage infrastructure upgrades cost EU $300 billion by 2030 to meet standards
24
Global desalination plants face 10% higher costs from polluted feedwater intake
Interpretation
Economic Impacts Interpretation
It appears our planet has developed a rather expensive leak, one where we're all paying the bills for a problem that we're simultaneously pouring money into, cleaning up, and profiting from.
03 · Category
Health Impacts26 stats
01
Water pollution causes 1.8 million deaths annually from diarrhea alone, primarily in low-income countries
02
829,000 people die yearly from unsafe water-related diseases, with cholera outbreaks linked to polluted sources in 47 countries
03
Heavy metal pollution in drinking water leads to 200,000 cancer cases per year worldwide, especially arsenic in Bangladesh affecting 20 million
04
Nitrate pollution from agriculture causes "blue baby syndrome" in 10,000 infants annually across Europe and US
05
Microplastics in seafood contribute to 11,000 tons ingested yearly by humans, linked to inflammation and toxicity
06
E. coli contamination from sewage affects 2 billion people, causing 485,000 diarrheal deaths in children under 5 yearly
07
Lead in water pipes exposes 100 million people in urban areas to levels >10 µg/L, reducing IQ by 4-7 points in children
08
Pesticide exposure via polluted water causes 385 million acute poisoning cases annually, 11,000 fatal
09
Fluoride pollution exceeds 1.5 mg/L in groundwater for 200 million people in India and China, leading to fluorosis in 66 million
10
Mercury in fish from polluted waters causes Minamata disease symptoms in 10,000+ cases historically, ongoing risks for 3 billion consumers
11
Antibiotic resistance from polluted rivers renders 10,000 drugs ineffective, contributing to 700,000 deaths yearly
12
Chromium VI in water causes 5,000 cancer incidences per year in industrial regions like Hinkley, California equivalents globally
13
Arsenicosis affects 57 million in Asia, with skin lesions and cancers from >10 µg/L in tube wells
14
Vibrio cholerae from polluted coastal waters causes 1.3-4 million cases and 21,000-143,000 deaths yearly
15
Endocrine disruptors in water linked to 20% rise in infertility rates over 20 years in polluted urban areas
16
PFAS "forever chemicals" in water exceed 70 ppt for 98 million Americans, linked to thyroid disease in 15% exposed
17
Cyanotoxins from algal blooms poison 100,000+ people yearly, causing liver failure in severe exposures
18
Cadmium pollution from rice paddies affects 10 million in Asia with kidney damage > WHO limit 3 µg/L
19
Legionella from polluted cooling waters causes 10,000-18,000 US cases yearly, 10% fatal globally extrapolated
20
Schistosomiasis from polluted freshwater infects 240 million, causing 200,000 deaths annually in Africa
21
DDT residues persist in waters, bioaccumulating to cause neurological disorders in 5 million exposed populations
22
Oil pollution ingestion leads to respiratory issues in 50,000 coastal communities post-spills
23
Radioactive pollution from Fukushima detected in Pacific tuna, exposing 1 million consumers to 10 Bq/kg Cs-137
24
Ammonia toxicity >2 mg/L in rivers causes gill damage in fishers handling polluted waters, 1 million affected
25
Plastic-derived toxins like BPA in water disrupt hormones, linked to 30% obesity increase in polluted regions
26
Water pollution reduces global life expectancy by 1.8 years on average in high-risk areas
Interpretation
Health Impacts Interpretation
While these overwhelming statistics paint a picture of a world quietly poisoning itself, the stark truth is that humanity's most essential resource has become a slow-motion vector for our own collective suffering, from infant mortality to cognitive decline.
More related reading
04 · Category
Remediation and Statistics29 stats
01
Only 20% of industrial wastewater treated globally, with 55% treatment rate in high-income countries vs 5% in low-income
02
52% of rivers in Latin America show improved water quality from 2010-2020 due to regulatory enforcement
03
Investment in wastewater treatment reached $208 billion globally in 2019, up 7% from prior year
04
Membrane bioreactor tech treats 15% of municipal wastewater in Asia, removing 99% BOD
05
2.2 billion people gained access to safely managed drinking water from 2000-2020, reducing pollution exposure
06
EU Urban Waste Water Directive achieves 95% compliance in large agglomerations by 2022
07
Constructed wetlands treat 10% of small community wastewaters globally, cost-effective at $0.01-0.05/m³
08
Plastic capture devices in rivers remove 50,000 tons annually from 100+ installations worldwide
09
Advanced oxidation processes degrade 90% of pharmaceuticals in 500 treatment plants
10
Global recycling of wastewater for agriculture reuses 40 billion m³ yearly, 4% of total demand
11
Monitoring stations track pollutants in 70% of major rivers via GEMS/Water network in 100 countries
12
Biochar filters remove 85-95% heavy metals from mine drainage in pilot projects across 20 sites
13
Desalination with reverse osmosis treats polluted brackish water for 16,000 plants globally, capacity 100 million m³/day
14
Community-led total sanitation reduces open defecation pollution by 700 million people since 2000
15
Nanotech filters achieve 99.9% virus removal in 50 commercial systems deployed
16
River cleanup campaigns like Yangtze restore 85% of monitored sections to grade III water quality by 2023
17
UV disinfection eliminates 99.99% pathogens in 80% of US municipal plants
18
Phytoremediation plants like water hyacinth remove 70% nitrates from 1,000 ponds in India
19
Smart sensors monitor real-time pollution in 500 cities, reducing response time by 50%
20
Global fund investments total $10 billion for water pollution control since 2015
21
Aerobic granular sludge tech cuts energy use 40% in 100 WWTPs, treating 5 million m³/day
22
Plastic pellet recovery from beaches cleans 20,000 tons yearly via 200 volunteer programs
23
Electrochemical oxidation destroys 95% PFAS in lab-scale to full plants in 10 sites
24
Rainwater harvesting reduces urban runoff pollution by 30-50% in 5,000 installations
25
Microbial fuel cells generate energy while treating wastewater, piloted in 50 locations at 1-5 kWh/m³
26
International standards like SDG 6.3 met progress in 40% of countries with pollution halving targets
27
Floating treatment islands remediate 60% nutrients in 200 lakes globally
28
AI-optimized treatment plants reduce chemical use 25% in 100 facilities
29
Global ocean plastic removal by vessels collects 1,000 tons monthly from initiatives like Ocean Cleanup
Interpretation
Remediation and Statistics Interpretation
Despite some promising sprouts of progress, the global fight against water pollution remains a jarring tale of two worlds, where wealth buys cleanliness and leaves the rest to wade through a sea of neglect.
05 · Category
Sources of Water Pollution30 stats
01
Approximately 80% of the world's wastewater is released back into the environment without any form of treatment, leading to widespread contamination of rivers, lakes, and oceans globally
02
Industrial discharges contribute about 20% of global water pollution, with heavy metals like mercury and lead entering waterways from factories in over 100 countries
03
Agricultural runoff accounts for 70% of water pollution in terms of nutrient overload, with nitrogen and phosphorus from fertilizers causing eutrophication in 400,000 km² of inland waters annually
04
Plastic pollution in oceans reaches 8-10 million metric tons per year, primarily from rivers carrying 1-2 million tons from land-based sources worldwide
05
Oil spills from shipping and extraction pollute 3.5 million tons of water annually, affecting coastal ecosystems in 50+ nations
06
Mining activities release 10 billion cubic meters of acid mine drainage yearly, contaminating rivers in regions like South America and Africa
07
Urban stormwater runoff carries 1.5 million tons of pollutants into waterways each year from impervious surfaces in megacities globally
08
Sewage from 2.3 billion people lacking safely managed sanitation contaminates groundwater with fecal coliforms exceeding 10^6 CFU/100ml in affected areas
09
Pesticide residues from agriculture pollute 25% of European rivers and 40% of Asian surface waters above safe thresholds
10
Thermal pollution from power plants raises river temperatures by 3-5°C in 20% of monitored global waterways
11
Textile industry dyes 200,000 tons of hazardous chemicals into rivers annually, mainly in India and Bangladesh
12
Deforestation increases sediment pollution by 50-100% in tropical river basins, affecting 30% of global freshwater systems
13
Pharmaceutical pollutants like antibiotics detected in 70% of 258 rivers across 137 countries at concentrations up to 6,400 ng/L
14
Microplastics concentration in global oceans averages 1.1 particles per m³ at surface, rising to 94 particles per m³ subsurface
15
Atmospheric deposition adds 5-10% of mercury pollution to remote lakes, with 40% of total input in some Arctic waters
16
Livestock waste generates 1.3 billion tons of manure yearly, polluting 25 million hectares of waterways with nitrates >50 mg/L
17
Road salt de-icing pollutes 20% of urban streams with chloride levels >250 mg/L, harming aquatic life worldwide
18
Electronic waste leaching 1,000 tons of lead into waters annually from informal recycling in Asia and Africa
19
Over 300 million people in China face water pollution from 80,000 tons of VOCs discharged daily by industries
20
Fracking operations contaminate 2,500 km of aquifers in the US alone with BTEX compounds > WHO limits
21
Ship ballast water introduces 3,000-7,000 alien species daily, altering microbial pollution in ports globally
22
Coal ash ponds leak 1.2 billion gallons of contaminated water yearly into US rivers, with global equivalents higher
23
Laundry detergents contribute 500,000 tons of phosphates to global waters, fueling algal blooms in 60% of lakes
24
Tire wear particles add 0.5-1.5 million tons of microplastics to roads and runoff waters annually worldwide
25
Nuclear plant effluents release 10^12 Bq of tritium into rivers yearly, detectable in 15% of European waters
26
Food processing industries discharge 50 billion liters of high-BOD wastewater daily, polluting rivers in developing nations
27
Cosmetics with microplastics wash 8,000 tons into oceans yearly from personal care products globally
28
Airport de-icing fluids contaminate 1,000 km of streams with glycols >100 mg/L near 500 major airports
29
Landfill leachate pollutes 10% of groundwater sources with ammonia >100 mg/L in 50 countries
30
Over 1 million tons of PFAS chemicals have contaminated water sources for 200 million people globally
Interpretation
Sources of Water Pollution Interpretation
We’ve turned the planet’s circulatory system into a dumping ground, and now the bill – written in toxic algae, heavy metals, and eternal plastics – is coming due.
Reference
Cite This Report
This report is designed to be cited. We maintain stable URLs and versioned verification dates. Copy the format appropriate for your publication below.
APA
Elena Vasquez. (2026, February 13). Global Water Pollution Statistics. Gitnux. https://gitnux.org/global-water-pollution-statistics
MLA
Elena Vasquez. "Global Water Pollution Statistics." Gitnux, 13 Feb 2026, https://gitnux.org/global-water-pollution-statistics.
Chicago
Elena Vasquez. 2026. "Global Water Pollution Statistics." Gitnux. https://gitnux.org/global-water-pollution-statistics.
Sources & references
71 datasets cited across this report · attribution is report-level