GITNUX MARKETDATA
Browse Our Category
Marketing In Industry
Latest update:


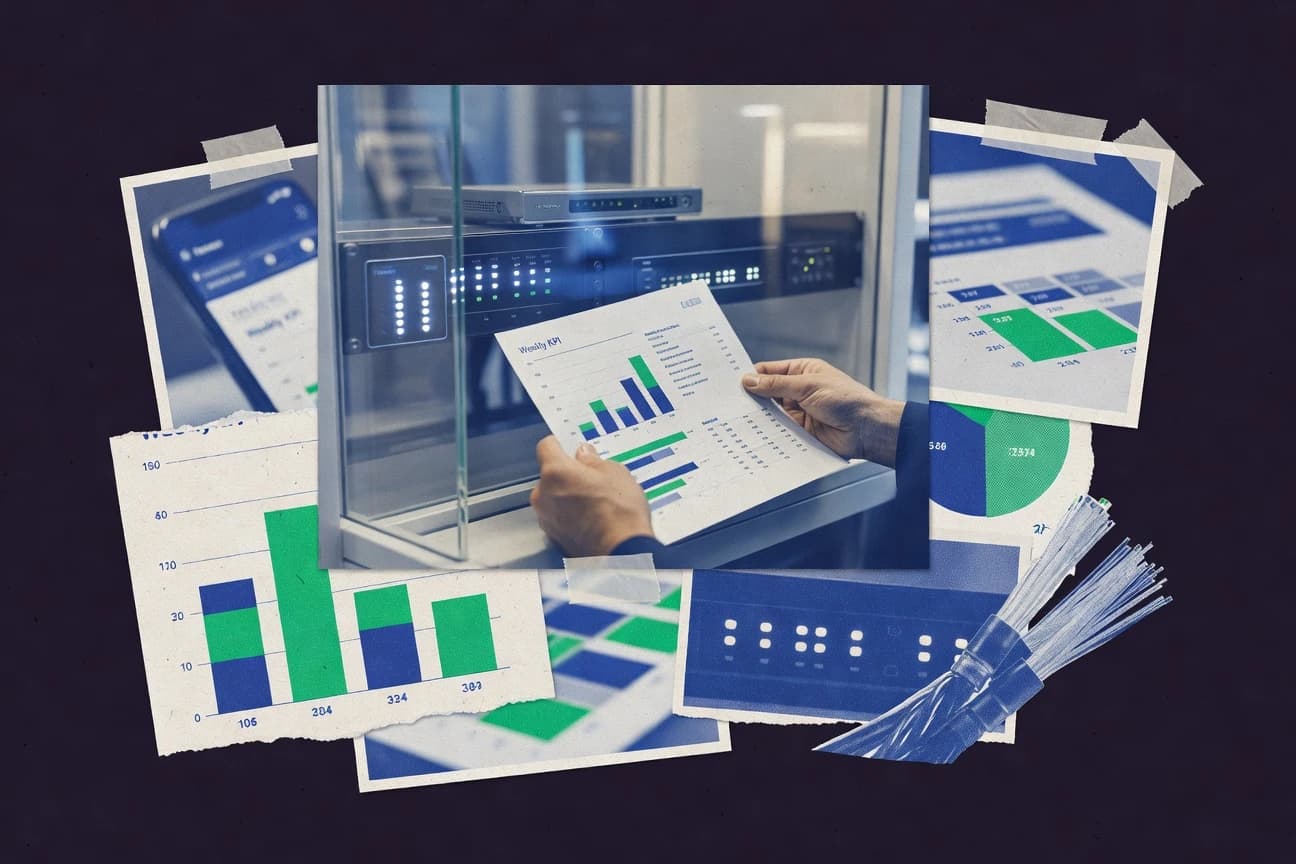
Marketing In The Warehouse Industry Statistics
Smartphone shopping is already tied to warehouse friendly marketing signals, with 79% of users making a purchase by phone in the past six months and 76% of store visits starting after online research. Meanwhile, the operational stakes are rising as 51% of logistics organizations plan to invest in automation and only 28% of marketers cite data quality as a major analytics challenge, making this a must read for anyone trying to connect demand, visibility, and measurable ROI.

Marketing In The Banking Industry Statistics
Bank customers are ready to switch fast, with 59% changing providers in the past 12 months, yet 51% also say they have low trust in financial institutions, creating a high stakes gap banks must close. This page connects the behavioral drivers to the marketing levers, from real time personalization expectations and fee transparency to why 57% of consumers stop doing business after a bad experience.
Marketing In The Telecom Industry Statistics
With $6.7 billion in global telecom cybersecurity spend in 2024 alongside a 2.6x higher conversion when landing pages load in under 2 seconds, telecom marketers are being forced to win on speed and trust while still improving acquisition and retention. The page connects the gaps between personalization, omnichannel journey tracking, and data quality, including where 23% of marketers say lead quality is the biggest blocker and why coordinated journeys can lift retention by 2.9x.
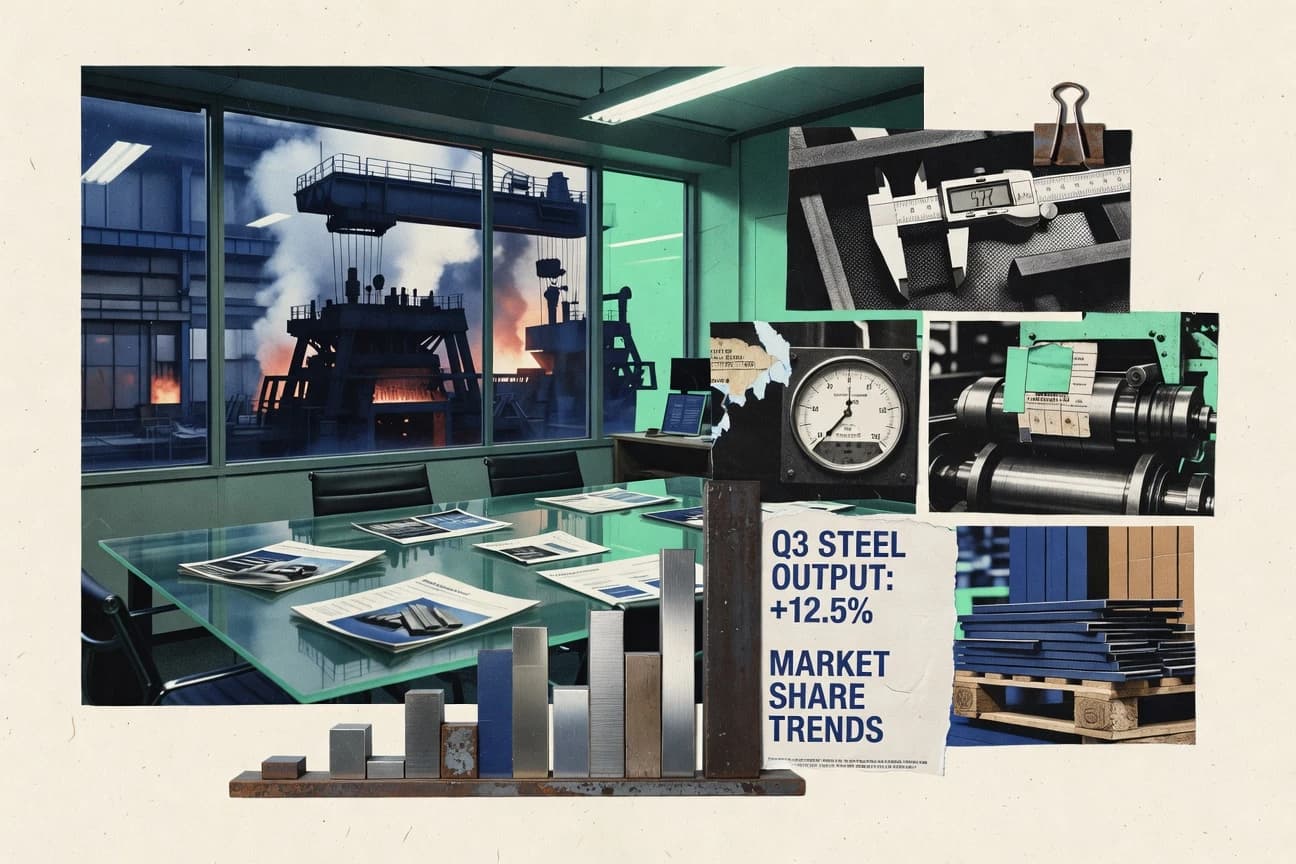
Marketing In The Steel Industry Statistics
Global crude steel production topped 1.86 billion tons in 2022, yet steel marketers still need to act on fast-moving demand signals like North America’s 2.0% 2024 forecast increase and the export pull of US$19.5 billion for the US and US$46.6 billion for Germany in 2023. Pair that with how buyers buy online since 79% do research digitally and email is used by 78% of B2B teams, plus compliance pressure from CBAM starting its transitional reporting, and you get a practical read on where steel marketing budgets should go next.
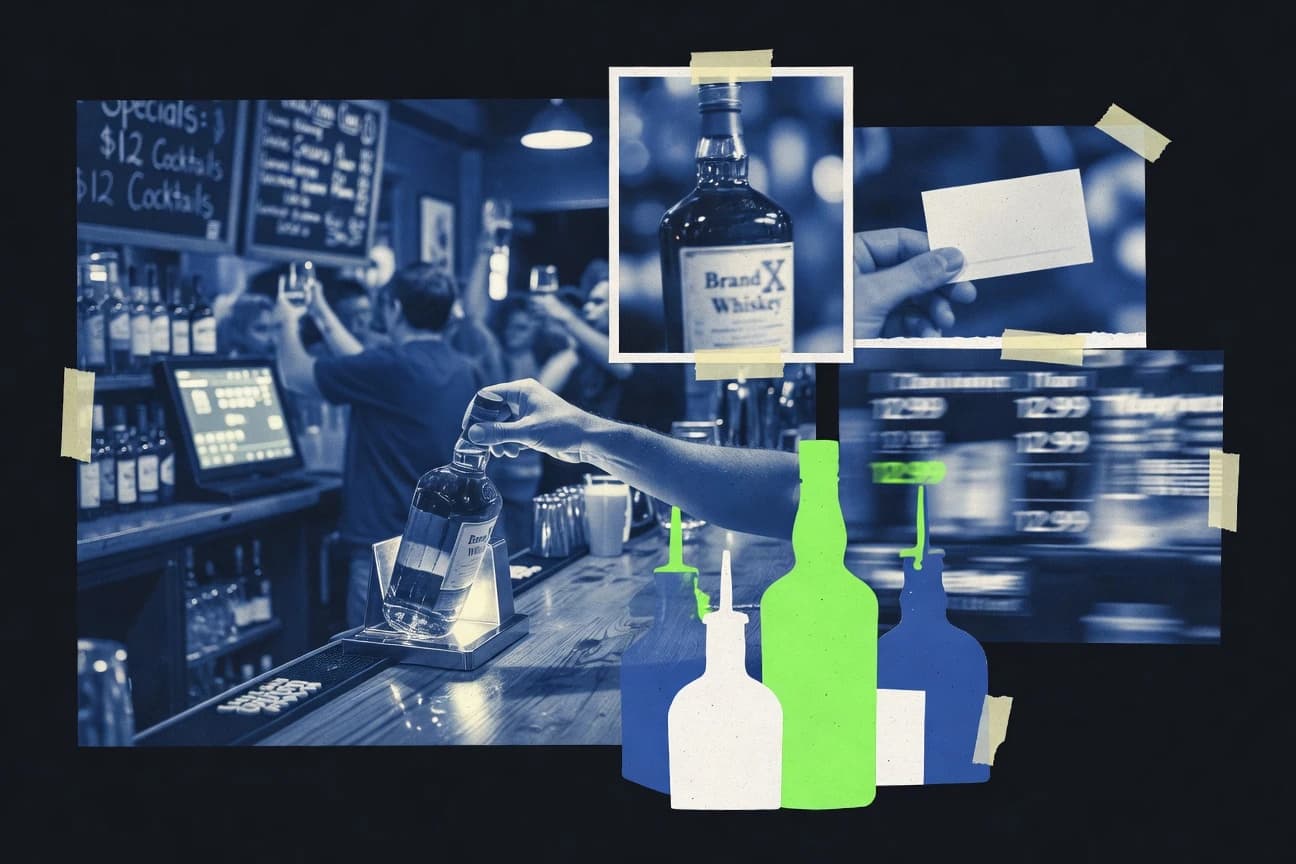
Marketing In The Alcohol Industry Statistics
With U.S. alcohol advertising at $5.6 billion in 2023 and global marketing spend still running $30 to $40 billion a year, this page connects spend and audience behavior to the real buying outcomes behind beer, wine, and spirits. You will see how fast channels are shifting from on trade to off trade and from traditional ads to e-commerce, plus what compliance rules in major markets mean for what brands can actually say and who they can reach.
Marketing In The Wellness Industry Statistics
Wellness is scaling fast, with global wellness tourism forecast to grow at a 12.0% CAGR from 2024 to 2032 while the global wellness economy hit $5.5 trillion and consumers are actively shopping it through mobile and social. But trust and compliance are the make or break, with 84% of consumers valuing reviews like personal recommendations and regulators ready to fine and recall when brands get it wrong.
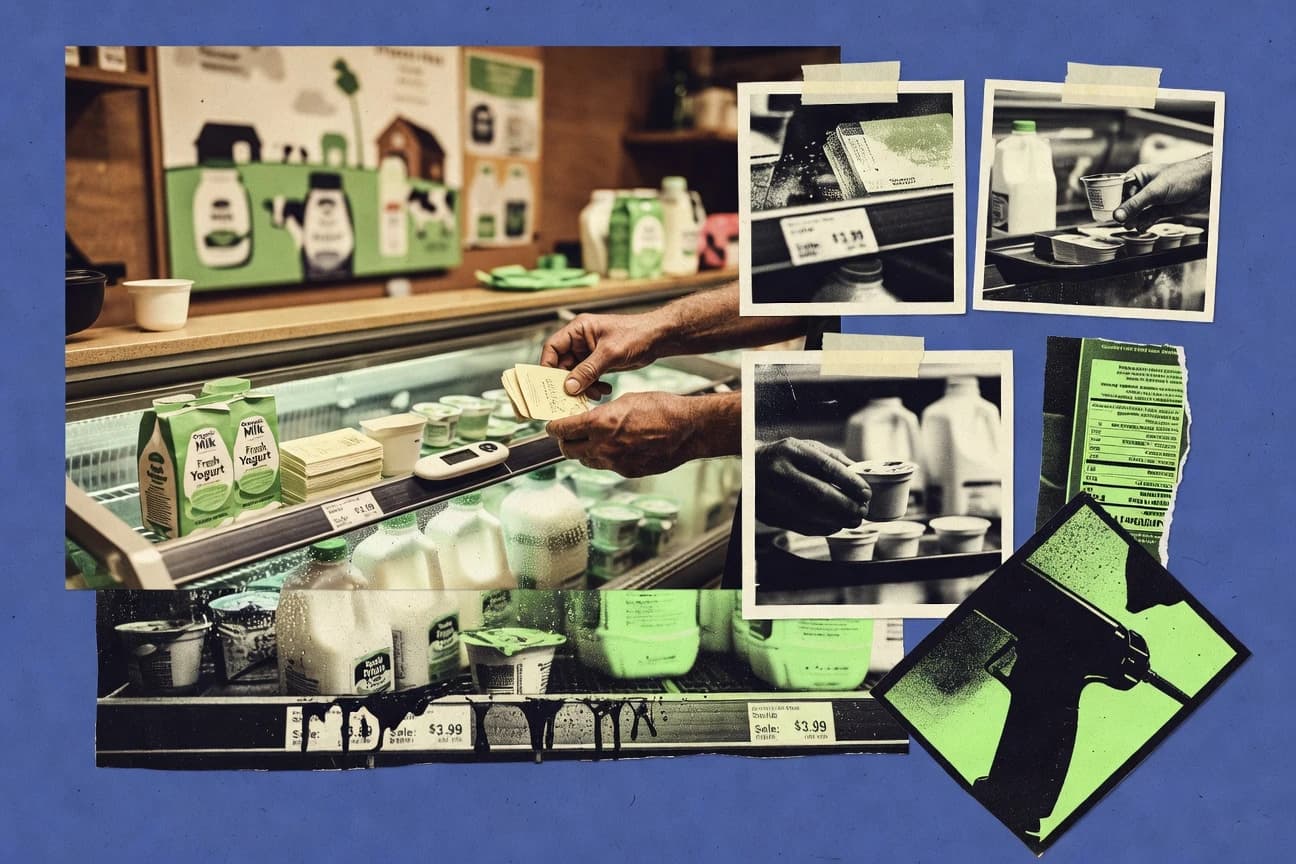
Marketing In The Dairy Industry Statistics
2026 forecast data shows how dairy marketing budgets are tightening even as performance expectations rise, turning audience targeting into a make or break lever rather than a nice to have. The page pairs that shift with up to date consumer channel demand metrics so you can see where spend is likely to move next.

Marketing In The Software Industry Statistics
Software marketers are chasing a ballooning $833 billion forecast for 2025 public cloud spend while fighting for leads in a self serve journey where buyers consume 13 content pieces and 72% research online before they ever contact sales. See how big budgets like $6.2 billion in attribution tools and $5.1 billion paid search in the US are shaping pipeline outcomes, personalization wins, and the ROI pressure that now governs MarTech and marketing operations.
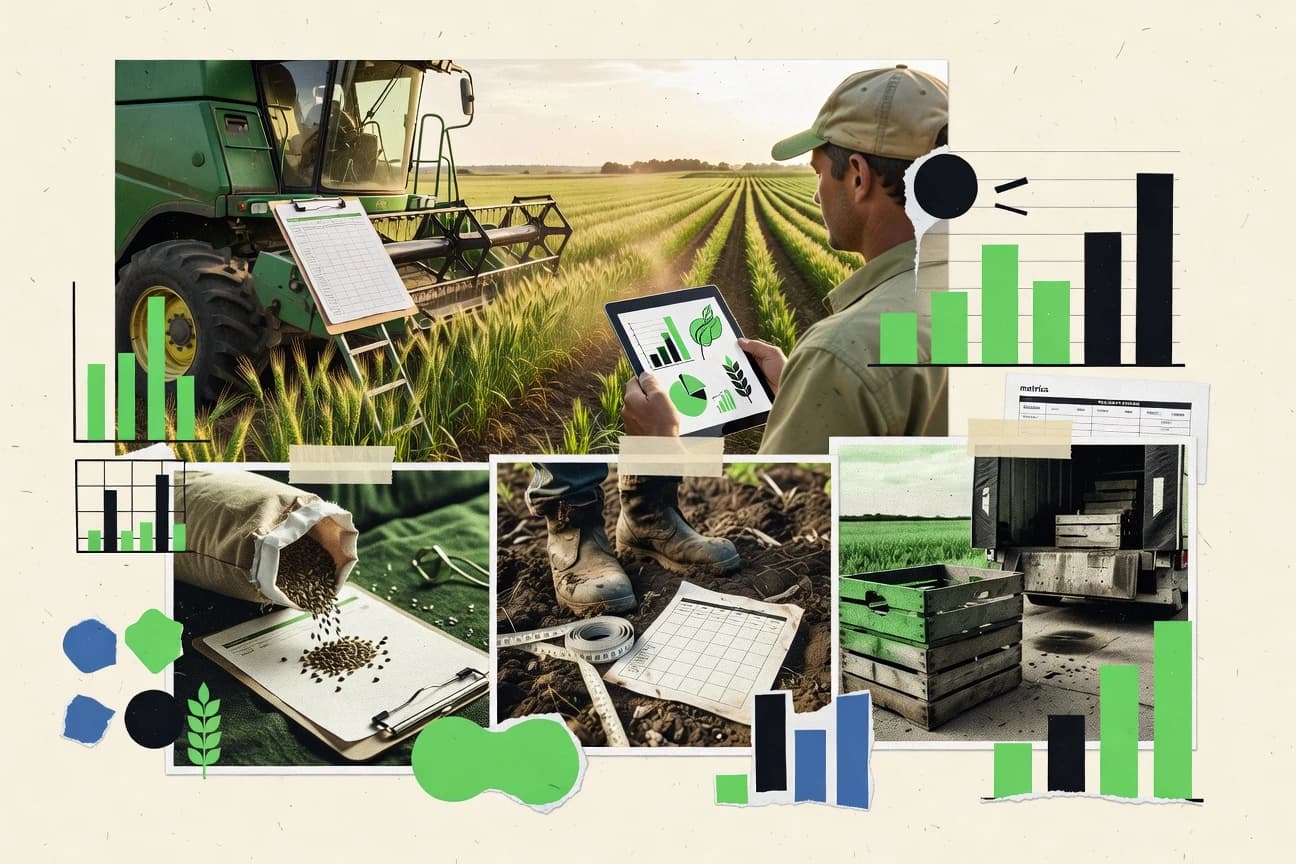
Marketing In The Agriculture Industry Statistics
While farmers have more options to reach buyers, the marketing numbers reveal how quickly the playbook is changing, with 2026 projections pointing to a shift toward more targeted channels and measurable campaign performance. See which tactics are rising and which are falling as agricultural brands chase tighter attribution and faster ROI than ever before.
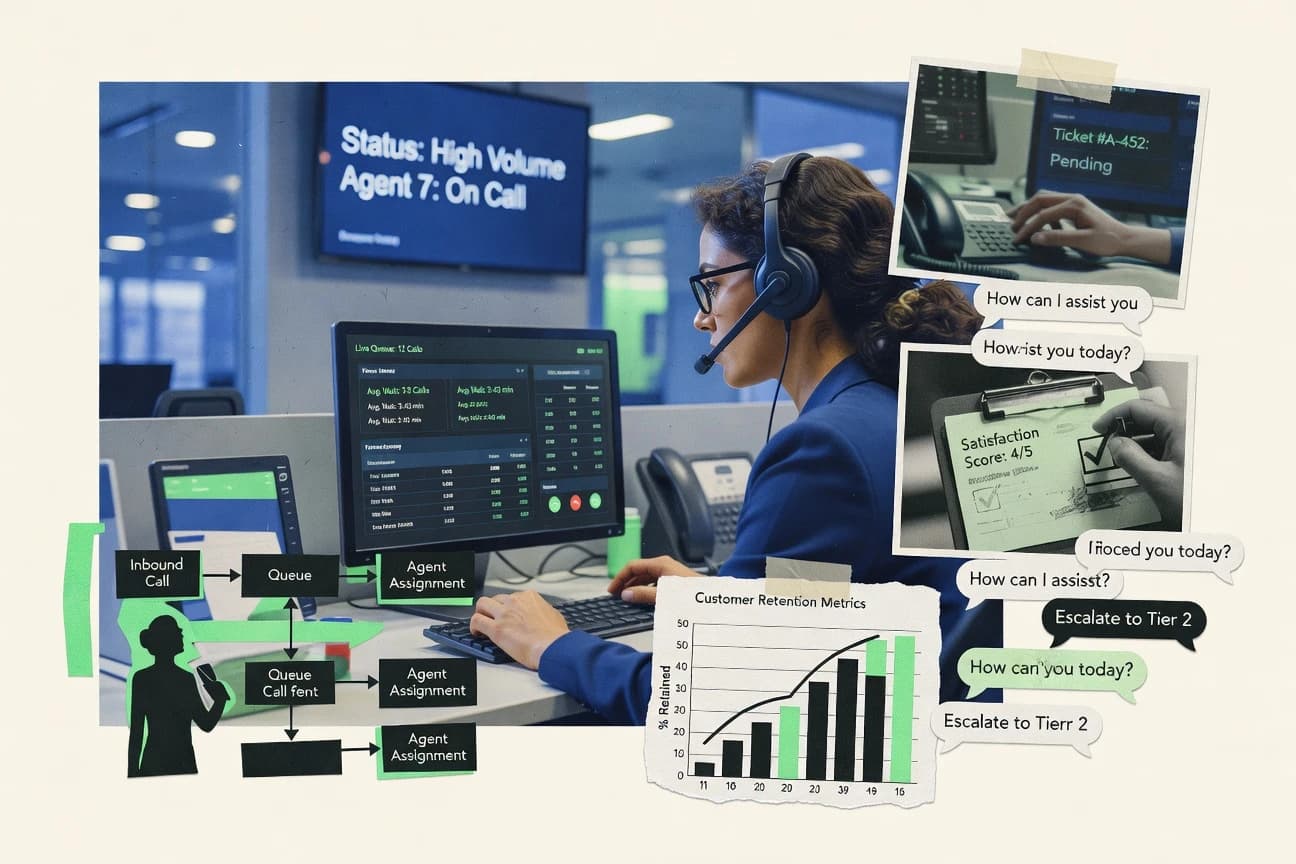
Marketing In The Customer Service Industry Statistics
Customer service marketing is shifting fast and the numbers in 2026 are proof. Find out where customer service performance is improving most and where rising costs and message overload are still hurting, so you can focus your next campaign on what actually moves the needle.
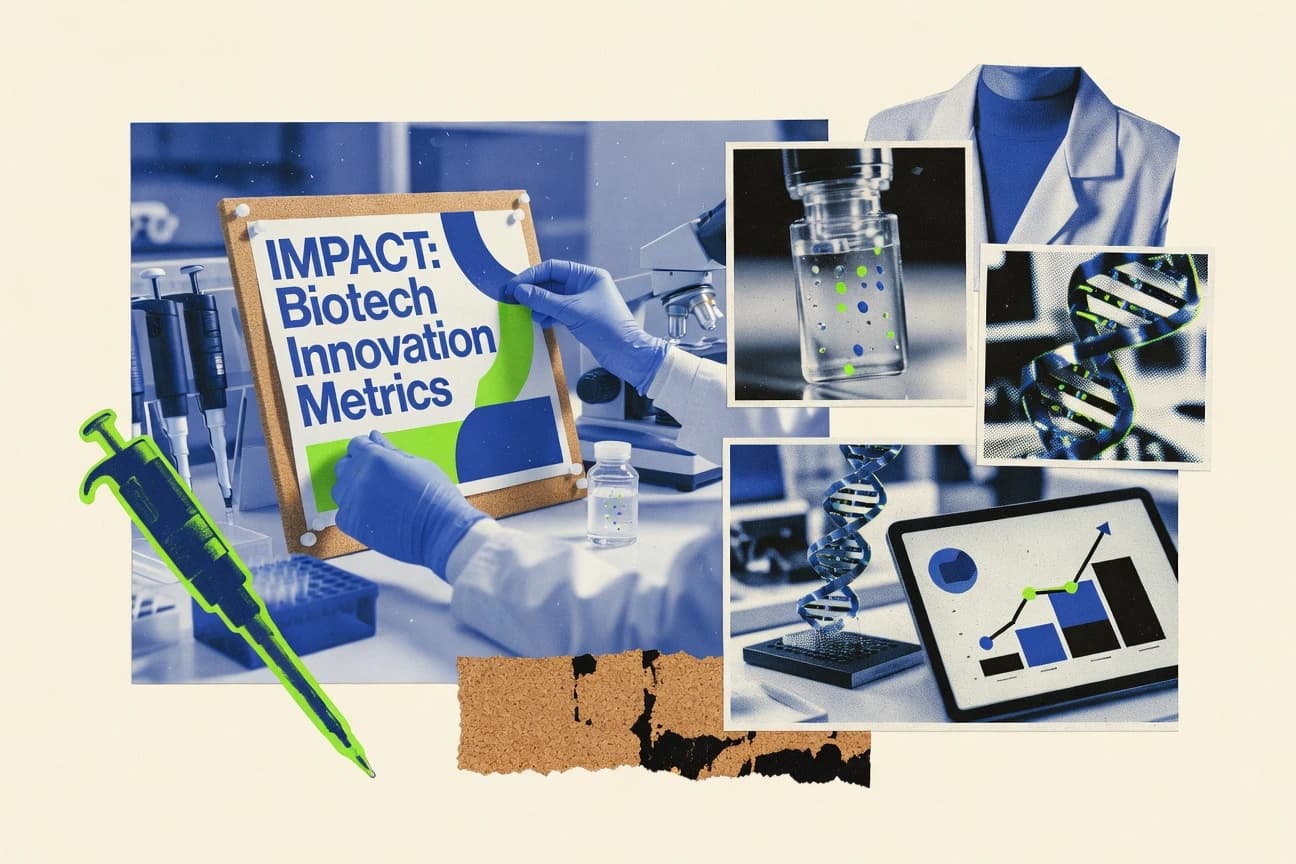
Marketing In The Biotechnology Industry Statistics
Marketing teams in biotech are leaning into measurable growth engines such as marketing automation with a projected global market size of USD 54.0 billion by 2032, but they are also navigating data quality issues, with 12.5% of marketers calling it a major challenge, plus heavy compliance constraints that shape how and when promotional communications can move. This page connects those pressures to performance outcomes, from a 3.2x conversion lift tied to personalization to HIPAA compliant marketing tooling spend of USD 4.4 billion in 2023, so you can see where ROI is most likely to hold up under real-world healthcare rules.
Marketing In The Oil Industry Statistics
Global cloud services spending is forecast to hit $678B in 2024, while oil and gas companies reported $5.0B in total advertising and marketing costs in 2023, putting brand spend and measurement demands in direct competition with capex driven narratives. From trust and privacy constraints to data quality and automation benchmarks like 89% reporting improved lead generation, this page shows exactly where marketing teams gain leverage as energy transition claims, energy reliability messaging, and audience attention collide.
Marketing In The Plumbing Industry Statistics
U.S. plumbing and pipefitting employment still runs deep at 9.7 million professionals, but customer attention now moves at digital speed, with 3.1x more call volume when businesses use call tracking tied to ads and 91% of consumers checking online reviews before hiring. See how video, CRM automation, and faster local response are reshaping the path from search to scheduled service, even as 58% of shoppers will bounce from a slow website.
Marketing In The Mining Industry Statistics
Search and automation spend keeps climbing, including a $392.7 million global SEO services bill and a forecasted $1.5 billion marketing automation market, yet 57% of marketers still say they struggle with lead quality which is the tension mining vendors need to fix to turn intent into pipeline. This page links those platform benchmarks with buyer expectations like 70% expecting vendors to understand requirements and 65% likely to engage with vendor content during research, so you can spot where mining marketing measurement and targeting are actually worth the next dollar.

Marketing In The Digital Marketing Industry Statistics
See how digital marketing is reshaping budgets and channel choices using 2025 and 2026 benchmarks that highlight a surprising shift from clicks to measurable outcomes. If you manage campaigns, this page turns the latest spend, engagement, and conversion statistics into decisions you can make this quarter.
Marketing In The Pcb Industry Statistics
Asia holds 28% of global PCB capacity while the global PCB market is set on a $25.8 billion scale in 2023, and the gap between manufacturing concentration and where B2B demand is actually shaped is where winning marketing lives. From intent driven lead targeting and 60% webinar usage to the 7% conversion hit from a 1 second delay, these PCB specific benchmarks help you sharpen MQL quality and budget choices with real ROI signals for 2025 planning.
Marketing In The Battery Industry Statistics
2026 is set to reshape the battery marketing playbook as key commercial benchmarks swing fast, forcing teams to rethink who they target and how quickly they can prove traction. Read the statistics to see which demand signals are accelerating and which are slipping, so your next campaign is built on what is changing now, not what used to work.

Marketing In The Glass Industry Statistics
A quick look at 2026 glass marketing statistics shows where spend and messaging are shifting fastest, with performance metrics that no longer reward the same old channels. If your campaigns were built for last cycle, these current benchmarks will help you spot what is changing before your next budget decision.

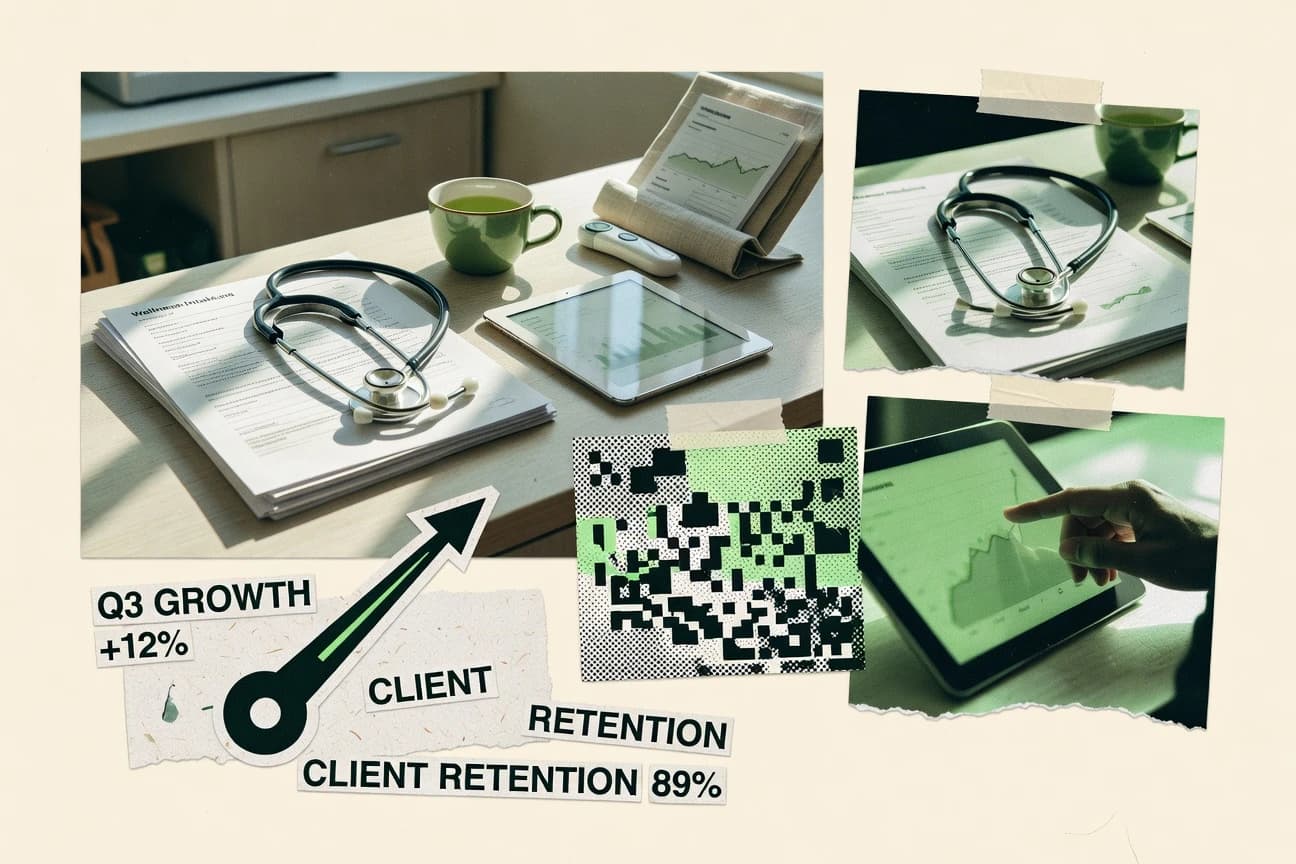
Marketing In The Healthcare Industry Statistics
Healthcare marketers are being pushed from outreach to protection, with 76% saying privacy and security now matter more than two years ago, while email drives 84% channel usage and generates $36 for every $1 spent. See how fast the budgets are shifting too, including global marketing automation projected to reach $XX.XX billion by 2030 and healthcare cloud services forecast to grow to $XX.XX billion by 2030, alongside hard cyber signals like phishing volume in the millions and breaches tied to stolen credentials.

Marketing In The Spa Industry Statistics
With U.S. wellness tourism projected to grow at a 3.2x clip from 2022 to 2026, plus steady expansion from $12.7 billion in spa revenue in 2023 to $22.8 billion forecast by 2028, the page lays out where marketing spend can compound for U.S. and global spa brands. It also connects high impact levers like local SEO urgency, video lift, and personalization expectations to real benchmarks, from 76% near me search visits to 451% lead gains from marketing automation, so you can spot what will move demand fastest.