Market data
Marketing Advertising
Explore marketing advertising statistics and market research reports with sourced data and trend analysis.
Latest update:
 Lars Eriksen


Statistics · 2026
Direct Mail Statistics
Direct mail is built for measurable lift with a 90% open rate and up to a 4.4% average response, beating email by 20x in response and delivering an ROI of $42 for every $1 spent. If you are budgeting for digital instead, expect email open rates near 21% and a 0.05% display CTR while direct mail customers are 118% more likely to share and 57% visit the store after receiving the mail.

Statistics · 2026
Commerce Content Statistics
Commerce content is clearly outperforming traditional brand storytelling with video generating 1200% more shares and SEO leads costing 61% less than outbound, so every channel depends on what you publish, not just how often. See why personalized email click through is up 14% and omnichannel keeps 89% of customers returning, from shoppable Instagram taps to retargeting that recovers 98% of abandoned carts value.

Statistics · 2026
Television Advertising Statistics
US TV homes hit 119.6 million in 2023 while daily viewing slipped to 2.7 hours and Live TV time among 18 to 34 year olds fell to just 12%, even as TV+digital and addressable formats push new engagement tools. If you place ads, you need to understand who is actually watching and how much intent TV creates, from 30 second recall at 68% to an average 0.9% purchase intent lift across categories.

Statistics · 2026
Omnichannel Personalization Statistics
A single bad omnichannel moment can send 50% of consumers to a competitor, yet the right personalization strategy lifts revenues by 5 to 15% and can cut acquisition costs by as much as 50%. This page connects the dots from cross channel expectations like 75% wanting consistency and 64% prioritizing real time assistance to practical, privacy aware tactics that make customers more likely to buy, repeat, and convert across mobile, web, email, and in store.

Statistics · 2026
A B Testing Statistics
If you think A B testing is just swapping button colors, the results are more decisive than that. With 92% of Fortune 500 companies using it as an optimization strategy and 74% of the top 100 companies running tests regularly, but only 16% of marketers confident in their maturity, this page breaks down what actually drives conversion gains and what quietly invalidates tests.

Statistics · 2026
Tiktok Ads Statistics
TikTok Ads in 2023 beat the usual benchmarks with purchase conversion at 1.5% versus Instagram’s 0.9% and e-commerce ROAS jumping to 4.2x during the holiday peak. On the creative side, Spark Ads delivered a 15% higher conversion lift and branded hashtag challenges converted 5% of participants to sales.

Statistics · 2026
Door To Door Sales Statistics
Most door knocks die on the doorstep with 75% of people hanging up or ignoring the first contact and 55% rejecting because they have scam worries, yet acceptance spikes at 5 to 7 PM with 60% willing to hear it out and 80% preferring local reps over telemarketing. This page lines up the real conversion tensions from neighbor referrals and bundle buying to 2025 scale signals like door-to-door sales approaching a projected $200 billion globally by 2027 and shows who answers, who buys, and what tactics actually raise the odds.
Statistics · 2026
Experiential Marketing Statistics
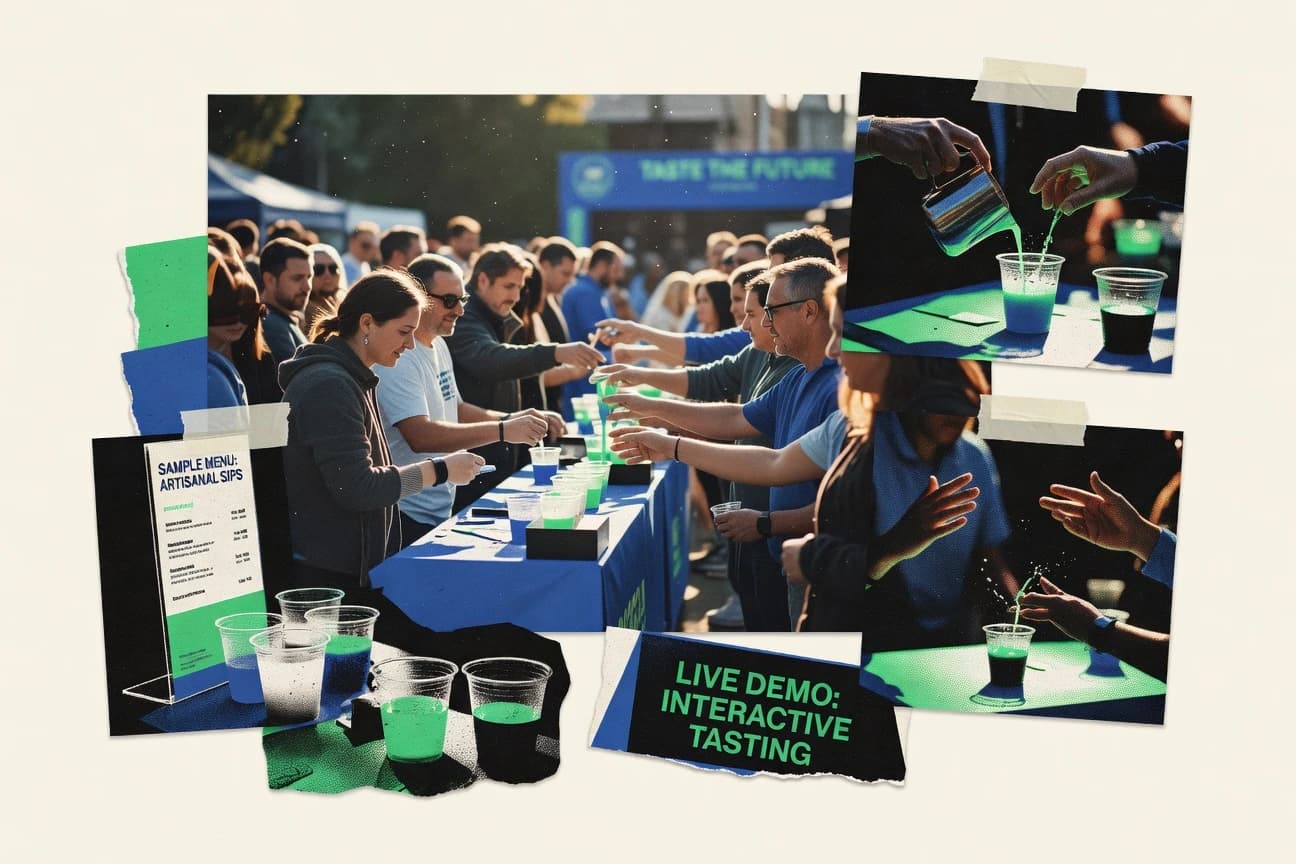
Experiential marketing is outperforming traditional ads by a wide margin, with 93% of consumers saying live events are more effective than TV commercials and an average ROI of 3:1 to 5:1. But it is not just hype, from 91% feeling more positive about brands after attending to 98% becoming more inclined to purchase after an activation, including the behind the scenes obstacles like poor promotion that cause 50% of events to fail.

Statistics · 2026
Programmatic Advertising Statistics
Programmatic is no longer a niche buying method it now drives $488 billion in global ad spend in 2022 and is projected to make up 75% of all digital ad spend worldwide by 2024, while 70% of European publishers already sell 80% of their inventory programmatically. Still, the gains come with friction like 55% of programmatic spend lost to issues such as botnets and brand safety and latency that can wipe out 10% of bids, making this page essential for understanding both the momentum and the real-world costs.

Statistics · 2026
Infomercials Industry Statistics
Infomercials still convert at an average 2.5%, but the best calls hit 10% response and average ROI around a 4:1 ratio, with call-to-order peaking at 5% during testimonials. See why web traffic jumps 300% after airing, retention for repeat purchasers reaches 35%, and top creative keeps 72% of viewers recalling it 24 hours later, even as mobile now drives 28% of orders.

Statistics · 2026
Digital Signage Statistics
From QR-linked kiosks that lift engagement by 12% since 2020 to 4K signage that increases dwell time by 12%, this page explains exactly how modern digital screens win attention and drive action. You will also see why dynamic, interactive DOOH is projected to grow with an 8.0% CAGR to 2030 and how measures like real time analytics and motion graphics translate into measurable results.

Statistics · 2026
Ads Statistics
Ad audiences are turning sharper, not kinder: 76% block or skip ads whenever possible, and trust in online advertising is down 15% over the last five years. This page pairs those headwinds with practical momentum, from native ads trusted by 25% more people to tailored ads that lift preference by 71%, so you can see exactly what is driving performance and what is pushing people away in 2025.

Statistics · 2026
Cold E Mail Statistics
Cold email clicks hover around 2.3% but smart tweaks swing that range hard, from one-link emails at 4.2% and Calendly links at 5.6% to multiple CTAs dragging CTR down 22%. For 2026 minded operators, the page also connects opens and reply lift to outcomes like a 13.2% average sequence reply rate and 15% of replies turning into meetings, so you can see exactly which elements are earning attention and which are just taking up space.

Statistics · 2026
Multi Channel Marketing Statistics
At almost six touchpoints per purchase, customers bounce between devices and channels expecting real time, consistent help, and brands that nail omnichannel engagement can retain about 89% of customers. See why 90% want alignment everywhere, why slow or mismatched experiences can trigger abandonment, and how coordinated multi channel marketing lifts engagement and revenue when execution actually connects.

Statistics · 2026
Email Marketing Industry Statistics
Email marketing is already producing scale and measurable lift, with global email volume reaching 376.4 billion emails per day in 2024 while engaged list deliverability averages 99.3% and opens on mobile account for 46% of total opens in 2023. Get the full breakdown of what this means for revenue and ROI, including automation rising from $3.2B in 2022 to $7.8B by 2030 and email responsible for 20 to 40% of total e commerce revenue.
Statistics · 2026
Affiliate Marketing Industry Statistics
See why 73% of affiliates want better fraud detection and how cookie deprecation cuts 20% of tracking accuracy, while competition in key niches jumped 22%. Then map the operational squeeze and growth upside from global affiliate spend projected to reach $24 billion by 2025 to 92% of consumers trusting affiliate recommendations.

Statistics · 2026
Cold Call Statistics
Top performers research before the cold call 74% of the time and still rely on timing and structure to win attention, with 4 to 5 PM calls converting 49% better and 35 to 40 second intros hitting the sweet spot. You will also see how silence after the pitch lifts yes rates by 32% and how multi channel outreach raises success by 27%, so you can compare what elites do against what most reps keep repeating.

Statistics · 2026
Word Of Mouth Statistics
With WOM shaping 60% of brand image in social circles and 84% of consumers trusting strong positive word of mouth, the page shows how quickly perception can flip when negativity hits. You will also see why peer recommendations outperform paid media, including the 5x awareness lift of WOM over paid ads, and what it takes to recover trust when online sentiment turns.

Statistics · 2026
Branding Marketing Industry Statistics
Brand value is swinging fast and the page explains what that shift means for marketing decisions, from Apple’s $1.25 trillion brand value in 2023 up 55% year over year to Amazon jumping to $708 billion and Tesla leaping to #10 on $125 billion. It also pairs the leaderboard with the friction brands now face, like 47% cutting branding budgets and 65% of CMOs struggling to measure brand ROI, plus how personalization, AI ethics, and channel consistency are reshaping strategy.

Statistics · 2026
Visual Content Statistics
Visual content is on pace to dominate everything, with 82% of internet traffic projected to be visual by 2025, and people are already spending 2.5 hours daily on video across platforms. This page maps what’s driving the shift from short form Gen Z surges to brand engagement gains like 94% more views than text, so you can spot where attention is really going next.