Market data
Environmental & Ecological
Explore environmental & ecological statistics and market research reports with sourced data and trend analysis.
Latest update:
 Claire Beaumont

Statistics · 2026
Cardboard Recycling Statistics
See how OCC recycling can swing from a $60 to $100 per ton value gap to major CO2e and cost outcomes, with recycling and material efficiency projected to cut global emissions by about 2.0 to 3.0 GtCO2e per year by 2030. You will also find what drives results from contamination and NIR sorting gains to steam price sensitivity and landfill tipping fees where recycling can come out 5% to 15% cheaper.
Statistics · 2026
Acid Rain Statistics
See how Europe cut transboundary PM2.5 exposure by 19 percent from 1990 to 2010 while 41 percent of freshwater bodies remain at risk from acidification and how the Acid Rain Program supports 100 percent SO2 continuous emissions monitoring compliance in the US. You will also find the economics and ecosystem stakes side by side, from tens of billions of dollars in late 20th century US damages to modern emissions controls delivering major sulfate dropoffs and measurable lake and precipitation pH recovery.

Statistics · 2026
Pollinator Decline Statistics
Across climate change forecasts, 33% of bumble bee species are predicted to decline, while 40% of global insect crop production faces losses if pollination support keeps slipping. The page connects that pressure to farmland reality, including 30% of wild pollinator species threatened by habitat loss and a 50% drop in pollinator richness in some European regions, to show exactly what is at stake for yields and food webs.
Statistics · 2026
Desertification Statistics
Desertification is already reshaping livelihoods at massive scale, with about 12 million hectares of productive land turning to desert each year and 2.6 billion people relying on affected landscapes. See how pressures such as overgrazing, drought intensification and soil salinization translate into real losses, from 12% lower crop yields on affected lands to $42 billion a year in lost ecosystem services and rising costs that reach $8.4 trillion by 2050.

Statistics · 2026
Water Contamination Statistics
Wastewater is tied to 15% of global greenhouse gas emissions, while unsafe water, sanitation, and hygiene drive 58% of diarrhoea cases and 1.2 billion people are at risk of schistosomiasis. See how compliance targets and monitoring tech, from WHO drinking water guideline values to PFAS testing and lead rule revisions, collide with the uncomfortable reality that 80% of wastewater is still discharged without adequate treatment.
Statistics · 2026
Global Deforestation Statistics
Forest loss is still running at 10.0 million hectares worldwide in 2022, about 27,000 hectares a day, and primary forests keep shrinking as agriculture and cattle push deeper into ecosystems. Global Deforestation connects the climate math, species risk, and health impacts from fire smoke to the policy pressure points that now shape markets, from EU EUDR to Amazon monitoring.

Statistics · 2026
Environmental Racism Statistics
Nearly all heavily polluted Superfund sites, with 99% in zip codes that already carry environmental burden demographics, underline how pollution and race intersect in who gets protected and who gets exposed. Follow how multiple peer reviewed studies and federal tracking efforts connect higher PM2.5 and hazardous air pollution exposure to communities of color, alongside national figures like WHO’s 9 out of 10 people breathing polluted air and the EPA estimate of about 24 million U.S. homes with lead based paint hazards.
Statistics · 2026
Endangered Animal Statistics
Habitat loss is driving the crisis for threatened wildlife, linked to 70% of species extinctions in the IUCN assessment framework and affecting 70% of threatened species worldwide, while conservation funding still falls far short of what biodiversity pledges demand. See how the latest enforcement and finance snapshots, from 10,000 plus CITES related seizures and 25% growth in wildlife cybercrime to major funding gaps and funding mobilization from MDBs, add up to one urgent question for 2025 and beyond: can protection keep pace with the damage.
Statistics · 2026
Plastic In Ocean Statistics
One page tracks how ocean plastic keeps compounding, with 5.25 trillion pieces estimated to be out there alongside about 11 million metric tons leaking in each year. It also connects the dots from packaging and single use to ingestion and microplastics, backed by trade and policy figures such as 19.8 million metric tons of plastic waste moved globally in 2019 and the 2021 shift in EU rules that start tightening what can and cannot be sent.
Statistics · 2026
Single Use Plastic Statistics
Single use plastics keep showing up where they matter most, with 11 million metric tons of plastic entering the ocean each year and packaging and other disposables driving roughly two thirds of plastic waste in practice. You will see how tight EU targets like 35% recycled content for plastic bottles sit beside evidence of microplastics throughout marine life and in human biomonitoring, making the case for policy to move faster than pollution does.

Statistics · 2026
Great Pacific Garbage Patch Statistics
See why the Great Pacific Garbage Patch is less a single blob and more a drifting, year to decade persistent spread of plastic that covers roughly 10 million km² in the North Pacific Subtropical Gyre, with plastic inputs averaging 10 million metric tons per year and about 93% of floating particles smaller than 5 mm. You will also see how that invisible size shift feeds into microplastics counts and impacts, from thousands of particles per m³ in gyres to measured ingestion and entanglement harm across marine wildlife.

Statistics · 2026
Haiti Deforestation Statistics
At Haiti’s peak demand, an estimated 1,000,000 tons of charcoal are produced or used each year, even as early 2000s estimates place forest loss at about 7,000 hectares annually and the country’s energy and cooking needs keep solid fuels deeply entrenched. The page connects that pressure to fragmentation, high landslide susceptibility, and measurable knock on effects like higher sediment export and flood peaks so you can see how deforestation becomes an everyday risk, not just a land cover trend.
Statistics · 2026
Water Scarcity In Africa Statistics
Even as drought and climate stress intensify, 39% of Africa’s population, about 440 million people, live in places with high water stress, while 700 million Africans are projected to be without access to improved water by 2030 under current trends. The page connects these service gaps to real outcomes, from widespread WASH-linked illness and deaths to shrinking basins like Lake Chad and rising pressure on already strained freshwater and hydropower systems.
Statistics · 2026
Waste Management Statistics
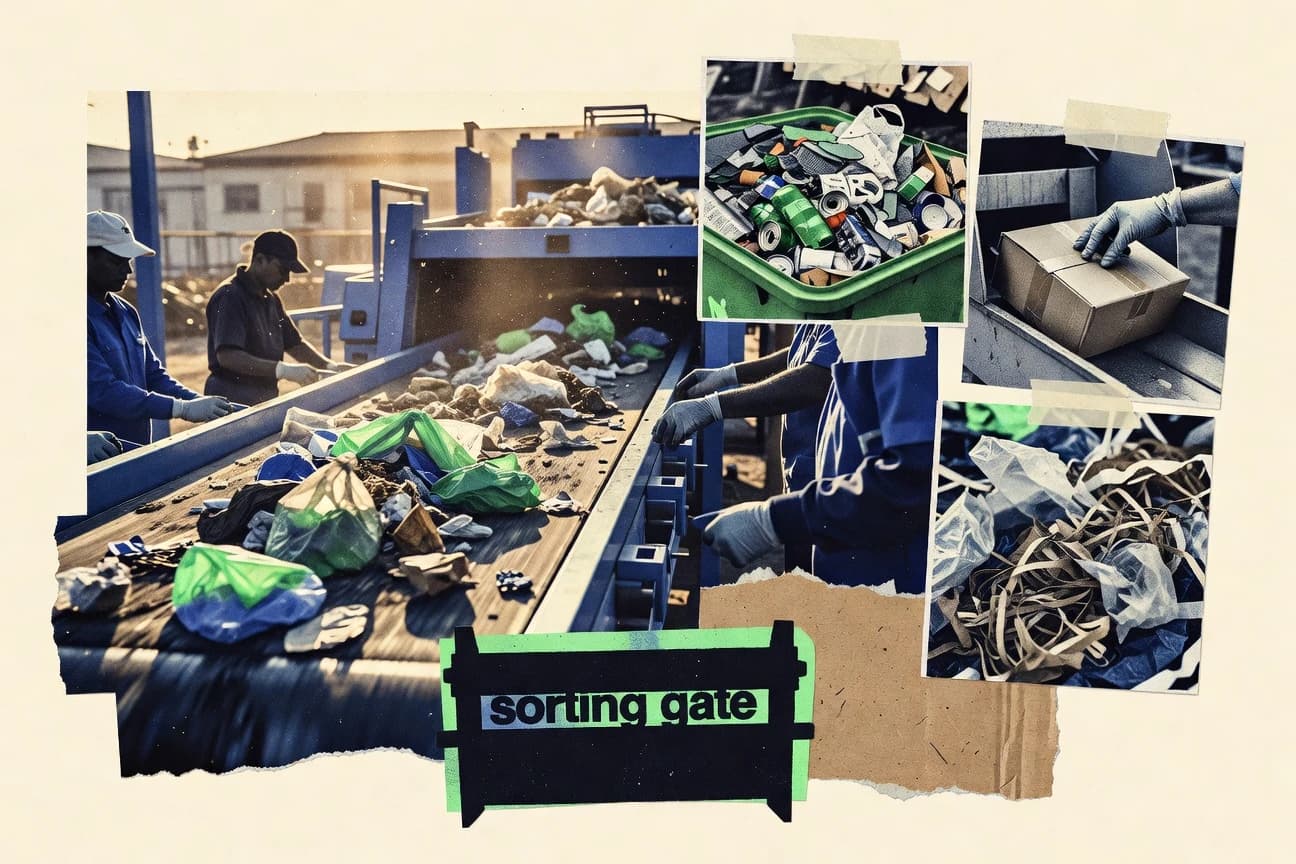
Food waste keeps showing up where you might least expect it, with 69% of U.S. households reporting they generate it at least weekly, while only a 5.9% U.S. composting rate turns that potential into soil instead of emissions. From 34% of methane tied to landfills to a global recycling and recovery gap that runs all the way to 65% EU recycling by 2035, this page connects the household bin to policy targets and market pressure.

Statistics · 2026
Illegal Wildlife Trade Statistics
Global illicit wildlife trade is estimated at US$1.4 billion per year and 2.5 million illegally traded animals, yet enforcement support is scaling alongside the threat with INTERPOL backing 4,000+ wildlife crime investigations in 2021 and CITES Secretariat capacity building on 200+ activities since 2010. Track where seizures and tracing gaps happen, from ivory and pangolin scale busts to online purchase instructions, and see how smuggling routes and laundering risks turn illegal commerce into a direct driver of extinction and public health harm.
Statistics · 2026
Habitat Loss Statistics
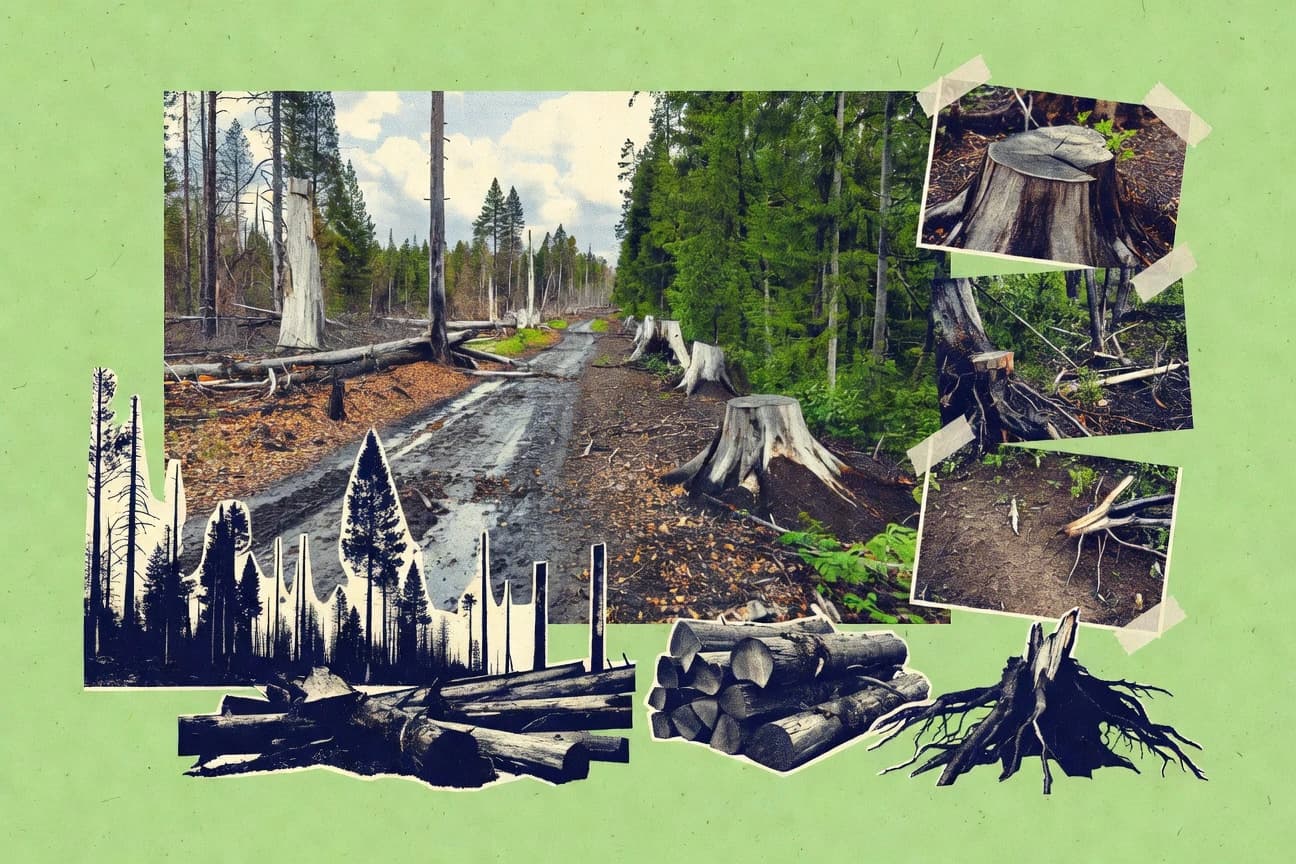
Habitat loss is the top threat to threatened species, and it shows up across taxa, even as the world converts land faster for agriculture and pasture than for any other purpose. See how shifting pressures are playing out now with 2023 Brazilian Amazon deforestation down to 13,235 km² after earlier peaks, while forests shrink and fragmentation, emissions, and extinction risk reinforce the same feedback loop.
Statistics · 2026
Wastewater Treatment Industry Statistics
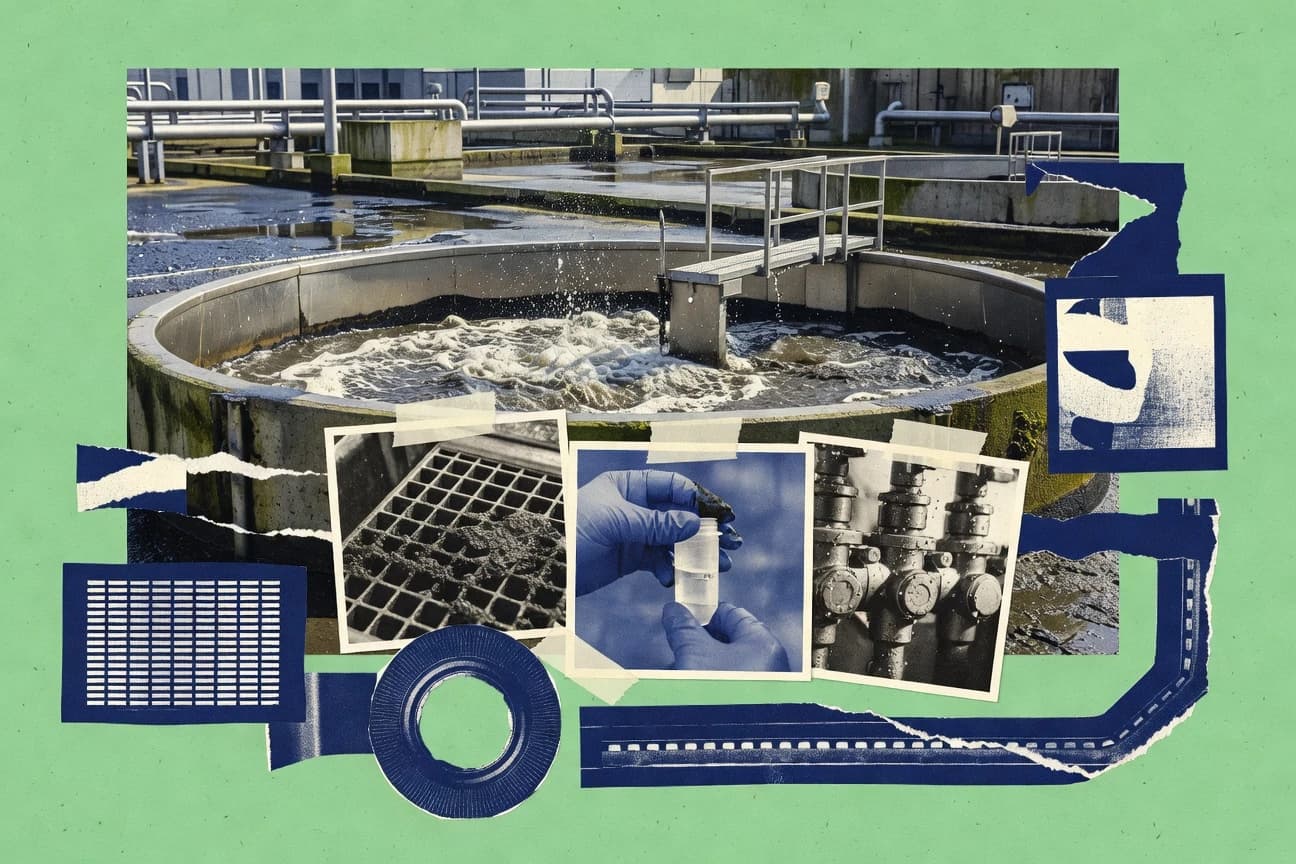
The page puts a spotlight on 2023 cost and performance pressures, from U.S. household wastewater bills rising 4 percent to an average of $0.004 per gallon to global energy costs hitting $0.50 to $1.50 per m³ where electricity can dominate budgets. It also tracks the hard tradeoffs behind upgrades such as nutrient retrofits adding $1 to $3 million per MG per day while membrane and sludge realities shape lifetime expenses, plus the climate and compliance signals that can swing spending fast.

Statistics · 2026
Cruise Ship Pollution Statistics
Cruise ships can pour 1.4 billion gallons of bilge water into the ocean every year while also belching nitrogen oxides and sulfur pollution that rivals or outstrips millions of cars, with one vessel burning up to 250 tons of fuel daily. The page connects air and water impacts from 80 million tons of CO2 in 2019 and runaway NOx growth through port air quality drops of 20 to 50 percent to the wildlife deaths and reef damage tied to cruise operations.
Statistics · 2026
Reforestation Statistics
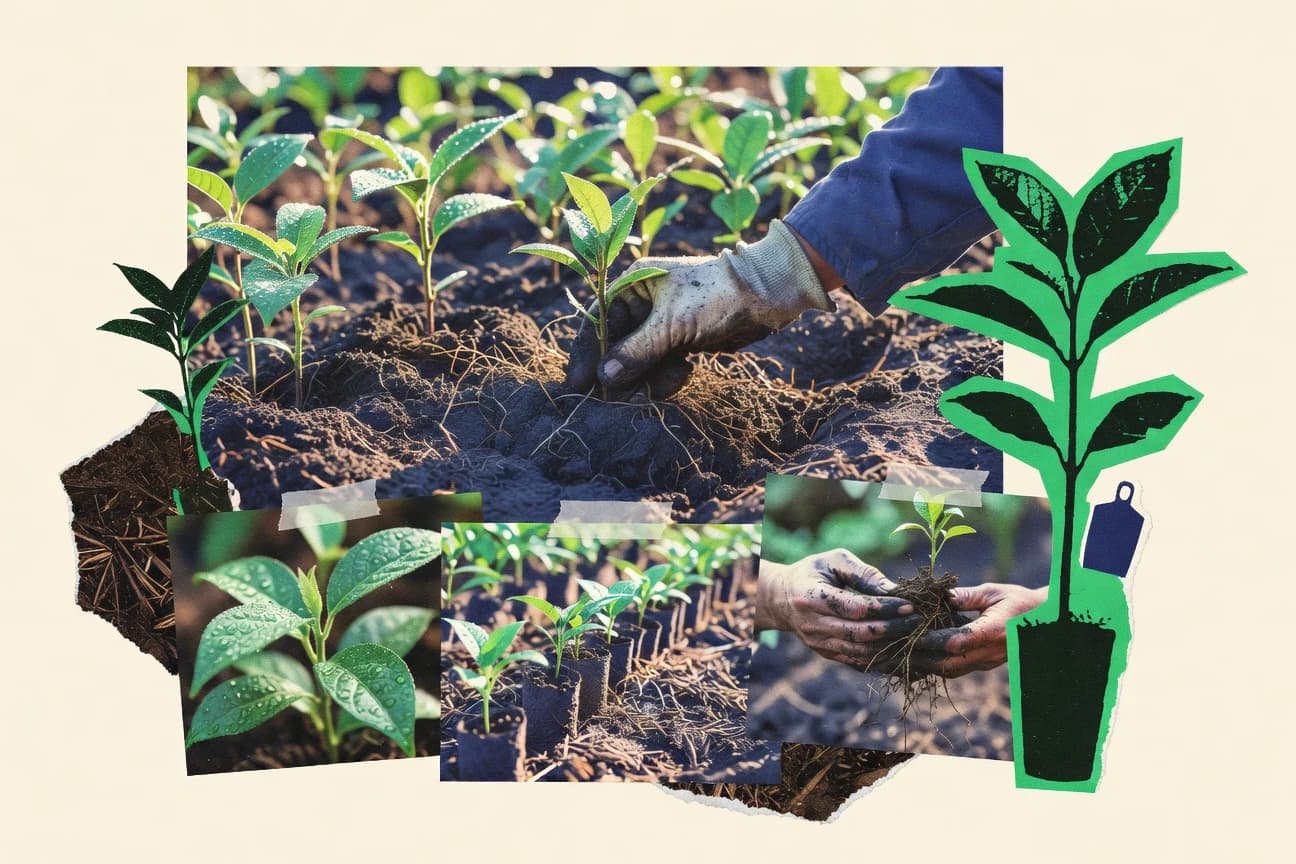
Reforestation success hinges on precision, because survival can sink below 50% after 5 years without monitoring and reforestation failure rates hit 20 to 50% from poor site selection and maintenance. This page also weighs what is actually at stake in 2025, from a $300 billion Bonn Challenge funding gap by 2030 to outcomes like drought stalling 40% of projects in semi arid zones and carbon accounting errors overestimating sinks by 20 to 50%.

Statistics · 2026
Plastic Bottle Statistics
Global PET water bottle demand is still staggering at 600+ billion single use bottles a year, with waste following just as relentlessly at 58 million tons of PET bottle trash annually and 90% not recycled. This page connects everyday buying patterns, $85 billion in 2022 sales revenue, and production and leakage impacts to show where change could actually matter.