Market data
Environmental & Ecological
Explore environmental & ecological statistics and market research reports with sourced data and trend analysis.
Latest update:
 Claire Beaumont

Statistics · 2026
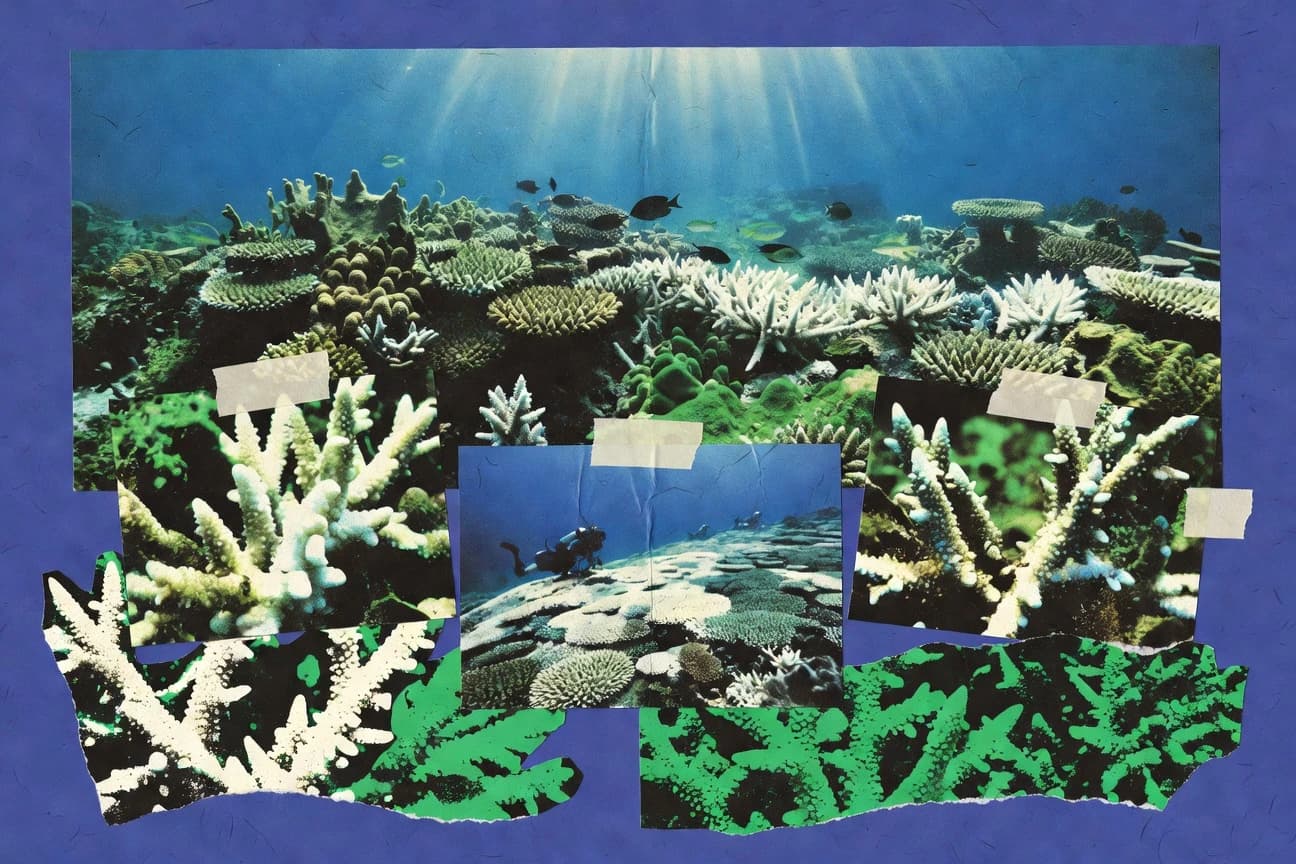
Coral Reef Bleaching
The 2023 to 2024 global bleaching event hit over 84% of the world’s reefs by March 2024, pushing NOAA heat stress levels to 84% of surveyed reefs and deepening a global loss already cut to 14% live coral cover by 2019 from 30% in 1980. With 35% of reefs losing more than half their cover since 2016 and post bleaching mortality running 80% higher when recovery stalls after 4 weeks, this page connects regional reef collapse rates to the deadlines that decide whether coral can come back.

Statistics · 2026
AI Environmental Impact
From single-model trainings that can emit 626,000 pounds of CO2 to data center impacts that climb toward 1,000 TWh of electricity demand by 2026, this page turns AI carbon and water use into hard, comparable figures. It also flags the uncomfortable link between acceleration and overhead with 2025 level projections and facility level reality, including waste and grid strain, so you can judge whether efficiency gains are keeping pace.
Statistics · 2026
Environmental Statistics
Air pollution is already baked into daily life, with PM2.5 breaching WHO guidance for 92% of the global population and 7 million premature deaths linked to air each year. This page connects those risks to the sources behind them, from vehicle exhaust and crop burning to shipping SO2 and wildfire smoke, and pairs them with the bigger climate and biodiversity pressures shaping what we breathe and what survives.
Statistics · 2026
Littering Statistics
Smokers are responsible for 75% of butt litter, yet targeted anti litter campaigns can cut it by 25% where they are deployed and fines averaging about $500 deter 40% of offenders. See how pressure, bins, and deposit schemes drive huge shifts like an 80% drop in bottle litter in Europe, alongside the high cost of marine and public harm reaching $2.5 trillion globally by 2050.
Statistics · 2026
Zero Waste Statistics
Zero waste is not just an ethics call, it can cut disposal costs by up to 20% and create 10 jobs per 1,000 tons diverted. See how recycling and reuse can squeeze out savings like $0.80 less energy cost per aluminum can and what 2025 and beyond targets are pushing cities to achieve.

Statistics · 2026
Circular Statistics
Smartphones keep climbing and global ownership hit 6.8 billion in 2023 while only 20% of people globally know how to recycle e-waste properly, so the practical gap is huge. Follow how circular fixes like AI sorting at 99% accuracy, digital product passports, and circular procurement are reshaping consumption, jobs, and emissions.
Statistics · 2026
Global Water Pollution Statistics
From coral reefs losing 14% of their global cover to pollution runoff to sewage pushing pathogens and cutting shellfish populations by 60% in polluted estuaries, Global Water Pollution lays out how contaminants drive ecosystem collapse and public health costs, with water pollution hitting $260 billion a year in health expenses alone. You will also see why plastics, PFAS, heavy metals, and nutrient runoff behave like slow disasters, turning fisheries, wetlands, and drinking water into the next crisis before most people notice.
Statistics · 2026
Single Use Plastics Statistics
Single use plastics turn everyday convenience into staggering volume and fallout, from 2.5 billion single use water bottles used worldwide each day to microplastics and toxins reaching people, wildlife, and oceans. See why global recycling is only 9% and how single use items drive 3.4 million tons of pollution to the Great Pacific Garbage Patch, plus what that means for policy and public choices right now.
Statistics · 2026
Noise Statistics
If you think subway and street noise is just “background,” the page shows how a 3 dB jump can halve safe exposure time and why typical rides reach 95 to 110 dB. You will also see how everyday sounds flip into immediate hearing danger, from a jackhammer at 110 dB after 1 minute to fireworks at 140 to 160 dB.

Statistics · 2026
China Pollution Statistics
China’s 2023 average PM2.5 sits at 32.2 μg/m³, about six times above WHO guidance, while local hotspots like Lanzhou average 55 μg/m³ and Urumqi hits PM10 annual average levels of 112 μg/m³. Get the full picture of what is driving the haze from coal heating spikes to industrial NOx and dust, and how pollution control since 2013 has still left millions of health and environmental impacts across cities and rivers.

Statistics · 2026
Animal Poaching Statistics
Even with CITES MIKE reporting a 30% decline in poaching levels across monitored sites from 2018 to 2022, the scale remains brutal, from over 412,000 African elephants illegally killed for ivory between 2010 and 2020 to poaching and trafficking patterns that still produce seizures like 986 kg of ivory linked to syndicates in Angola. Read this to see how enforcement, community action, and market pressure collide in real places, where hotspots can swing from hundreds of incidents down to near zero, while other species like rhinos and tigers face parallel, high demand-driven threats.

Statistics · 2026
Ocean Statistics
The ocean covers 36% of Earth’s surface yet touches lives on land through fisheries, trade, and climate, from 35% of CO₂ absorbed by the ocean to 3.2 billion people living near coastlines. This page pulls together the big, current pivots including aquaculture surpassing capture by volume and 2025 style urgency points like 90% of world trade moving by sea and growing plastic and ocean heat pressures.
Statistics · 2026
Environmental Science Statistics
Air pollution remains a global killer, tied to 7 million premature deaths in 2019, yet the page also tracks how climate change and infrastructure choices are reshaping risk, with 250,000 additional climate related deaths projected per year from 2030 to 2050 and global renewable capacity reaching about 4,150 GW by end 2023. Pairing health burdens from air, water, and sanitation with the momentum of monitoring, storage, and clean power, these statistics help you see where environmental pressure turns into measurable human outcomes.
Statistics · 2026
U.S. Plastic Waste Statistics
Even with recycling policies spreading through the states, the U.S. still saw only 9% of plastic waste recycled in practice, while 11.5% landed in landfills in 2016 and microplastics turn up in 41% of monitored groundwater wells. Track how U.S. plastic waste moves through trade, disposal, and weak recovery rates at a moment when import pressures and higher recovery capacity in the U.S. are not yet translating into real-world outcomes.

Statistics · 2026
Household Food Waste Statistics
Households drive much of the food waste picture, from 88 million tonnes a year across the EU to 6.2 million tonnes in South Korea and 2.5 million tonnes in Canada, yet behavior still shifts outcomes, with feedback and prompts typically cutting discard amounts by about 10% to 30% and targeted feedback reaching 15% in a US study. Climate context matters too, because food waste is estimated to account for around 6% of EU greenhouse gas emissions and lifecycle impacts are dominated by production and supply-chain emissions, making SDG 12.3 and the EU’s 50% reduction target feel urgent rather than abstract.

Statistics · 2026
Environmental And Ecological Statistics
With 6.3 million deaths tied to outdoor air pollution and 7.2 million linked to household smoke in 2019, the stakes are immediate while the planet keeps shifting. From the 2°C Paris warming cap and the 66% CO2 cut needed for a 1.5°C path to only 9% of plastic waste recycled and 0.12% of oceans in strict protection, these 2025-ready environmental and ecological statistics map the gap between targets and what is actually changing.

Statistics · 2026
Plastic Bag Statistics
Plastic bags are only part of the problem, yet plastic films and related packaging are estimated to make up 15% to 20% of marine plastic litter and up to 12 million metric tons of plastic leaks into the ocean each year from land sources. With EU rules charging at least 10 euro cents for lightweight carrier bags alongside evidence that bag films can linger for decades to centuries, this page connects the science of persistence to what policy and recycling can realistically change.

Statistics · 2026
Invasive Species Statistics
From Florida pythons cutting small mammal populations by up to 99% to invasive zebra mussels filtering up to 1 liter of water per mussel each day, these statistics show how a single invader can redraw entire ecosystems. You will also see the scale of global damage and control, including $120 billion spent annually to manage impacts, invasive pests reshaping food webs, and prevention and early response efforts that can stop new invasions before they take hold.
Statistics · 2026
Shipping Emissions Statistics
Decarbonizing shipping is not blocked by willpower but by price gaps and compliance math, from FuelEU Maritime lifecycle GHG cuts starting in 2025 and IMO DCS reporting due 31 May 2025 to EU ETS coverage hitting 100% after phase in. You will see why fuel combustion dominates CO2 estimates, how speed, routing, and hull care turn into real emissions swings, and where hydrogen only earns net zero if the hydrogen itself is low carbon.
Statistics · 2026
Ocean Plastic Pollution Statistics
Nearly all ocean plastic starts on land, and 11 million metric tons of waste enter the sea every year, with an estimated 91% ending up as microplastics smaller than 5 mm. This page connects that leakage pathway to what it means for ecosystems, people, and policy, including the fact that only about 9% of plastic is recycled globally.