GITNUX MARKETDATA
Browse Our Category
Marketing Advertising
Latest update:


Japanese Advertising Industry Statistics
Japan’s ad market keeps accelerating online, with internet advertising at ¥3.07 trillion in 2023 and mobile driving 72% of ad spend, while TV still earns consumers’ trust with 65% saying they trust TV ads more than digital. For a clear read on where power and budgets sit, the page maps agency concentration and modern tactics from Dentsu’s 28.5% market share to generative AI adoption at 52% of agencies, plus the shift in spend categories from cookie less budgets at 35% to search climbing 10.2% to ¥1.1 trillion.

Personalized Marketing Statistics
Personalization is driving measurable lift, yet it is also stuck behind consent, silos, and privacy strain with 82% of marketers naming data privacy the top challenge and regulatory compliance costs up 35% post-GDPR. This page breaks down what is working right now, from loyalty wins and higher conversion to the risks like third party cookie loss hitting 44% of strategies and personalization fatigue affecting 33% of consumers.

Business Website Statistics
First impressions form in under 50 milliseconds and 94% are design related, yet many business teams still lose customers to slow loads and weak security. This page connects the usability, conversion, SEO, and cyber protection stats that matter, from mobile speed keeping 90% of users under 2 seconds to HTTPS, schema markup, and WCAG contrast lifting reach and accessibility.

Omni Channel Statistics
Omnichannel is no longer a nice to have with retailers hitting 73% adoption by 2023 and omnichannel customers delivering 30% higher lifetime value than single channel. You will also see where the gaps still hurt, from 45% poor customer data quality and 62% legacy system integration bottlenecks to the 89% satisfaction lift when journeys are truly unified.

Instagram Influencer Statistics
Reels are now the default move, with 65% of influencer posts in 2024 being short form video, while carousels and UGC dramatically reshape engagement and perceived authenticity. Get the mix right with current numbers on posting cadence, trending audio, collaborations, and what actually pays, plus audience behavior shifts like higher shares from education and retention boosts from storytelling series.

Ecommerce Email Marketing Statistics
Cart recovery emails average 10.5% conversion and segmented campaigns can lift ecommerce conversions by 760%, while email is already projected to deliver 78% of ecommerce revenue by 2025. See the best performing subject line and automation triggers, plus list building and personalization tactics that turn clicks into sales without relying on broadcast blasts.
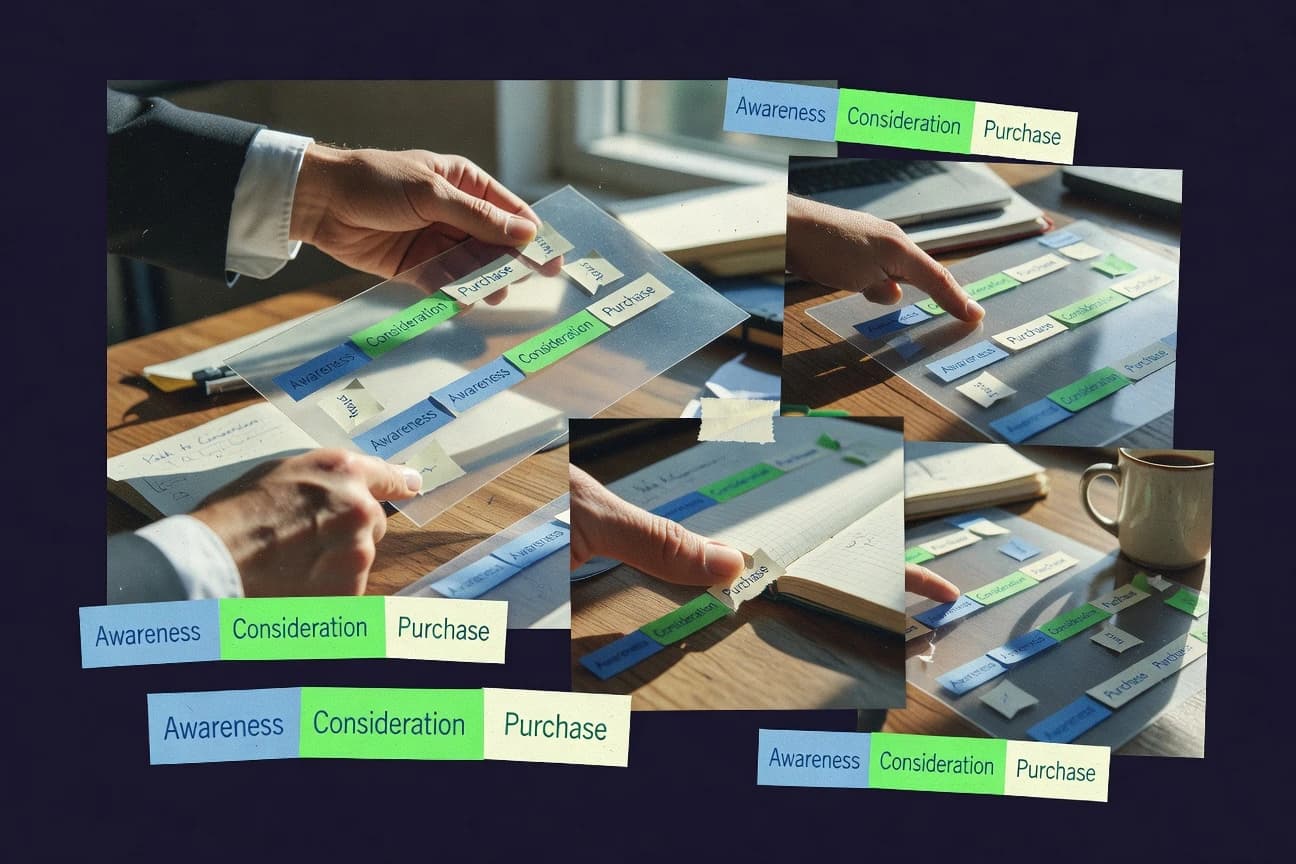
Buyers Journey Statistics
B2B buyers are already far down the path before sales ever gets involved, with 50 to 70 percent of the purchase process complete before a sales rep is contacted and 57 percent happening before the first salesperson conversation. On the same journey, 93 percent of B2B experiences start with online search and 82 percent of shoppers begin with search engines, turning awareness into a review and content sprint where knowing what they consume early can change how you win later.

Podcast Advertising Statistics
Host-read podcast ads are trusted by 73% of listeners and deliver 71% unaided recall, while ads outperform TV on brand association lift by 4.4x and complete at 92% for mid-roll. With 2025 forecasts pointing to podcasts claiming up to 50% of US audio ad spend and dynamic ad insertion boosting reach by 25%, this page captures why listeners engage, buy, and share in ways many other ad formats struggle to match.

Search Engine Users Statistics
From mobile-first habits like 60% of searches happening after desktop, to massive shifts such as Gen Z making up 27% of daily US searchers, this page pinpoints who is searching, when, and why. You will also see how search use varies by income, location, and devices, plus what 91.47% global market share by Google means for the rest.
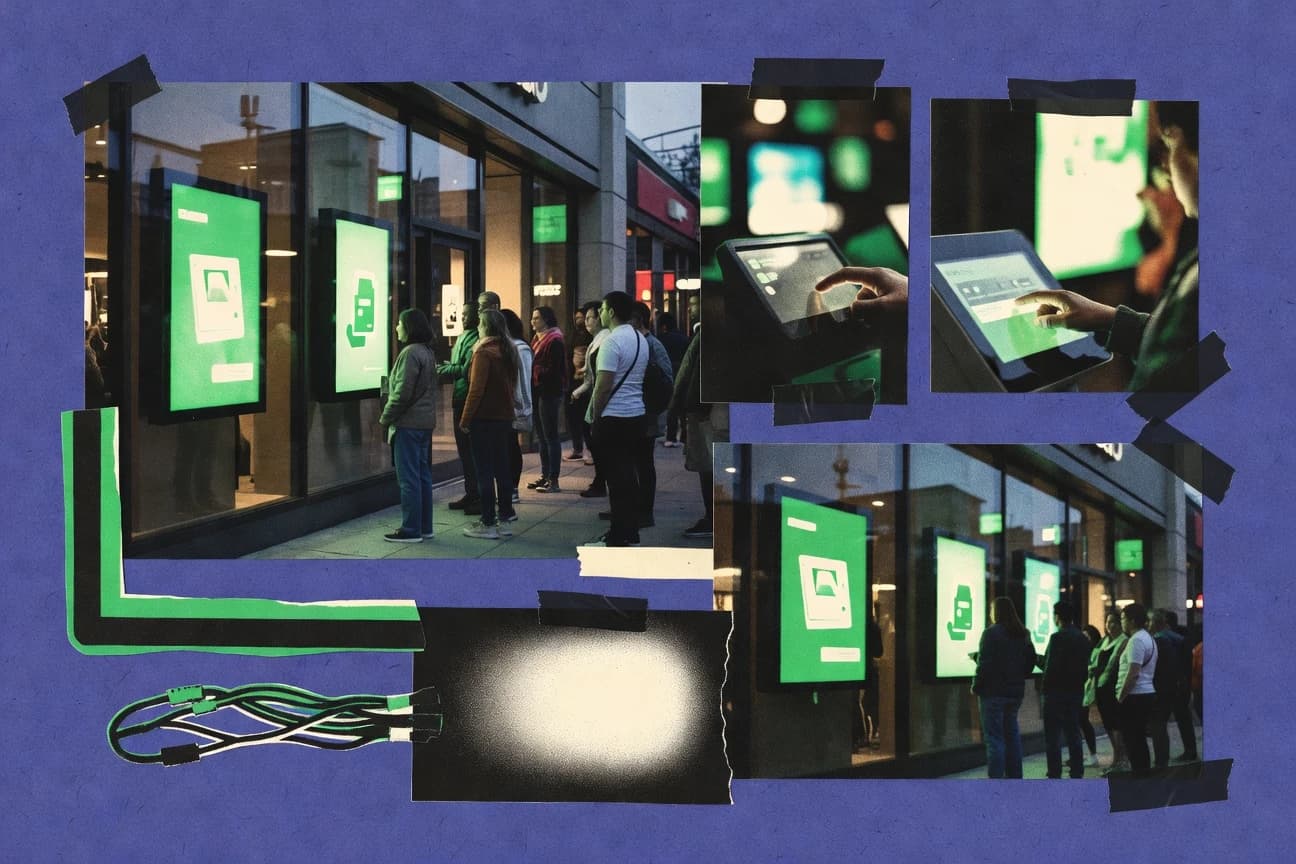
Digital Signage Benefits Statistics
Digital signage cuts through the static stuff fast, with brand recall rising to 86% compared with 70% for static media, while digital screens also lift visibility in out-of-home settings by 53% and improve loyalty by 34% through consistent branding. You will see how rotating campaigns extend ad lifespan by 60% and how interactive content drives measurable gains like a 47% boost in customer engagement and a 29.5% jump in average retail sales per customer.
Logo Statistics
Logo learning keeps proving its worth with fresh signals like 2022 and 2023 polling and adoption, including NetLogo in 70% of U.S. agent based modeling courses and 40% of AP CS Principles teachers using Snap. The page pairs that modern reach with classic effects like a 28% spatial reasoning boost and 2018 gains of 35% in geometry understanding to show why turtles, debugging, and constructionism remain so stubbornly effective.

Advertising On Social Media Statistics
Meta captured 61% of the global social ad market with $132 billion in 2023 spend, yet performance swings wildly by platform. See why Facebook retargeting can deliver 3x higher conversions than cold traffic and how TikTok topview ads hit 4.5x ROAS, alongside reach, CTR, and spend benchmarks like global social commerce ads totaling $992 billion.

Japan Advertising Industry Statistics
Japan’s digital advertising keeps accelerating with video, search, and programmatic reshaping budgets, reaching 3.51 trillion yen for digital ads in 2023 and pushing digital display programmatics to about 800 billion yen. You will see how that shift pulls massive shares away from traditional TV and print, while connected TV, native ads, retail media, and even influencer and affiliate spending create new winners across 2023 and the latest available market totals.

B2B Marketing Consulting Industry Statistics
B2B marketing consulting demand is being pulled by lead quality and revenue outcomes rather than volume with 82% of clients prioritizing pipeline-ready leads and 76% tying consultant success to pipeline growth. See how tech leads (64% of clients), ABM becomes the highest need for SaaS (67%), and budgets are set to rise with 68% planning 20% or more more spend while teams increasingly measure impact through attribution, intent data, and omnichannel orchestration.

New York Advertising Services Industry Statistics
New York’s advertising services ecosystem hit $15.2 billion in 2023 revenue and kept accelerating even as traditional media slid, with digital taking 72% of the $18.5 billion total and programmatic claiming 48% of digital. From CTV at $1.9 billion and social budgets up 22% to 6.8 billion to print down to 850 million and agencies generating 25.6 billion in billings, the page captures how NYC shifted money and talent toward connected, creator driven formats while privacy first and AI adoption moved from trend to operating system.

Connected Tv Advertising Industry Statistics
CTV advertising is delivering sharper outcomes than older TV formats, with interactive CTV ads hitting an 18% engagement rate and live sports pushing completion to 89% while personalization lifts purchase intent by 34%. The page also frames where CTV is headed next, including global CTV ad spend forecast to reach $34 billion by 2025 and a move to programmatic CTV buying capturing 75% of transactions in the US.

Global Marketing Industry Statistics
Global digital advertising already claims 62.5% of total ad spend, and connected to retail media, programmatic, and CTV, the momentum is pushing the market toward $1.3 trillion for retail media ad spending by 2028. If you want to spot where budgets are migrating and which channels are truly earning attention, this Global Marketing Industry statistics page lays out the sharp contrasts between soaring digital formats and declining traditional reach like print and radio.

Influencer Marketing Statistics
Most people trust influencers more than brand ads, with 61% of consumers putting influencer recommendations ahead of traditional promotions, and the ROI case gets sharper in 2025 with US influencer marketing projected to reach $8.4 billion by 2025. But trust is fragile, since fake followers cut belief by 45% and 75% of users ignore sponsored posts without clear disclosure, so this page maps the exact stats behind what actually earns attention, purchases, and measurable performance.

Omnichannel Marketing Statistics
Omnichannel marketing is already paying off, with retailers achieving 50% more repeat purchases within 30 days, while high quartile performers report 5.7x ROI and omnichannel loyalty programs lift CLV by 3.5x in e-commerce. But the same page reveals the drag on results too, with 41% of omnichannel implementations facing data silos, attribution accuracy stuck below 50% in 48% of teams, and the average rollout slipping by 6+ months when legacy systems get in the way.

Video Email Marketing Statistics
Video email is no longer a nice to have, with 65% of marketers planning to raise video budgets in 2024 and mobile video opens reaching 72% of total in 2023, while standard rich media struggles at just 2.6% average CTR. If you want proof that format and personalization change outcomes, the page also highlights 38% average CTR for video emails and up to 120% more sales, from shoppable product demos to milestone and post purchase retention series.