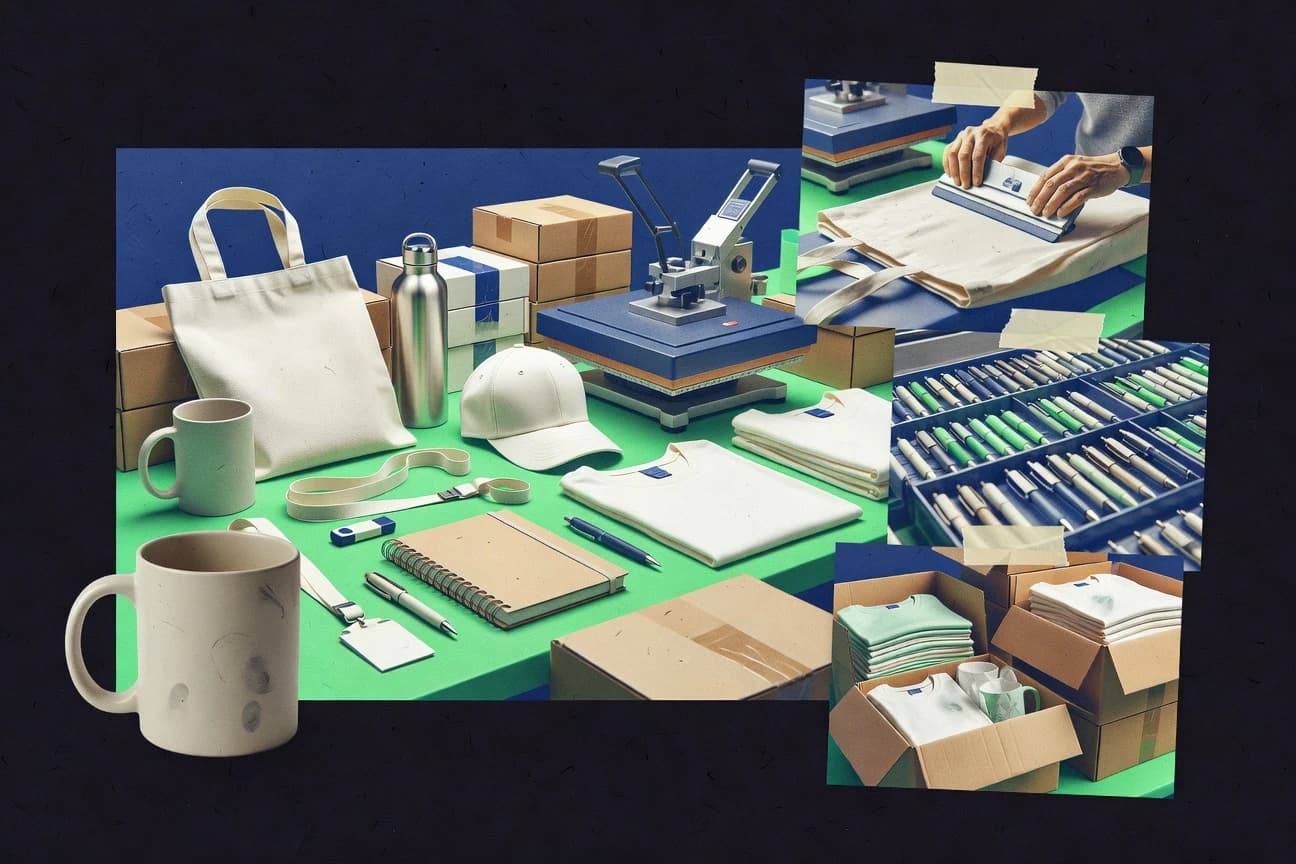
GitNux Logo
  • Editorial Process
Contact Us
Gitnux Logo
Contact Us
  • Home
  • Editorial Process
  • Contact Us
Gitnux Logo
  • Home
  • Blog
  • All Statistics
  • Services
  • Company
  • Privacy Policy
  • Contact
  • Partner
  • Careers
  • As Seen In

Our Services

Custom Market Research

Tailored research solutions designed around your specific business questions and strategic objectives.

Learn more →

Buy Industry Reports

Access comprehensive pre-made industry reports with instant download. Professional market intelligence at your fingertips.

Browse reports →

Software Advisory

Stop wasting months evaluating software vendors. Our analysts leverage 1,000+ AI-verified Best Lists to recommend the right tool for your business in 2–4 weeks.

Learn more →

Popular Categories

Ai In IndustryTechnology Digital MediaSafety AccidentsEntertainment EventsMedical Conditions DisordersMental Health PsychologyMarketing AdvertisingEducation LearningFinance Financial ServicesManufacturing EngineeringSocial Issues Societal TrendsPublic Safety CrimeHealthcare MedicineFood NutritionConsumer RetailHealth MedicineConstruction InfrastructureSports RecreationHr In IndustryDiversity Equity And Inclusion In IndustryGlobal Regional IndustriesBusiness FinanceCustomer Experience In IndustrySustainability In Industry

Find us on

Clutch · Sortlist · DesignRush · G2

GoodFirms · Crunchbase · Tracxn

How we make money

Gitnux.org is an independent market research platform. Primarily, we generate revenue on Gitnux through research projects we conduct for clients & external banner advertising. If we receive a commission for products or services, this is indicated with *.

© 2026 Gitnux. Independent market research platform.

Logos provided by Logo.dev

  1. Home
  2. Marketing Advertising
  3. Promotional Merchandise Industry Statistics
Promotional Merchandise Industry Statistics

GITNUXREPORT 2026

Promotional Merchandise Industry Statistics

The promotional merchandise industry is thriving globally with strong growth and exceptional marketing returns.

59 statistics18 sources4 sections6 min readUpdated 2 days ago

Key Statistics

Statistic 1

5.7% year-over-year growth for the global promotional products market is forecast for 2024

Statistic 2

$26.0 billion projected global spend on promotional products in 2024 (including promotional gifts and souvenirs)

Statistic 3

$24.0 billion global promotional gifts and souvenirs market in 2023 (market size estimate)

Statistic 4

3.2% CAGR projected for the promotional gifts and souvenirs market over 2024–2029

Statistic 5

$10.2 billion global advertising specialties market size in 2023

Statistic 6

Advertising specialties market is projected to reach $14.0 billion by 2032

Statistic 7

Advertising specialties market projected CAGR of 3.4% during 2024–2032

Statistic 8

$3.7 billion estimated advertising specialties market in North America in 2023

Statistic 9

$5.8 billion estimated advertising specialties market in Europe in 2023

Statistic 10

$1.7 billion estimated advertising specialties market in Asia-Pacific in 2023

Statistic 11

$5.2 billion estimated advertising specialties market in China in 2023

Statistic 12

4.5% of global advertising specialties market value is expected to be driven by Asia-Pacific through 2032 (regional share estimate)

Statistic 13

2.5% year-over-year increase in U.S. advertising expenditures allocated to promotional products-type spend (forecast estimate)

Statistic 14

3.5% expected growth in U.S. advertising in 2024 (forecast estimate)

Statistic 15

In the U.S., advertising spending reached $223.3 billion in 2023 (industry statistic)

Statistic 16

In the U.S., advertising spending is projected to reach $257.2 billion in 2025 (forecast estimate)

Statistic 17

51% of global marketers said they plan to increase spending on personalization (survey estimate)

Statistic 18

62% of marketers said personalization increases customer engagement (survey estimate)

Statistic 19

70% of marketers say personalization increases revenue (survey estimate)

Statistic 20

38% of marketers say they achieved improved ROI from personalization (survey estimate)

Statistic 21

25% of marketers use promotional products for trade show participation (survey statistic)

Statistic 22

37% of marketers use promotional products for events (survey statistic)

Statistic 23

44% of marketers use promotional products for brand awareness (survey statistic)

Statistic 24

29% of marketers use promotional products for lead generation (survey statistic)

Statistic 25

33% of marketers use promotional products for customer retention (survey statistic)

Statistic 26

28% of marketers use promotional products for employee recognition (survey statistic)

Statistic 27

19% of marketers use promotional products for community involvement/CSR (survey statistic)

Statistic 28

10% of marketers use promotional products for product launches (survey statistic)

Statistic 29

14% of marketers use promotional products for sales promotions (survey statistic)

Statistic 30

6% of marketers use promotional products for recruiting (survey statistic)

Statistic 31

22% of marketers said sustainability is a key driver when selecting promotional products (survey statistic)

Statistic 32

39% of marketers said they expect more demand for eco-friendly promotional products (survey statistic)

Statistic 33

31% of marketers said they increased sustainable product sourcing in the last year (survey statistic)

Statistic 34

25% of marketers said recycled materials are a top sustainability attribute (survey statistic)

Statistic 35

18% of marketers said they prioritize items with certifications (survey statistic)

Statistic 36

16% of marketers said packaging reductions are an important sustainability attribute (survey statistic)

Statistic 37

44% of marketers said they want to reduce environmental impact in promotional campaigns (survey statistic)

Statistic 38

12% of marketers said they plan to increase spend on sustainable promotional products by more than 10% (survey statistic)

Statistic 39

21% of buyers said they select promotional items based on the ability to personalize (survey statistic)

Statistic 40

37% of buyers said they want more choices in customization (survey statistic)

Statistic 41

29% of buyers said personalized promotional products are increasing in importance (survey statistic)

Statistic 42

17% of buyers said they use QR codes on promotional items (survey statistic)

Statistic 43

23% of buyers said they use promo items with digital engagement (survey statistic)

Statistic 44

15% of buyers said they use items with augmented reality experiences (survey statistic)

Statistic 45

As of 2024, 18.9% of U.S. adults had a disability status (demographic factor relevant to workforce inclusion practices)

Statistic 46

28% of marketers said they use web-to-print portals to manage promotional campaigns (survey statistic)

Statistic 47

22% of marketers said automation reduces administrative effort in promotional campaigns (survey statistic)

Statistic 48

31% of marketers said improved artwork approval workflows reduce revisions (survey statistic)

Statistic 49

19% of marketers said they use digital proofing to speed up production timelines (survey statistic)

Statistic 50

26% of marketers said they use promotional product CRMs or marketing automation tools (survey statistic)

Statistic 51

34% of marketers said they improved tracking of campaign performance (survey statistic)

Statistic 52

In 2023, the U.S. unemployment rate averaged 3.6% (macro labor conditions affecting industry staffing costs)

Statistic 53

In 2023, U.S. average hourly earnings for production and nonsupervisory employees increased 4.1% year over year (wage pressure affecting promo manufacturing)

Statistic 54

In 2023, U.S. average hourly earnings for printing/related industries increased 4.0% year over year (wage proxy)

Statistic 55

U.S. federal minimum wage increased to $7.25/hour (baseline; affects lowest labor costs)

Statistic 56

The U.S. retail inflation rate averaged 3.4% in 2023 (inflation affecting input and freight costs)

Statistic 57

The U.S. CPI for all items increased 4.1% year over year in March 2024 (inflation pressure on promo costs)

Statistic 58

In the U.S., the cost of advertising services rose 4.0% year over year in 2022 (BLS CPI component proxy)

Statistic 59

The U.S. consumer price index for printing and related support activities changed (BLS component series indicator)

1/59
Sources
Trusted by 500+ publications
Harvard Business ReviewThe GuardianFortuneMicrosoftWorld Economic ForumFast Company
Harvard Business ReviewThe GuardianFortune+497
Henrik Dahl

Written by Henrik Dahl·Edited by Abigail Foster·Fact-checked by Katherine Brennan

Published Feb 13, 2026·Last verified Apr 16, 2026·Next review: Oct 2026
Fact-checked via 4-step process— how we build this report
01Primary Source Collection

Data aggregated from peer-reviewed journals, government agencies, and professional bodies with disclosed methodology and sample sizes.

02Editorial Curation

Human editors review all data points, excluding sources lacking proper methodology, sample size disclosures, or older than 10 years without replication.

03AI-Powered Verification

Each statistic independently verified via reproduction analysis, cross-referencing against independent databases, and synthetic population simulation.

04Human Cross-Check

Final human editorial review of all AI-verified statistics. Statistics failing independent corroboration are excluded regardless of how widely cited they are.

Read our full methodology →

Statistics that fail independent corroboration are excluded.

With the global promotional products market forecast to reach $26.0 billion in 2024 after 5.7% year over year growth, this post breaks down the key numbers behind everything from advertising specialties to sustainability and personalization trends shaping what brands will spend next.

Key Takeaways

  • 15.7% year-over-year growth for the global promotional products market is forecast for 2024
  • 2$26.0 billion projected global spend on promotional products in 2024 (including promotional gifts and souvenirs)
  • 3$24.0 billion global promotional gifts and souvenirs market in 2023 (market size estimate)
  • 451% of global marketers said they plan to increase spending on personalization (survey estimate)
  • 562% of marketers said personalization increases customer engagement (survey estimate)
  • 670% of marketers say personalization increases revenue (survey estimate)
  • 728% of marketers said they use web-to-print portals to manage promotional campaigns (survey statistic)
  • 822% of marketers said automation reduces administrative effort in promotional campaigns (survey statistic)
  • 931% of marketers said improved artwork approval workflows reduce revisions (survey statistic)
  • 10In 2023, the U.S. unemployment rate averaged 3.6% (macro labor conditions affecting industry staffing costs)
  • 11In 2023, U.S. average hourly earnings for production and nonsupervisory employees increased 4.1% year over year (wage pressure affecting promo manufacturing)
  • 12In 2023, U.S. average hourly earnings for printing/related industries increased 4.0% year over year (wage proxy)

Promotional products are set to grow in 2024, driven by personalization and sustainable demand.

Market Size

15.7% year-over-year growth for the global promotional products market is forecast for 2024[1]
Verified
2$26.0 billion projected global spend on promotional products in 2024 (including promotional gifts and souvenirs)[1]
Verified
3$24.0 billion global promotional gifts and souvenirs market in 2023 (market size estimate)[1]
Verified
43.2% CAGR projected for the promotional gifts and souvenirs market over 2024–2029[1]
Directional
5$10.2 billion global advertising specialties market size in 2023[2]
Single source
6Advertising specialties market is projected to reach $14.0 billion by 2032[2]
Verified
7Advertising specialties market projected CAGR of 3.4% during 2024–2032[2]
Verified
8$3.7 billion estimated advertising specialties market in North America in 2023[2]
Verified
9$5.8 billion estimated advertising specialties market in Europe in 2023[2]
Directional
10$1.7 billion estimated advertising specialties market in Asia-Pacific in 2023[2]
Single source
11$5.2 billion estimated advertising specialties market in China in 2023[2]
Verified
124.5% of global advertising specialties market value is expected to be driven by Asia-Pacific through 2032 (regional share estimate)[2]
Verified
132.5% year-over-year increase in U.S. advertising expenditures allocated to promotional products-type spend (forecast estimate)[3]
Verified
143.5% expected growth in U.S. advertising in 2024 (forecast estimate)[4]
Directional
15In the U.S., advertising spending reached $223.3 billion in 2023 (industry statistic)[5]
Single source
16In the U.S., advertising spending is projected to reach $257.2 billion in 2025 (forecast estimate)[6]
Verified

Market Size Interpretation

With the global promotional products market forecast to grow 5.7% in 2024 to $26.0 billion, steady expansion of promotional gifts and souvenirs at a 3.2% CAGR through 2029 signals that brands are increasingly allocating consistent budget to these items rather than relying on short term bursts.

Industry Trends

151% of global marketers said they plan to increase spending on personalization (survey estimate)[7]
Verified
262% of marketers said personalization increases customer engagement (survey estimate)[7]
Verified
370% of marketers say personalization increases revenue (survey estimate)[7]
Verified
438% of marketers say they achieved improved ROI from personalization (survey estimate)[7]
Directional
525% of marketers use promotional products for trade show participation (survey statistic)[8]
Single source
637% of marketers use promotional products for events (survey statistic)[8]
Verified
744% of marketers use promotional products for brand awareness (survey statistic)[8]
Verified
829% of marketers use promotional products for lead generation (survey statistic)[8]
Verified
933% of marketers use promotional products for customer retention (survey statistic)[8]
Directional
1028% of marketers use promotional products for employee recognition (survey statistic)[8]
Single source
1119% of marketers use promotional products for community involvement/CSR (survey statistic)[8]
Verified
1210% of marketers use promotional products for product launches (survey statistic)[8]
Verified
1314% of marketers use promotional products for sales promotions (survey statistic)[8]
Verified
146% of marketers use promotional products for recruiting (survey statistic)[8]
Directional
1522% of marketers said sustainability is a key driver when selecting promotional products (survey statistic)[9]
Single source
1639% of marketers said they expect more demand for eco-friendly promotional products (survey statistic)[9]
Verified
1731% of marketers said they increased sustainable product sourcing in the last year (survey statistic)[9]
Verified
1825% of marketers said recycled materials are a top sustainability attribute (survey statistic)[9]
Verified
1918% of marketers said they prioritize items with certifications (survey statistic)[9]
Directional
2016% of marketers said packaging reductions are an important sustainability attribute (survey statistic)[9]
Single source
2144% of marketers said they want to reduce environmental impact in promotional campaigns (survey statistic)[9]
Verified
2212% of marketers said they plan to increase spend on sustainable promotional products by more than 10% (survey statistic)[9]
Verified
2321% of buyers said they select promotional items based on the ability to personalize (survey statistic)[8]
Verified
2437% of buyers said they want more choices in customization (survey statistic)[8]
Directional
2529% of buyers said personalized promotional products are increasing in importance (survey statistic)[8]
Single source
2617% of buyers said they use QR codes on promotional items (survey statistic)[8]
Verified
2723% of buyers said they use promo items with digital engagement (survey statistic)[8]
Verified
2815% of buyers said they use items with augmented reality experiences (survey statistic)[8]
Verified
29As of 2024, 18.9% of U.S. adults had a disability status (demographic factor relevant to workforce inclusion practices)[10]
Directional

Industry Trends Interpretation

With 70% of marketers reporting that personalization increases revenue, and 51% planning to raise spending on it, personalization is clearly becoming a revenue growth strategy even as sustainable and eco-friendly promotional demand rises, with 44% aiming to reduce environmental impact.

Performance Metrics

128% of marketers said they use web-to-print portals to manage promotional campaigns (survey statistic)[11]
Verified
222% of marketers said automation reduces administrative effort in promotional campaigns (survey statistic)[11]
Verified
331% of marketers said improved artwork approval workflows reduce revisions (survey statistic)[11]
Verified
419% of marketers said they use digital proofing to speed up production timelines (survey statistic)[11]
Directional
526% of marketers said they use promotional product CRMs or marketing automation tools (survey statistic)[11]
Single source
634% of marketers said they improved tracking of campaign performance (survey statistic)[11]
Verified

Performance Metrics Interpretation

Nearly half of marketers are already seeing measurable gains from operational and workflow upgrades, with 34% improving campaign performance tracking and up to 31% reducing revisions through better artwork approval workflows.

Cost Analysis

1In 2023, the U.S. unemployment rate averaged 3.6% (macro labor conditions affecting industry staffing costs)[12]
Verified
2In 2023, U.S. average hourly earnings for production and nonsupervisory employees increased 4.1% year over year (wage pressure affecting promo manufacturing)[13]
Verified
3In 2023, U.S. average hourly earnings for printing/related industries increased 4.0% year over year (wage proxy)[14]
Verified
4U.S. federal minimum wage increased to $7.25/hour (baseline; affects lowest labor costs)[15]
Directional
5The U.S. retail inflation rate averaged 3.4% in 2023 (inflation affecting input and freight costs)[16]
Single source
6The U.S. CPI for all items increased 4.1% year over year in March 2024 (inflation pressure on promo costs)[17]
Verified
7In the U.S., the cost of advertising services rose 4.0% year over year in 2022 (BLS CPI component proxy)[18]
Verified
8The U.S. consumer price index for printing and related support activities changed (BLS component series indicator)[16]
Verified

Cost Analysis Interpretation

With wage growth running at about 4.0% to 4.1% in both production and printing-related industries during 2023, and inflation still at 4.1% year over year for the overall CPI in March 2024, promotional merchandise costs appear pressured on both the labor and broader price fronts.

References

reportlinker.comreportlinker.com
  • 1reportlinker.com/p06407867/Promotional-Gifts-and-Souvenirs-Market-Size-Share-Trends-Analysis.html
imarcgroup.comimarcgroup.com
  • 2imarcgroup.com/advertising-specialties-market
statista.comstatista.com
  • 3statista.com/topics/852/advertising/
  • 4statista.com/outlook/amo/advertising/united-states
  • 5statista.com/statistics/271824/advertising-spending-in-the-united-states/
  • 6statista.com/statistics/270972/advertising-spending-in-the-us/
salesforce.comsalesforce.com
  • 7salesforce.com/resources/research-reports/state-of-marketing/
ppai.orgppai.org
  • 8ppai.org/trends/
  • 9ppai.org/sustainability/
  • 11ppai.org/technology/
cdc.govcdc.gov
  • 10cdc.gov/nchs/fastats/disability.htm
bls.govbls.gov
  • 12bls.gov/news.release/empsit.t05.htm
  • 13bls.gov/news.release/empsit.t08.htm
  • 14bls.gov/oes/current/oes513999.htm
  • 16bls.gov/cpi/
  • 17bls.gov/news.release/cpi.htm
  • 18bls.gov/cpi/tables/supplemental-files/home.htm
dol.govdol.gov
  • 15dol.gov/agencies/whd/minimum-wage/history

On this page

  1. 01Key Takeaways
  2. 02Market Size
  3. 03Industry Trends
  4. 04Performance Metrics
  5. 05Cost Analysis
Henrik Dahl

Henrik Dahl

Author

Abigail Foster
Editor
Katherine Brennan
Fact Checker

Our Commitment to Accuracy

  • Rigorous fact-checking process
  • Data from reputable sources
  • Regular updates to ensure relevance
Learn more

Explore More In This Category

  • Sales Follow-Up Statistics
  • Marketing Industry Statistics
  • Consumer Insights Industry Statistics
  • Video Content Marketing Statistics
  • Newspaper Advertising Statistics
  • Direct Response Marketing Statistics