GITNUX MARKETDATA
Browse Our Category
Food Service Restaurants
Latest update:


Restaurant Customer Service Statistics
Restaurant guests pay 140% more when service tops expectations, yet after a service failure 33% say they will not return, making every first contact and every minute of handling time matter. From 83% rating online reviews as important to the fact that a 1 star Yelp lift can drive a 5% revenue gain, these customer service metrics help you protect satisfaction, margins, and repeat visits all at once.
Brazil Restaurant Industry Statistics
Restaurant activity in Brazil is quietly accelerating with a 1.2% year over year rise in food and beverage service activities in 2023 and a 5.7% jump in restaurant volume in 2024 Q1, even as margins are pressured by costs that typically consume 2.4% of sales for energy and an 8.2% inflation bite on food and non alcoholic beverages. For anyone betting on what happens next, the page connects demand signals like 30 minutes median delivery time and WhatsApp daily use with operating realities such as R$ 71.3 billion in annual restaurant revenue and 19.5% of workers in the sector living with informality.

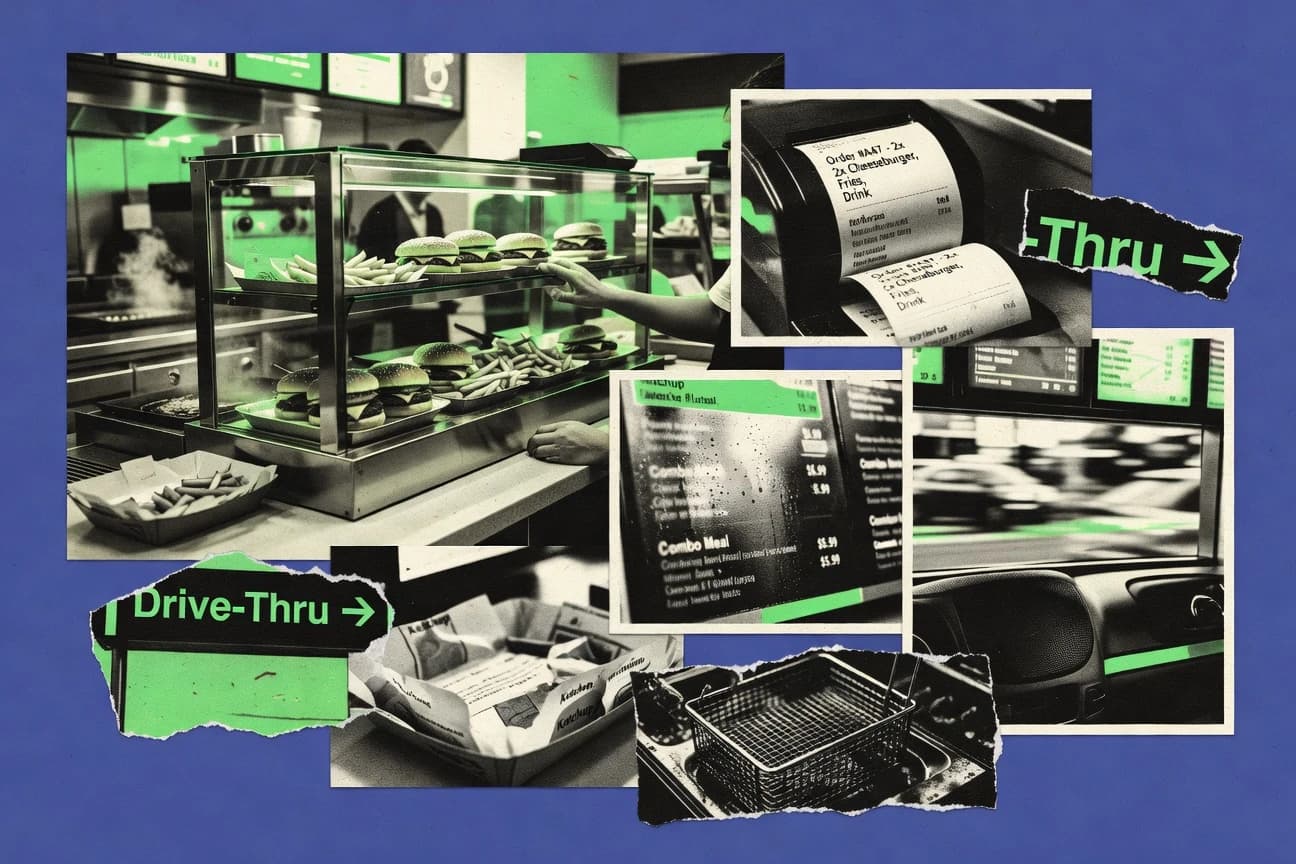
Drive Thru Restaurant Statistics
Drive-thru channels handled 58% of QSR visits, turning lane design, order accuracy, and labor costs into the real competitive battleground behind quick service. See how U.S. fast food at $324.6B and 196,400 QSR locations collide with the details that matter, from a 1% lift in order accuracy reducing remakes and credits to digital ordering and queue changes that cut time per order.

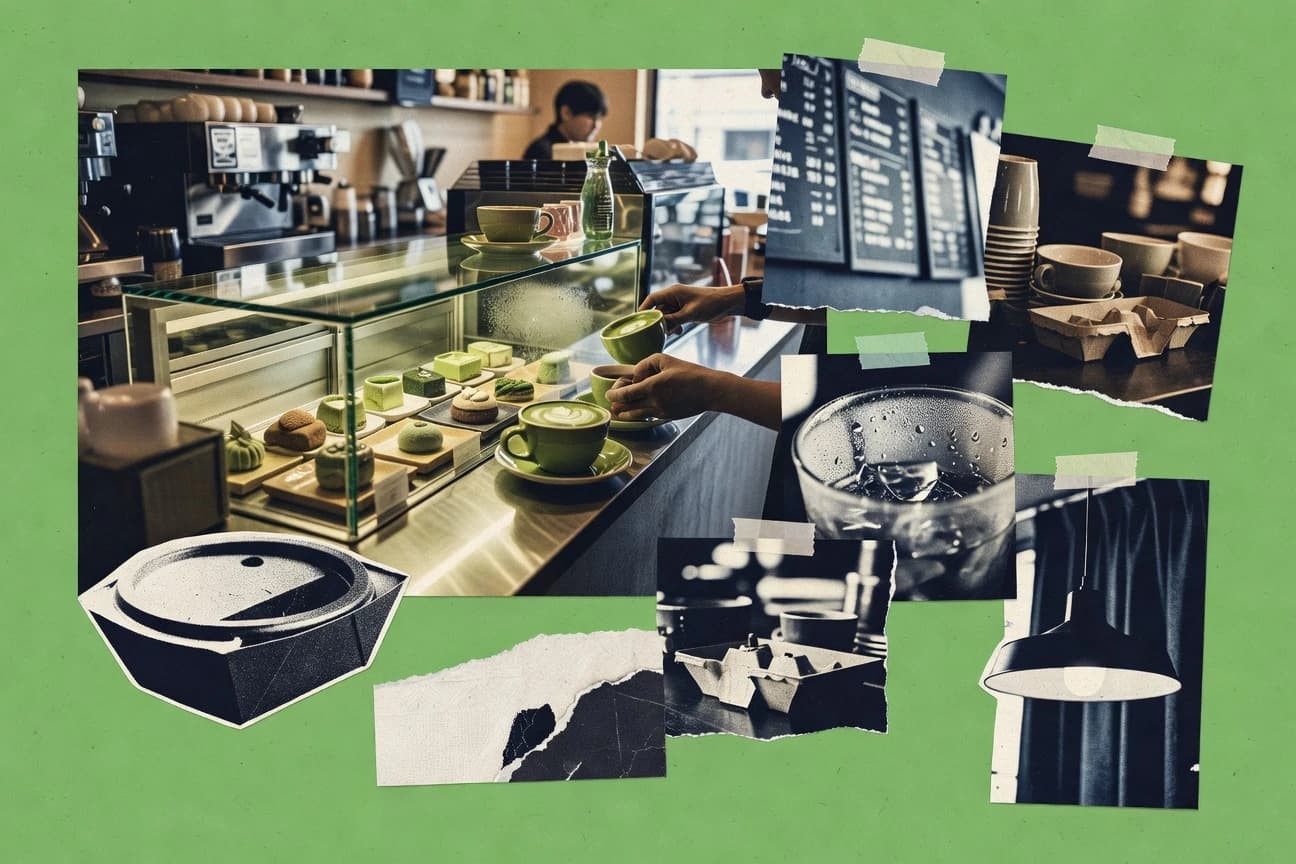
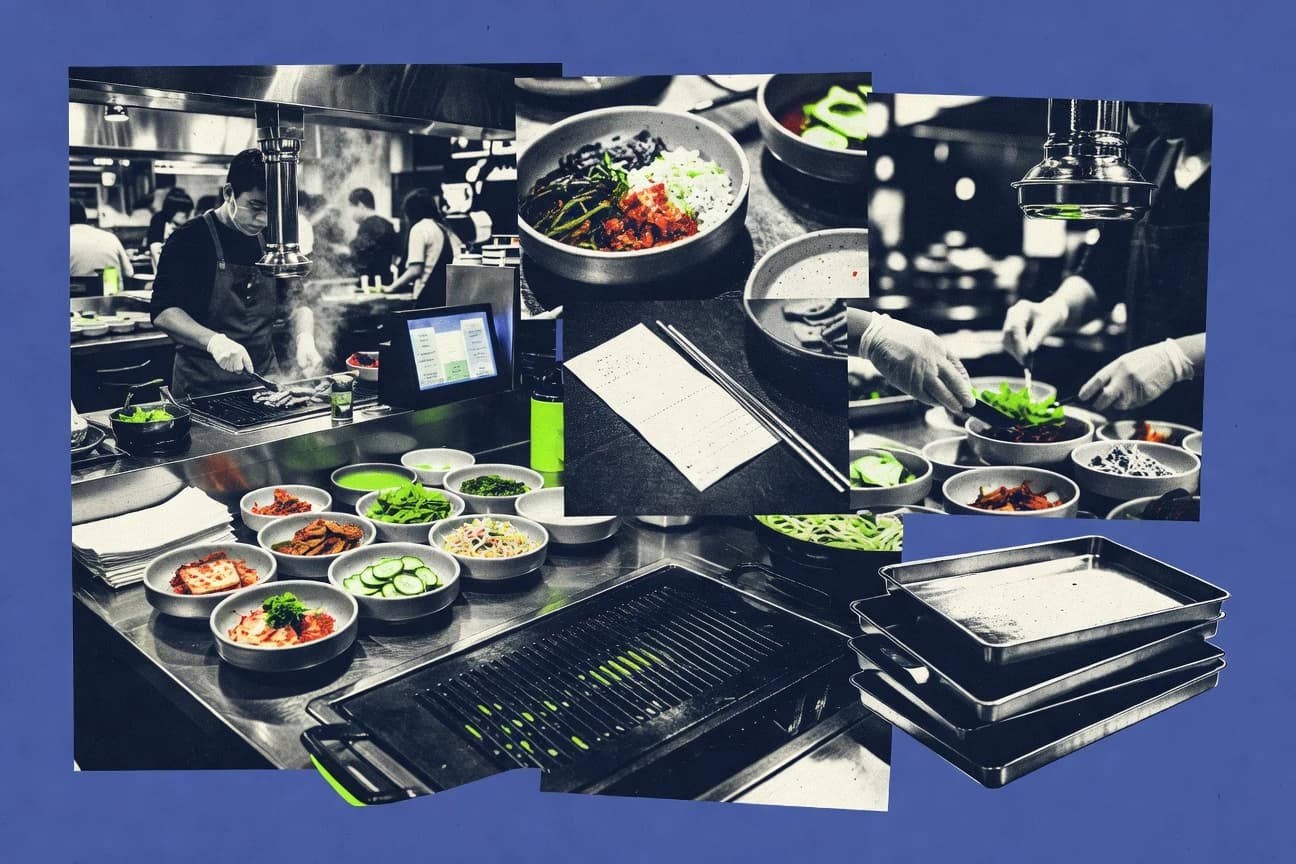
South Korea Cafe Industry Statistics
With South Korea’s cafe ecosystem topping 120,000 outlets in 2023 and total revenue reaching 18.5 trillion KRW, the balance of power is shifting fast as Starbucks sits at 32% share while boutique cafes under 50 sqm make up 62% of new openings and drive thru climbs to 15% of all outlets. Beyond the chains, Seoul’s 8,200 cafe hotspots and a 72% Gen Z preference for sustainable choices meet a 65% millennial habit of visiting 4+ times weekly, revealing why premium espresso, digital ordering, and eco focused design are reshaping margins, growth, and what consumers demand next.

Japan Restaurants Industry Statistics
From 46.3% of Japanese diners eating out at least weekly to 68.0% who actively look for clear pricing, the latest signals point to a restaurant market built on repeat visits and price transparency. Meanwhile, operators face pressure on the cost side with ¥2.9 trillion in 2021 to 2023 food and beverage inflation pass through, Tokyo rent averaging ¥19,600 a month, and bankruptcies up 8.4% in 2023, all while adoption of tablets and self order kiosks reaches 1 in 5 restaurants.
Coffee Cafe Industry Statistics
With 42% of Starbucks transactions already processed digitally in Q3 FY2024, the battle for café margins is shifting from brick and mortar to labor and tech, even as the U.S. coffee shop industry delivered $5.6B in value added in 2023 and food costs climbed 5.0% over the year through April 2024. Follow how training investments, rising ingredient and energy costs, and a growing wave of new shops are reshaping what it costs to serve an espresso and what it takes to stay profitable.
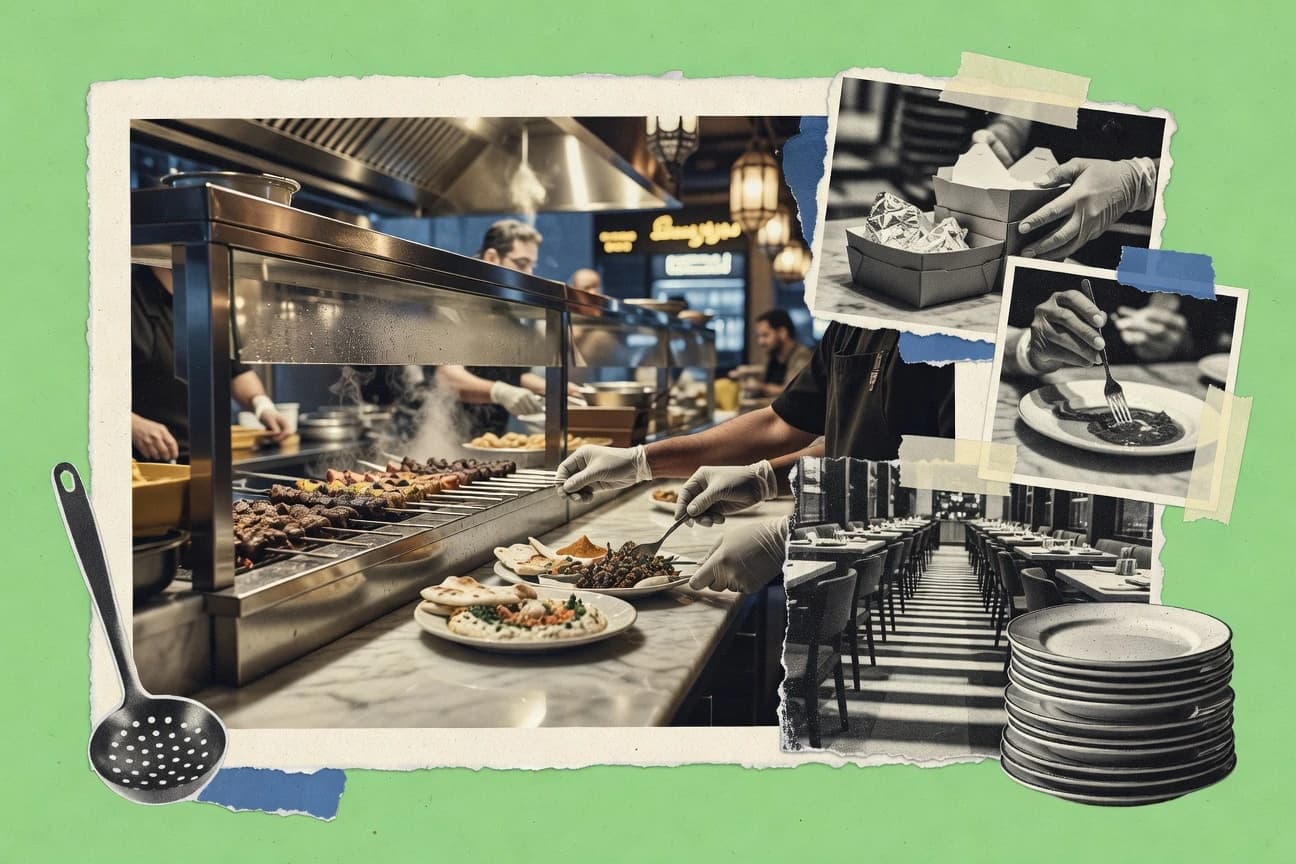
Saudi Restaurant Industry Statistics
Saudi Arabia’s restaurant and café ecosystem is being squeezed and reshaped at the same time, with 2023 showing 10.2% of food spend going to eating out and online food ordering reaching 26% of internet users, while input costs climb and wage, fuel, and FX pressures directly hit menus and staffing. For anyone making decisions in the Saudi foodservice market, this page connects the money flow behind dine in demand and cashless payments to the real cost levers, from 2023 diesel pass through to 2023 card fee ranges.

Sweden Restaurant Industry Statistics
Sweden’s restaurant scene is growing and pressured at the same time, with total revenue reaching 162.4 billion SEK in 2023 and digital payments already covering 78% of it, yet energy costs rose 28% to an average 450,000 SEK per year and VAT pressure squeezed margins by 2.4% in 2022. This page connects what diners are doing and paying, from 42% of visits turning to online ordering to monthly dining at 68.4% of Swedes, with how restaurants are responding through contactless tech at 89% and sustainability certifications held by 41% of establishments.

Foodservice Industry Statistics
Restaurant and foodservice spending hit $1.2 trillion and accounted for 6.0% of all U.S. consumer outlays in 2024, but the pay and churn behind that demand stay sharply uneven. From fast food wages at $16.20 and cooks at $18.35 to 8.5 million job openings and a 2.3% restaurant closure rate, this page connects labor, costs, pricing pressure, and how customers book and pay to the outcomes operators are actually seeing.
Bangkok Restaurant Industry Statistics
Even as Bangkok restaurants hit 15% year over year revenue growth to 450 billion THB and digital payments now account for 68%, day to day operations are strained by rising energy costs that pushed expenses up 22% and labor shortages hitting 65% of eateries. The page puts these pressures side by side with what’s changing fast, from zero waste adoption by 42% to AI menu optimization cutting food waste by 15%, so you can see exactly how Bangkok is adapting while margins get squeezed.
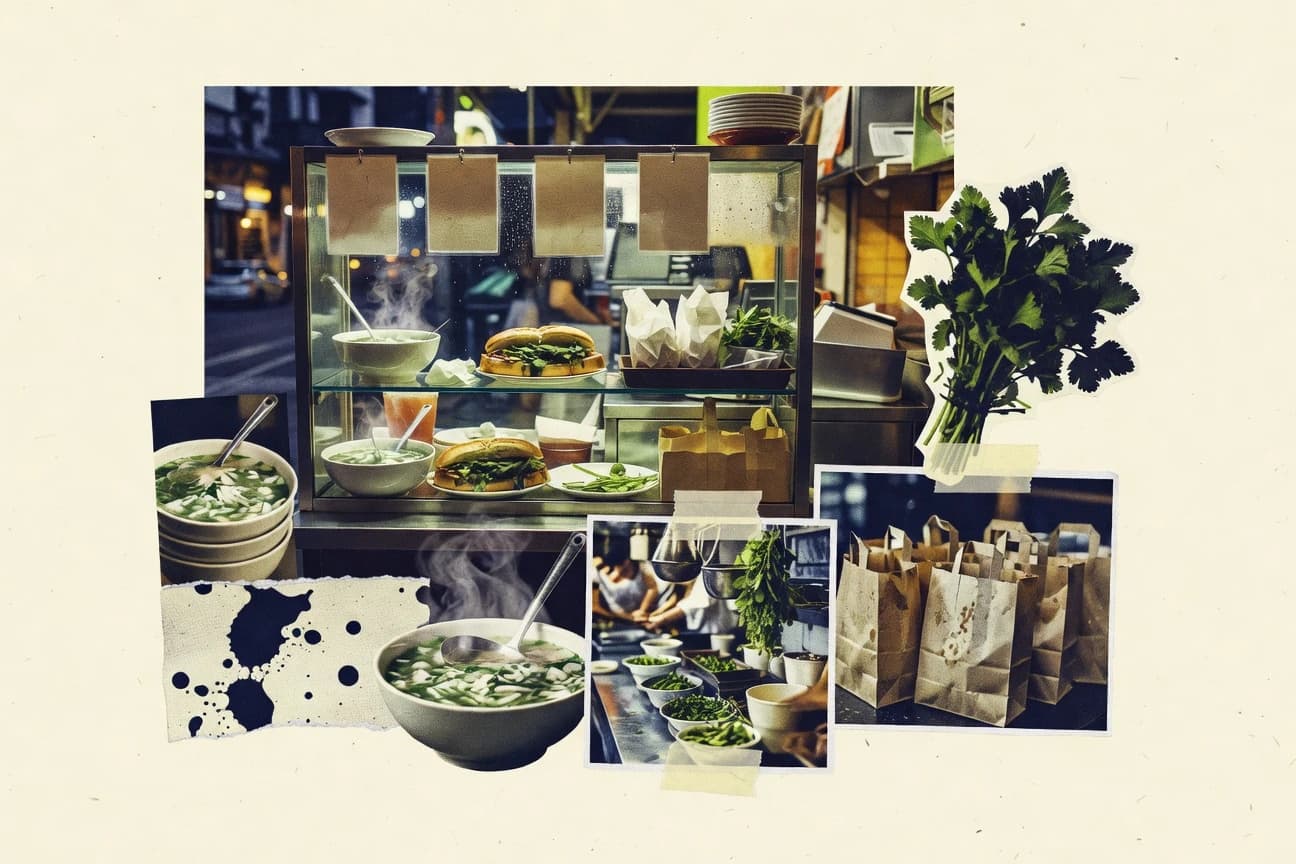
Vietnam Restaurant Industry Statistics
Vietnam’s restaurant costs are being squeezed from every direction at once, from rising service inflation and wage pressures to higher staple and import input costs, while e-commerce and internet scale up demand. See how food service value added around $20.4 billion in 2022 and online behavior supporting delivery growth, alongside a quick-service market nearing $1.8 billion in 2023 and 50.4% women in service employment, reshape hiring, pricing, and profit decisions across the dining sector.
Japan Cafe Industry Statistics
With 46.3% of Japanese consumers saying they hit cafes at least once a month and a ¥1,060 price tag for roasted coffee per 200g in 2023, the demand side looks steady even as costs squeeze fast: meals outside the home inflation is up 3.1% year over year in 2024 and wheat prices jumped 27% globally in 2022. This page pairs big industry scale like ¥2.18 trillion in Eating and Drinking Places revenue with operator realities such as wait times, ingredient cost share, and digital menu adoption to show what today’s cafe experience is really made of.
Quick-Service Restaurant Industry Statistics
With U.S. quick-service restaurant sales up to $404.3 billion and digital orders reaching 25.4% of total sales by Q4 2023, this page tracks what is moving the business right now and why chains like McDonald’s hold 43.2% market share by sales while Dunkin and other competitors fight for loyalty. You will also see how operational pressure meets customer priorities, from 78% family drive-thru preference and 227.5 second average service time to food safety incidents down 22% with digital tracking, plus brand wins ranging from Chipotle’s $2.8 million highest fast-casual AUV to Taco Bell’s 8,000 plus U.S. units.
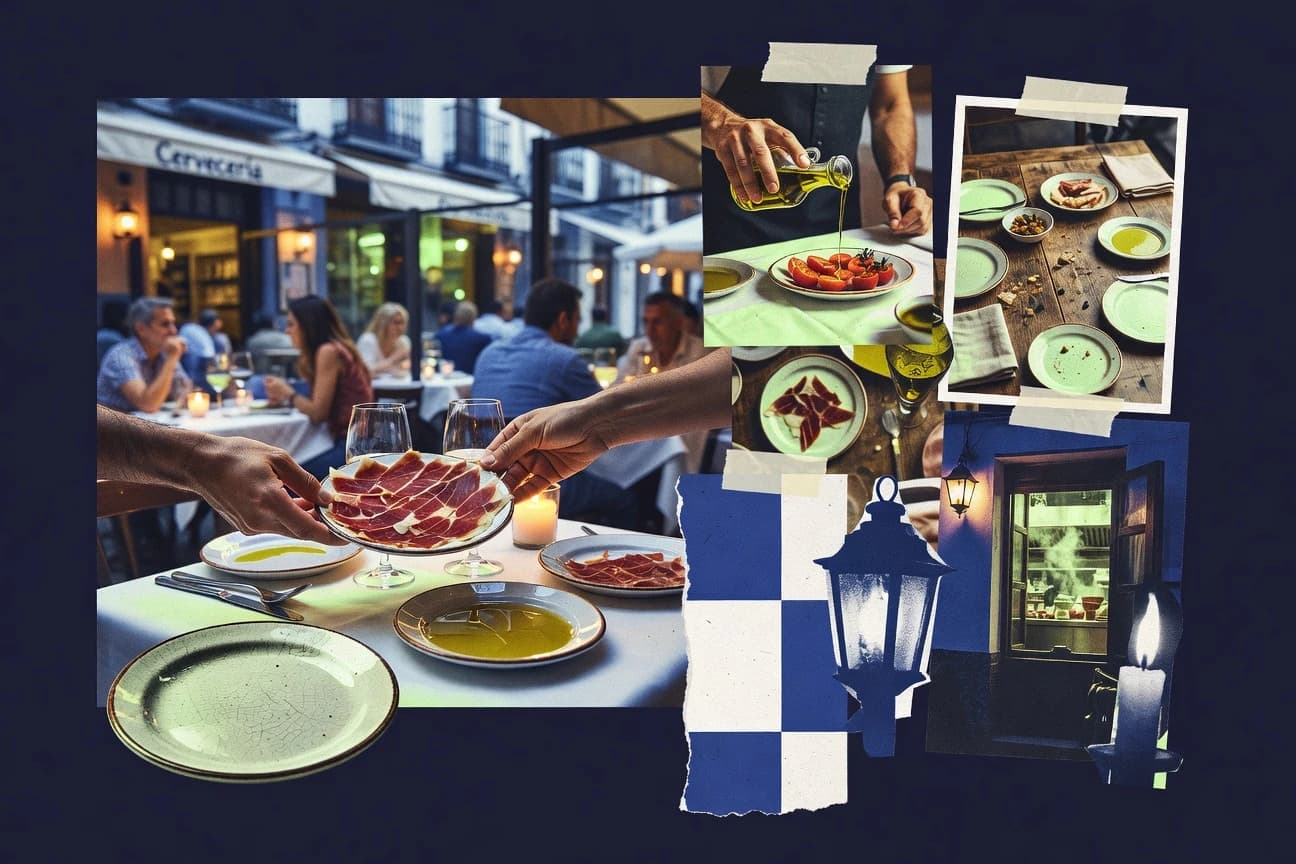
Spain Restaurant Industry Statistics
Spain is home to 270,000+ restaurants and consumer spending at cafés and restaurants is still up 2.4% in inflation adjusted terms, yet ingredient inflation ran hotter with food purchase costs averaging 7.5% and electricity for businesses averaging €0.22 per kWh. From POS and contactless reaching 62% to QR menus at 48% and online delivery orders with Spain at a 7.3% European share in 2024, this page connects rising costs, fast digitization, and labor pressure in hospitality.
Korea Restaurant Industry Statistics
With 7.9% projected value growth for South Korea’s foodservice in 2024 alongside faster payment adoption like 78% contactless at quick service restaurants and smartphone driven ordering at 93% penetration, the industry is moving quickly even as costs tighten. This page lays out the full squeeze and opportunity behind Korea’s restaurant boom, from 54,000 plus operating establishments and franchise sales of about $4.3 billion to rent at 12% of operating costs and food inputs rising 5.2% in 2023.
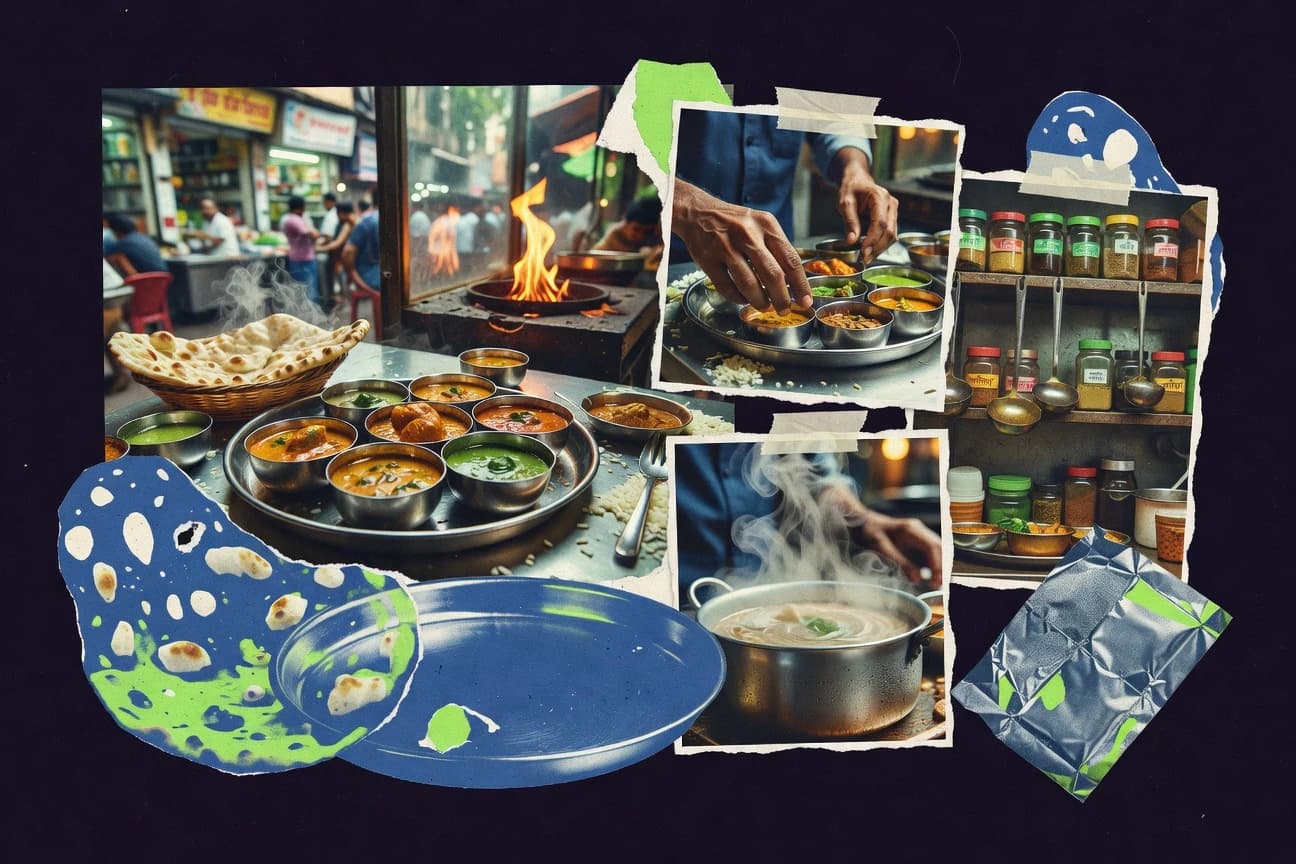
India Restaurant Industry Statistics
India’s restaurant scene is showing a sharper split than most people expect, with 2026 projections pointing to faster growth in key segments while tighter margins and rising costs reshape what “busy” looks like on the ground. Read the numbers behind the shift in outlets, spending, and hiring so you can see where demand is accelerating and where it is quietly cooling.
Dubai Restaurant Industry Statistics
Dubai’s restaurant scene is showing sharp movement, with 2026 indicators pointing to how quickly demand, spending, and staffing needs are reshaping what diners can expect next. If you want to understand where the industry is gaining momentum and where pressure is building, these Dubai focused statistics make the shift impossible to miss.

Italy Restaurant Industry Statistics
Italy’s restaurant industry outlook keeps tightening, with 2026 projections pointing to fewer diners and heavier pressure on margins as costs rise faster than pricing. This page puts the most current signals side by side so you can see where demand is slipping and which revenue levers are still working.

Meal Delivery Industry Statistics
See how meal delivery is reshaping demand and margins with 2025 signals that don’t match the older boom narrative, from faster reorder behavior to the quieter pressure on profitability. If you’re making decisions in Meal Delivery Industry, these stats turn customer habits and unit economics into a clear, now reality.
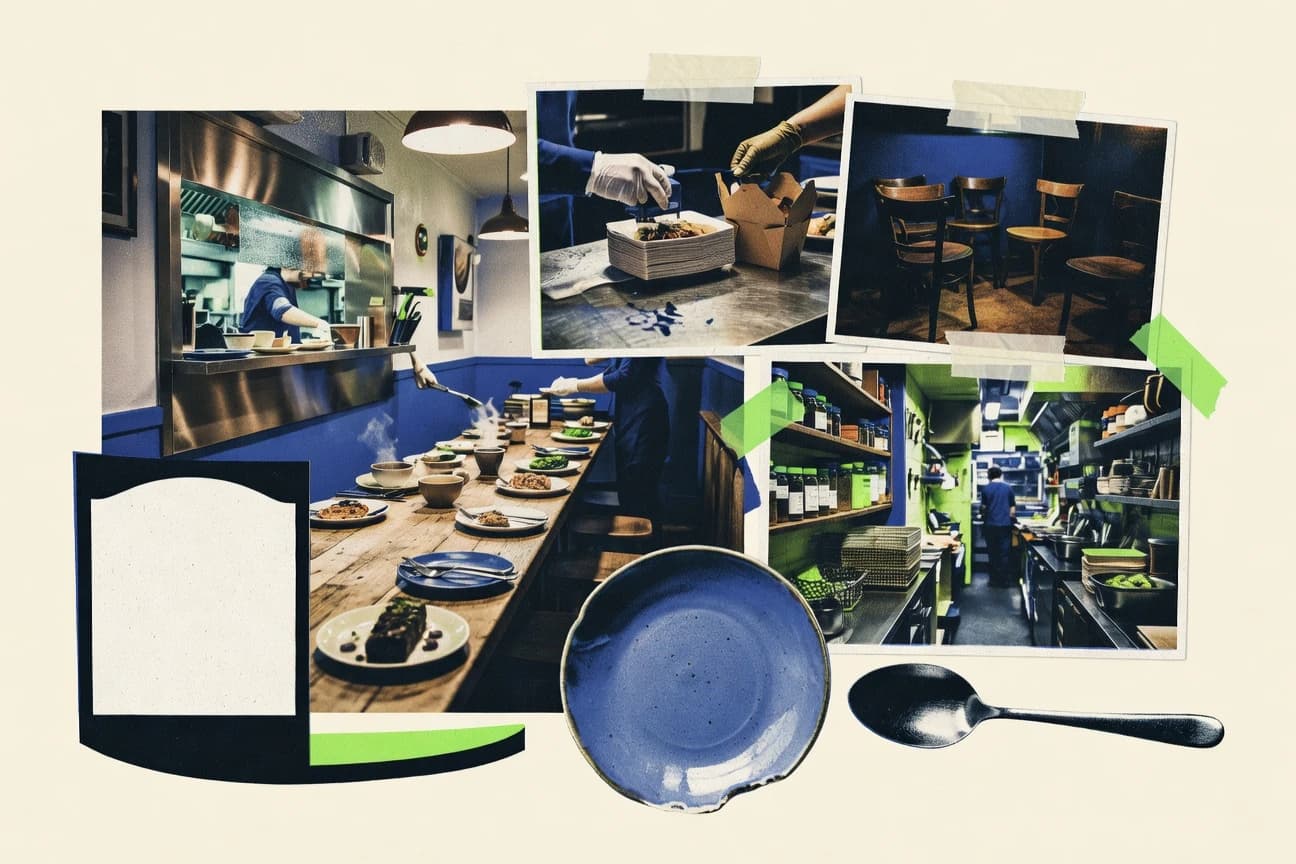
Uk Restaurant Industry Statistics
Fresh 2025 UK restaurant figures reveal how quickly operator pressures are changing, with costs and staffing concerns reshaping what “business as usual” looks like. If you run, invest in, or report on the sector, these numbers help you spot where demand is holding steady and where it is slipping.