Market data
Food Service Restaurants
Explore verified food service restaurants statistics and market research reports with sourced data and trend analysis.
Latest update:
 Claire Beaumont
Restaurant Statistics
Online ordering adoption hit 62% of U.S. diners in 2023—discover the restaurant stats behind this shift.
Sports Bar Industry Statistics
Independent sports bars control 68% of U.S. locations but only 55% of national revenue—see how game-day demand changes the numbers.
Foodservice Equipment Industry Statistics
Quick-service restaurants drive 45% of U.S. foodservice equipment demand in 2023—see how regional buying patterns and product trends evolve next.
Portugal Restaurant Industry Statistics
68% of Portuguese consumers dine out at least weekly (up from 52% in 2021). Explore what’s driving Portugal’s restaurant boom.
Japan Catering Industry Statistics
In 2023, Japan’s catering industry generated ¥27.8 trillion and grew 3.5% YoY—discover the consumer, labor, and tech shifts powering momentum.
Singapore Restaurant Industry Statistics
68% of 18–34-year-olds order restaurant delivery monthly in 2023—discover how this demand shift changes menu planning, staffing, and service in Singapore.
Japan Bar Industry Statistics
In Tokyo, bar revenues reached 850 billion yen in 2022 (28% of Japan’s total)—and premium spirits and craft cocktails are pushing momentum. Explore the figures behind the buzz.
Fine Dining Industry Statistics
Global fine diners: 55% book via apps instead of calls—reservations move faster. See what drives the shift in 2024.
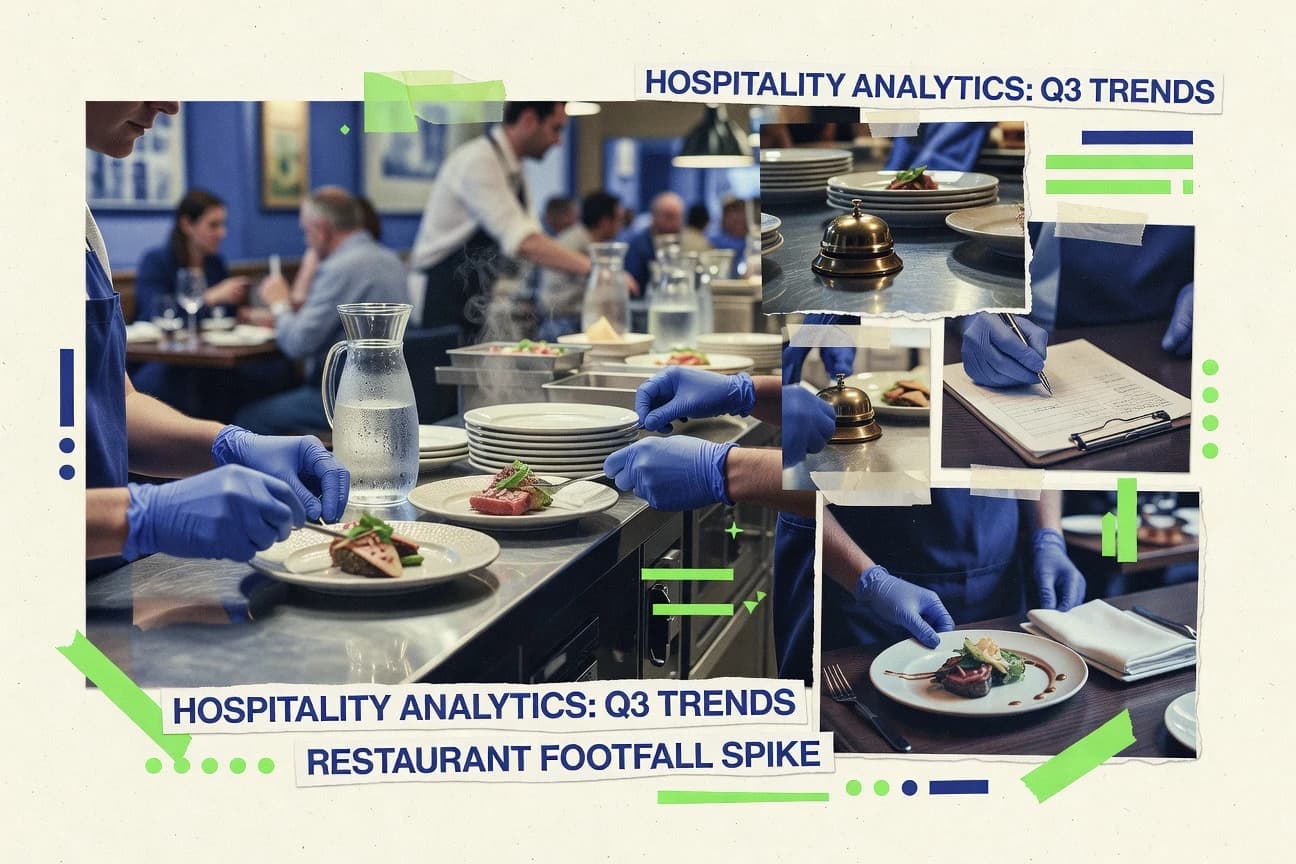
Restaurants Hospitality Industry Statistics
38% of consumers say price is the top factor in 2023—explore how that one choice reshapes menus, costs, and demand.
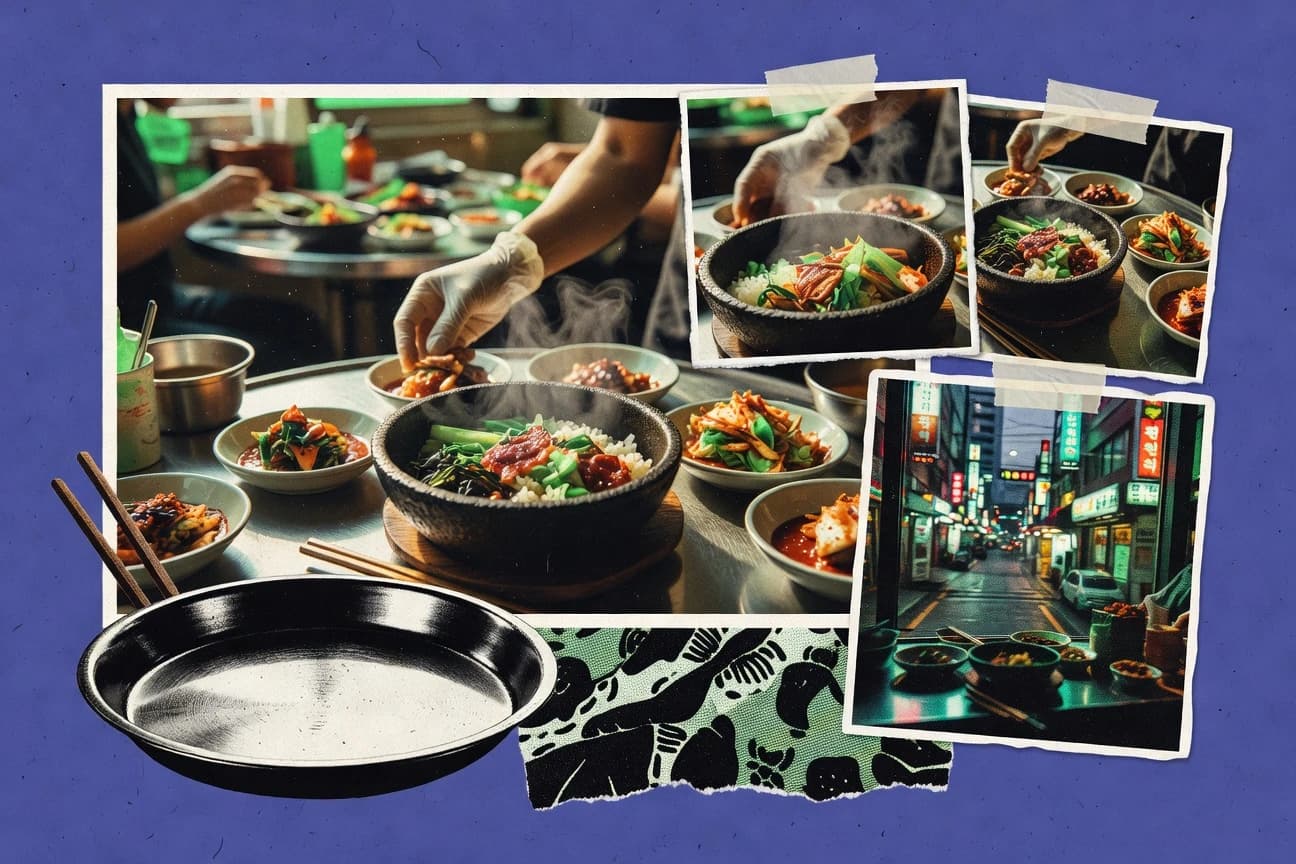
South Korea Restaurant Industry Statistics
Delivery made up 45% of restaurant meals in 2022, and digital tax reporting is now used by 82% of restaurants—see the numbers behind demand.
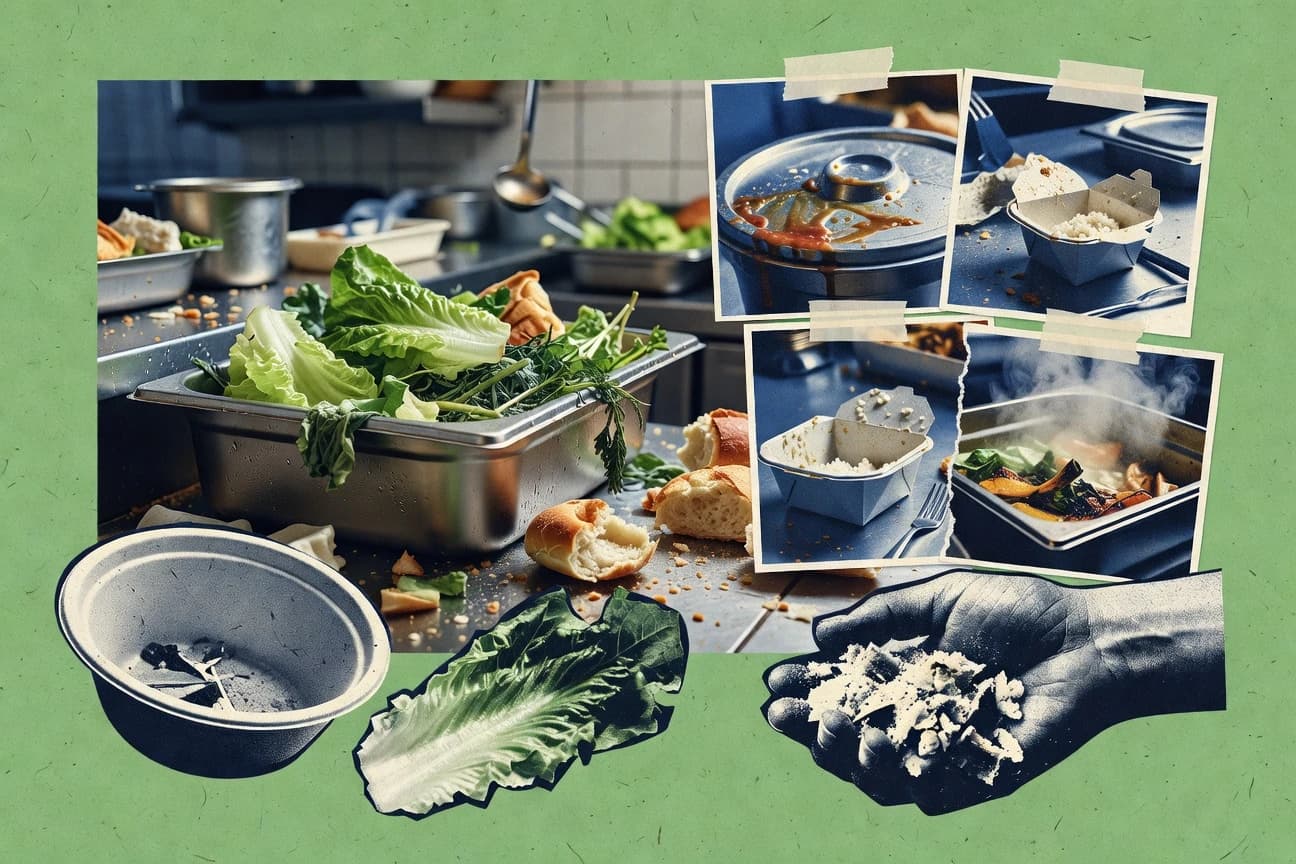
Food Waste In Restaurants Statistics
UK restaurants’ over-preparation drives 38% of food waste (WRAP)—see the fixes that prevent bins filling up daily.
Restaurants Bar Industry Statistics
In 2023, 42% of consumers favored quick-service spots for lunch—while delivery made up 15% of U.S. restaurant sales. Explore what that means for bar operators.
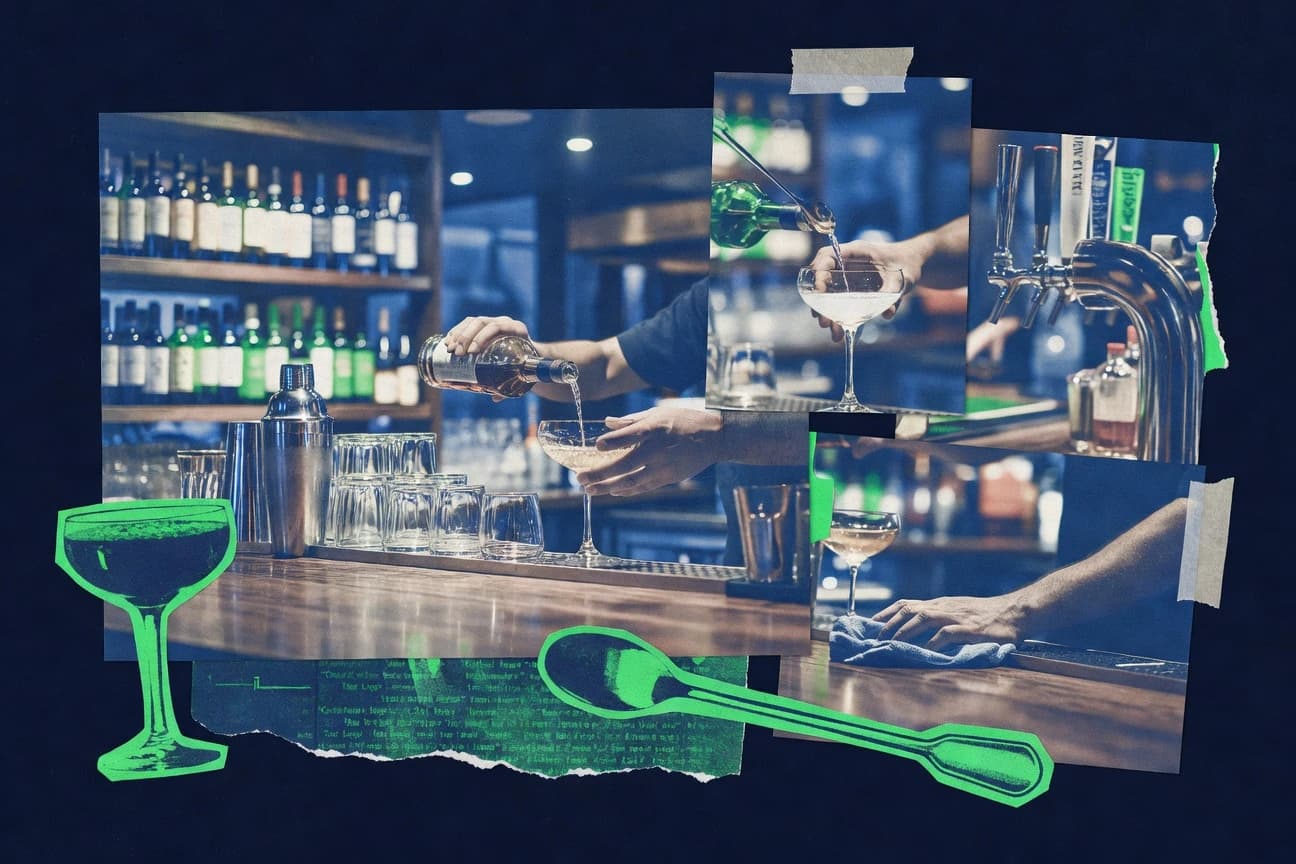
Bartending Industry Statistics
Low/no-alc cocktails now account for 15% of U.S. bar menu sales (up from 5% in 2020)—a trend reshaping menus and demand.
Foodservice Restaurant Industry Statistics
39% of restaurants closed permanently post-2023—see the Foodservice Restaurant Industry stats on recovery pressure and shifting demand.
Private Chef Industry Statistics
US private chef bookings rose 45% year-over-year in 2023—despite supply chain costs climbing 22%. Explore what’s driving the demand boom.
Eating Out Statistics
Eating out meals account for 34% of U.S. daily calories and can raise obesity risk by 25%—see what those choices mean.

Restaurant Customer Service Statistics
Dining delays drive repeat exits—28% of diners leave less frequently when food takes too long. Improve service to protect visits.
Quebec Restaurant Industry Statistics
Quebec diners keep the industry humming with 72% dining out at least weekly and contactless payment landing in 89% of restaurant transactions, while online ordering adoption reaches 67% in the same year. Yet costs and churn remain the tension point, with labor taking 38% of operating expenses and an average 78% annual staff turnover, alongside 55% of seniors dining out less after 2022.
Brazil Restaurant Industry Statistics
Restaurant activity in Brazil is quietly accelerating with a 1.2% year over year rise in food and beverage service activities in 2023 and a 5.7% jump in restaurant volume in 2024 Q1, even as margins are pressured by costs that typically consume 2.4% of sales for energy and an 8.2% inflation bite on food and non alcoholic beverages. For anyone betting on what happens next, the page connects demand signals like 30 minutes median delivery time and WhatsApp daily use with operating realities such as R$ 71.3 billion in annual restaurant revenue and 19.5% of workers in the sector living with informality.

Drive Thru Restaurant Statistics
Drive-thru channels handled 58% of QSR visits, turning lane design, order accuracy, and labor costs into the real competitive battleground behind quick service. See how U.S. fast food at $324.6B and 196,400 QSR locations collide with the details that matter, from a 1% lift in order accuracy reducing remakes and credits to digital ordering and queue changes that cut time per order.